
Abstract
A model based on the volume of fluid (VOF) method and leaky dielectric theory is established to predict the deformation and internal flow of the droplet suspended in another vicious fluid under the influence of the electric field. Through coupling with hydrodynamics and electrostatics, the rate of deformation and internal flow of the single droplet are simulated and obtained under the different operating parameters. The calculated results show that the direction of deformation and internal flow depends on the physical properties of fluids. The numerical results are compared with Taylor's theory and experimental results by Torza et al. When the rate of deformation is small, the numerical results are consistent with theory and experimental results, and when the rate is large the numerical results are consistent with experimental results but are different from Taylor's theory. In addition, fluid viscosity hardly affects the deformation rate and mainly dominates the deformation velocity. For high viscosity droplet spends more time to attain the steady state. The conductivity ratio and permittivity ratio of two different liquids affect the direction of deformation. When fluid electric properties change, the charge distribution at the interface is various, which leads to the droplet different deformation shapes.
1. Introduction
The droplet deformation could be induced through the application of an external electric field. When a droplet suspending in another viscous liquid under a uniform electric field, electrical stress may be generated on the droplet surface due to the different electrical characteristics between two different fluids. The droplet would produce deformation or surface instabilities leading to disintegration of droplet due to electrical stress on the droplet surface. The electrical stress applied to the droplet surface may cause the droplet deformation and tangential motion at the surface, which may lead to strong circulating flow and fluid mixing. The breaking up of droplet in another viscous liquid has been widely applied to many liquid/liquid processes and industries for atomization, inkjet printing, enhanced coalescence, emulsion breaking, chemical reaction promoting, and so forth [1–6]. Recently, the developments of microfluidic devices have indicated that an isolated droplet suspended inside a viscous liquid could be used as a microreactor for biochemical processes [7]. In such a situation, the droplet deformation could conceivably be used to induce the mixing of liquid inside the droplet. Therefore, it is very important to effectively predict deformation of droplet and inner flow inside droplet in another immiscible viscous liquid.
The deformation of a single droplet suspended in another immiscible liquid under the influence of an external electrical field has been investigated previously using different models and methods. Melcher and Taylor reviewed and summarized early experimental and theoretical works [8]. Taylor proposed a theory named “leaky dielectric model,” which could effectively predict droplet deformation and proposed a criterion which could determine the direction of deformation. However, it was proven to be able to predict small deformation of droplet with a small and finite conductivity and a finite difference of dielectric permittivity [9]. Torza et al. extended Taylor's theory to explain droplet behavior under an alternating electric field and compared it with experimental results for various liquid-liquid systems [10]. Sherwood obtained electric field and flow field distribution by solving the Laplace equation and the N-S equation, respectively, using the boundary integral method, investigated the deformation of a single droplet under the influence of external electromagnetic field, discussed the effect of the permittivity and conductivity on the droplet deformation, and indicated the liquid viscosity which was also an important factor. However, his analysis was limited to low Reynolds number cases and the viscosities of droplet and surrounding liquid were assumed to be equal [11]. Feng and Scott numerically studied deformation of a single droplet suspended in axisymmetric flow field at low Reynolds number and discussed the effect of electric strength and Reynolds number on the droplet deformation [12]. Tsukada et al. presented a finite element computational technique to calculate inside and outside a dielectric droplet suspended in another dielectric fluid under a uniform electric field. The results were in good agreement with Taylor's analytical solutions and author's experimental observations [13]. Hirata et al. predicted the behavior of the compound droplet which was composed of the shell and core phases and suspended in a continuous phase under the influence of electric field using the same method. The effect of the electric field strength and the volume ratio of the core phase to the shell phase on the circulation induced in each phase and the droplet deformation have been investigated [14]. Reddy and Esmaeeli numerically studied deformation of and internal flow inside cylindrical fluid immersing another immiscible viscous liquid considering the influence of the electric field forces and the surface shear stresses. The results indicated that the conductivity of two liquids and dielectric permittivity ratio of two different liquids were important factors which could affect the surface deformation and circulation flow inside cylindrical fluid [15]. Despite that much work has been done by the formers, there is some important work that has to been done due to complication of two liquid-liquid system.
In modeling and simulation of two-phase electrohydrodynamic flows, it is very important how to treat the interface where the electric stress is acted on. As presented above, the finite element method and the boundary integral method were used to treat the interface as being infinitely thin and the forces (electric stress and surface tension) that acted at the interface are applied as a boundary condition [11–14]. But this method is inaccurate for the calculation of surface tension. Some methods which treated the interface as a finite width region where the physical properties continuously transitioned from one phase to another phase were presented in recent years [16–19]. Zhang and Kwok investigated the droplet deformation driven by electrohydrodynamics using a multicomponent LBM method that a cosine function was employed to describe such transition interface. The numerical results were found to be in accordance with previous results obtained from conventional methods. Further, this algorithm and simulation could be implemented to the more complex electrohydrodynamic system [16]. Tomar et al. numerically studied two-phase electrohydrodynamic flows under the volume-of-fluid paradigm and a weighted harmonic mean interpolation scheme to smoothen the electric properties in the diffused transition region (interface). The results indicated that the interpolation scheme to smoothen the electric properties (conductivity and permittivity) in the interface transition region had a significant influence on the solution in the bulk [17]. Hua et al. summarized three different kinds of electric fields: leaky dielectric model, perfect dielectric model, and constant charge model and numerically investigated the deformation of droplet and internal flow inside droplet by employing the interface tracking method where the interface was considered to have a finite thickness of the same order as the mesh size instead of zero thickness [18]. Lin et al. proposed the phase field method to study the two-phase electrohydrodynamic flow which was generated by electric field. The model was validated and found to be in good agreement with existing analytical solution and numerical results [19]. Although extensive works have been done, some difficulties still exist, for instance, limitations of model and complication of algorithm. Great efforts on exploring effective model are still made.
With the development of model for studying electrohydrodynamics, the most effective way to simulate the two-phase electrohydrodynamic flow is taking into account the interface as a continuous transition region. In present paper, a numerical model based on volume-of-fluid (VOF) model and leaky dielectric theory is presented. The interface is treated as a finite thickness region where the volume-weighed method is employed to obtain the physical properties. The electric stress and the surface tension which is computed by continuous surface force method (CSF) are acted only at the interface [20]. The deformation and internal flow of a single droplet suspended in another immiscible viscous liquid are calculated using leaky dielectric model and by solving N-S equations for different operating parameters. The deformation rates would be analyzed under different voltages. The internal flow patterns would be investigated and discussed for different physical properties. The calculated results would be compared with the experimental results by Torza and Taylor's theory. In addition, the effect of fluid properties and internal flow on deformation rate and deformation velocity is analyzed in this work.
2. Mathematical Model and Boundary Conditions
2.1. Assumptions
For a dispersed droplet with initial static state suspended in an immiscible viscous liquid, the model of deformation and internal circulating flow is established under the following assumptions: two different immiscible liquids are homogeneous Newton viscous liquid which could be incompressible; flow is axisymmetric and laminar; the temperature of fluid is constant; the order of droplet size is millimeter order; the two-liquid densities are very close and the gravity may be neglected in this problem; the model of two-dimensional flow would be employed [15, 18].
2.2. Governing Equations for Two-Phase Flow
The incompressible flow field simulation is formulated by solving the governing equations of mass and momentum conservation. The mass conservation over the whole numerical simulation area could be expressed as

where
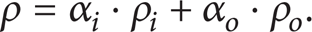
In this problem, the Navier-Stokes equations of the two-phase flow system should take into account the interface tension and the electric stress and could be expressed as
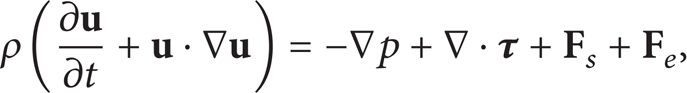
where ρ is the density of liquid, p is the pressure, and μ is the dynamic viscosity of fluid.
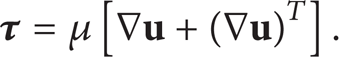
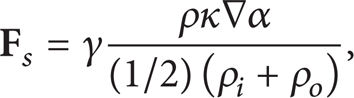
where
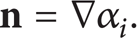
κ is the curvature that is defined in terms of the divergence of the unit normal

ρ i is the droplet density, ρ o is the outer liquid density, and ρ is the density at the interface
where
2.3. Governing Equations for Electric Field and Leaky Dielectric Model
In some previous works, the electrohydrodynamics in two flows have been reported by Melcher and Taylor [8] and Hua et al. [18]. In electrohydrodynamics, the magnetic effects would be neglected due to very small dynamic currents. The charge conservation could be expressed as follows:

where
According to Gauss law in a material with permittivity, the free charge density could be described as follows with the electric displacement (
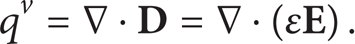
In this work, where σ and ε are constants, the distribution of free charge density q
v
could be found taking ∇·

Integrating (11), the distribution of free charge with time could be obtained

where q0
v
is the initial free charge density which decays due to the electric relaxation time
In electrohydrodynamics and two-phase flow, the viscous time scale of the fluid motion is given by
Due to the absence of an external magnetic field and for very small dynamic electrical currents, it is possible to ignore the degree of magnetic induction and to decouple the electric and magnetic field. The electric field can be expressed in terms of electric potential:
where V is electric potential.
So, the charge conservation equation can be written as

For a two-fluid system, having constant electrical conductivities, (12) reduces to Laplace equations in each medium

The boundary conditions at the interface are continuity of the electric potential and electric current:

where ∥∥ represents a jump across the interface.
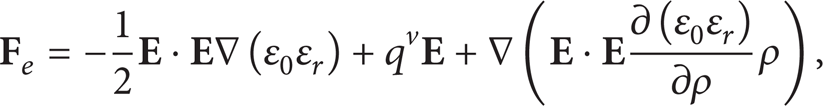
Based on (13) and (14), the electric field strength can be obtained. According to (10), the distribution of volume electric density can be obtained. With the quasistatic assumption of electric field and the distribution of electric strength and electric charge, we can acquire the electric stress only existing at the interface:

2.4. Physical Model and Boundary Conditions
A schematic two-dimensional axisymmetric model is illustrated in Figure 1 and the numerically calculated region is selected as 10R d × 10R d in the present work. The computational domain is sufficient enough to ensure that the deformation and internal velocity of the droplet could not be affected by the influence of boundary conditions. An axisymmetric fluid droplet of radius R d , density ρ i , viscosity μ i , relative permittivity ε ri , and electric conductivity σ i , suspended in an another immiscible viscous liquid of density ρ0, viscosity μ0, relative permittivity εr0, and electric conductivity σ0, could be assumed in this present paper. The computational domain includes two different liquids, the droplet (represented by subscript i) and the outer liquid phase (represented by subscript o). At the beginning of the computational process, the droplet is assumed to be in the center of the outer liquid, and spherical. When the suspension system is located in the electric field, the electric potentials are applied to two parallel plates (the positive is at upper plate and negative is at lower plate, in Figure 1) and then the uniform electric field would be generated along the z direction. In order to avoid the effect of gravity, the density of droplet is selected to be identical to the density of surrounding liquid. The interface tension coefficient γ between two different liquids is assumed to be constant.

Physical model.
When numerical simulation is carried out, the boundary conditions of a single droplet in microgravity and suspended in another immiscible liquid are shown in Table 1. The boundary conditions of solving the electric field are to be set, where the upper plate is set to be V/+, and while the lower plate is set to be V− = 0. On the edges of b and d, the boundary condition satisfies
Boundary conditions.

Physical properties of two different liquids [10].

3. Results and Discussion
3.1. Droplet Deformation Rate
In order to examine whether the numerical method (VOF coupled with leaky dielectric model for two different liquid properties) could effectively predict the deformation and inner flows, the results calculated from this work should be compared with previous works. In present paper, we consider the sixteenth group materials which are 200F silicone oil and oxidized castor-oil in the experiment provided by Torza et al. in 1971. The 200F silicone oil is assumed to be a spherical droplet suspended in oxidized castor oil which is assumed to be outer continuous liquid. The electric field would be generated when the electric potential is applied on the two plates, and the strength of electric field is set to be 1500 V/cm, 2500 V/cm, and 3500 V/cm, respectively.
In order to characterize the deformation of droplet in electric field, the deformation rate (D) has been proposed and is calculated using the following expression [22]:

where L is the end-to-end length of the droplet measured along the z direction and B is the maximum breath in the traverse direction.
Figure 2 shows the comparison of droplet deformation rate between the calculated results (top) and the experimental observations (bottom) with different electric field strength. The droplet deformation rate would be increased with the increasing of electric field strength. The droplet suspended in another viscous liquid gradually deforms from sphere to ellipsoid, and the deformation process is obviously observed using the numerical method. In our calculated results, the single droplet deformation rates are D = −0.0205, D = −0.063, and D = −0.143 under the electric field strength of 1500 V/cm, 2500 V/cm, and 3500 V/cm, while D = −0.0202, D = −0.062, and D = −0.139 in experimental results by Torza et al. The comparison indicates that the deformation rate obtained by numerical calculations is in accordance with the experimental data.

Comparisons between computational and experimental results.
In fact, an early theoretical analytical expression about prediction of droplet deformation rate under influence of external electric field has been presented by Taylor [9]. This formula is a function of electric field strength, material properties (electric conductivity, permittivity, and viscosity), droplet size, and so forth and could be written as follows [11]:
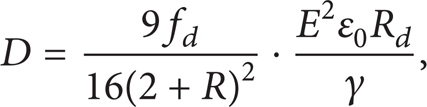
where E is the outer electric field strength. R d is the droplet radius. ε0 is the continuous-phase permittivity. fd is the criterion for the deformation direction, and it could be expressed as [11]
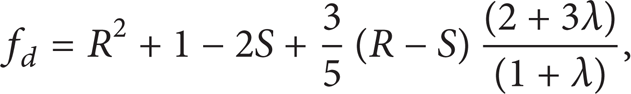
where
The calculated results are also compared with analytical prediction deformation rate obtained by Taylor G, which are D = −0.0195, D = −0.0543, and D = −0.1064 for conditions of respective electric field strength. Figure 3 shows the comparison of experimental, theoretical, and numerical results for the same operating conditions and material properties. The deformation rate obtained through three different methods would become bigger with the electric strength increasing. When the electric field strength is 1500 V/cm, the data from different methods almost overlaps each other. The droplet deformation rate obtained by VOF approach is in accordance with the experimental results and analytical data for around D = −0.02, which is tiny deformation rate. With the increasing of the strength of electric field, the deformation rate would be increased gradually. The numerical simulation results still overlapped the experimental data, while the analytical results have some discrepancy with the experiment and the discrepancy would be growing with the increasing of the electric strength. Compared with the experimental results, the discrepancies are 1.49%, 1.61%, and 2.88% for numerical simulation results, while −3.47%, −12.4%, and −23.4%, respectively, for analytical data. It is clear that there are larger errors in predicting of droplet deformation rate for analytical method. The analytical method is only used to predict the tiny deformation rate of which the value should satisfy |D|<0.05.
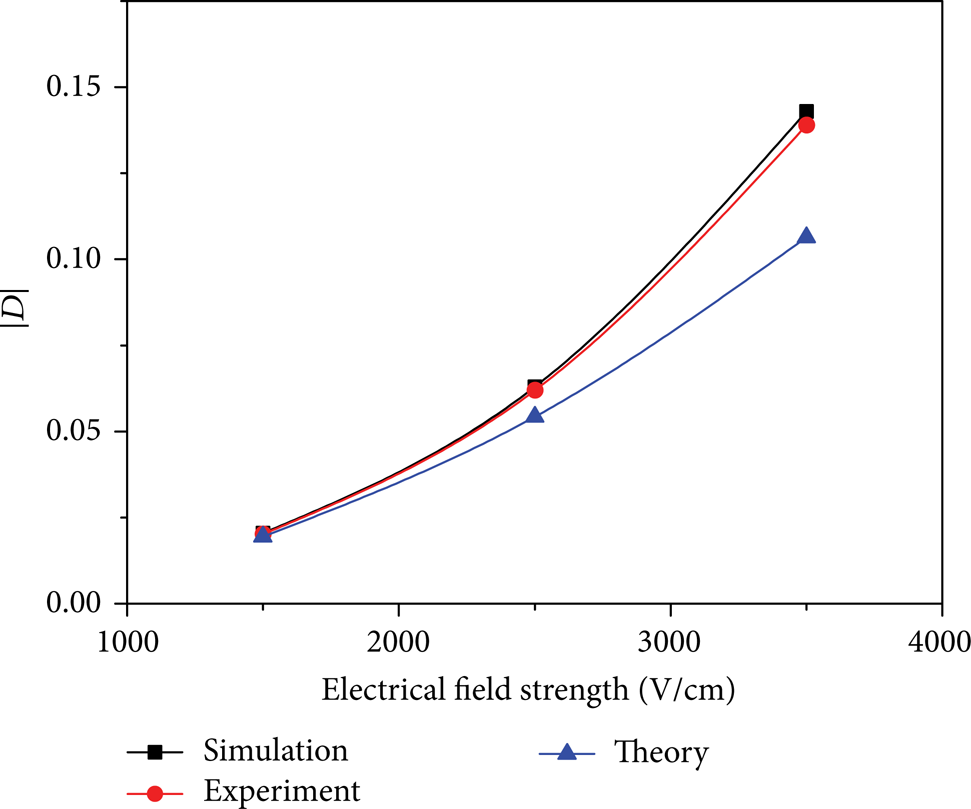
Relationship between deformation rate and electrical field strength variations.
3.2. The Interior Flow inside the Droplet
In the leaky dielectric model, when the leaky liquid droplet arrives at a steady state under influence of the external electric field, the four steady circulations along the interface would be generated inside the droplet due to the shear stress at the interface generated by accumulated charge which is produced by applying electric field. According to Taylor's theory, the maximum value of the tangential velocity is obtained at the droplet interface of π/4, 3π/4, -π/4, and −3π/4, as shown in Figure 4, and there are four circular vortex flows generated inside the droplet. A criterion which distinguishes the direction of interior flow has been proposed in previous work and is expressed as R/S. When R/S>1, the direction is from the equator to the poles (the equator is an imaginary line around the middle of the droplet, and the pole denotes the ends of z axis); when R/S<1, the direction is from the poles to the equator. Figure 4 shows the internal streamline and interface velocity distribution of the single droplet suspended in another immiscible viscous liquid, while E = 2500 V/cm and the stable state is obtained. In this case, the physical properties of materials in Table 2, R/S = 0.075<1, could be calculated. It could be found in Figure 4 that the circulation direction is from the poles to the equator, corresponding to the deformation rate D = −0.063, and the tangential maximum velocity is reached nearby π/4, 3π/4 of the interface. The simulation results are reasonably in good agreement with theoretical solutions. Although the interface velocity is millimeter order, it may have an important effect on the heat and mass transfer between the suspended droplet and the surrounding liquid.

Flow patterns in droplet and interface tangential velocity.
In order to verify the applicability of the model, another group liquid is adopted and listed in Table 3. The suspended droplet is assumed to be corn oil and the outer liquid is selected to be silicone oil and the external electric field strength is set to be E = 1500 V/cm. From (21) the droplet deformation identification number f d = 18.8>0 and the direction criterion R/S = 3.25>1; therefore the droplet would deform along the z direction and the interior flow direction inner droplet is from the equator to the poles. The droplet deformation rate and interior circulation flow inner droplet would be obtained by VOF method and leaky dielectric model, as shown in Figure 5. The droplet deformation rate D = 0.131 indicates the single droplet deformation along the z direction, and the interior circulation flow direction is found from the equator to the poles and the results well agreed with fd and R/S. In this case, the maximum interfacial velocity is observed nearby π/4, 3π/4 of the interface, which agreed with the Taylor theory prediction results. In this present work, the predictions for the droplet deformation and interior circulation flow by VOF method, Level Set method, and the front tracking method (Front Tracking Method) are compared together. The results obtained by different methods almost have the same and good prediction to these similar problems. It could be known that VOF approach which tracks the interface has a better prediction for droplet deformation rate and interior circulation flow inner droplet suspended in another immiscible viscous liquid.
Physical parameters of two different liquids [15].


Droplet deformations, flow patterns inner droplet, and interface tangential velocity.
3.3. Effect of Viscosity on Deformation Velocity
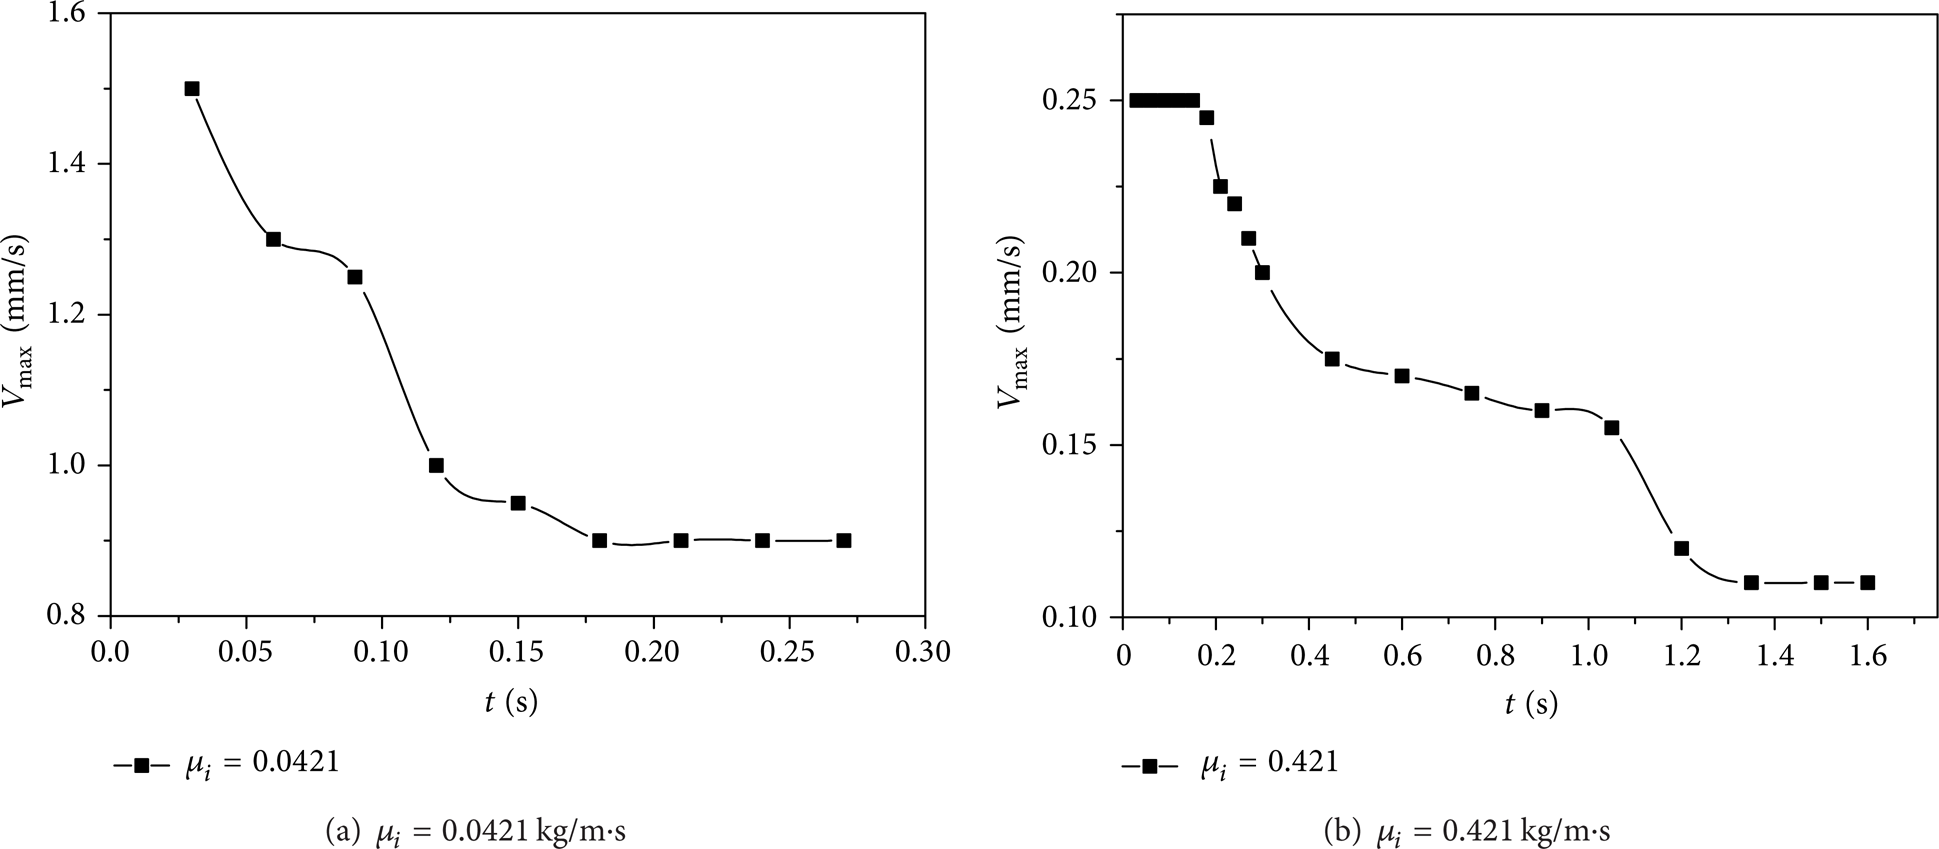
A dielectric droplet exploring into electric field undergoes deformation and internal circulating flow due to the net charges accumulating on the interface between continuous liquid and an immersed droplet, which results in the electric stress at the interface. The deformation rate, namely, D, as shown in (20), illustrates the maximum deformation rate when the dielectric droplet is at the steady state. From (20) and (21), the primary factors determining the value of D are the fluid electric properties, namely, permittivity ratio (S) and electric conductivity ratio (R), while the fluid viscosity hardly affects the value of D. Results in this work show that the fluid viscosity dominates the deformation velocity. Essentially, the droplet deformation is the interface motion under electric field force. But the electric field force has to overcome viscous resistance, which leads to lower interface velocity for higher viscosity liquid. So, for the lower viscosity of droplet, the time which the dielectric droplet needs to get steady state is short, while for the higher viscosity of droplet, the time is long. In order to find the effect of viscosity on the droplet deformation rate, the two different continuous viscous liquids are chosen. In this work, the viscosity value of corn oil in Table 3 is factitiously increased from 0.0421 to 0.421 kg/m·s and the rest of physical parameters remains invariable. The deformation processes of two different viscous droplets are plotted in Figure 6. It could be found that when droplet viscosity is set to be 10 times of original value, the final deformation rate (D) is coincident but the time which droplet needs to attain steady state is obviously extended. For μ i = 0.0421 kg/m·s, the droplet nearly attains the steady state at t = 0.3's. However, for μ i = 0.421 kg/m·s, it needs 1.5's. This shows that the droplet deforms much slower with increasing viscosity and the final deformation rate (D) is not dominated by droplet viscosity.

Droplet deformation rate at different time.
The droplet deformation motion is induced by the electric stress which is generated at interface due to electric field. First, the electric stress should overcome the viscous force existing interface between two different liquids. When the droplet viscosity is larger, the interface velocity is low. The droplet deformation velocity also becomes slow, which makes the droplet need more time to attain steady state. Figure 7 shows the maximum interface velocity at various times for two different viscosities. Compared to the maximum interface velocity of two cases, it is obvious that the small viscosity droplet obtains larger velocity. For μ i = 0.0421 kg/m·s, the droplet has higher interface velocity which accelerates droplet deformation in the first 0.1's as shown in Figure 7(a). In the following 0.2's, the lower interface velocity makes droplet deformation slow until it attains steady state. For μ i = 0.421 kg/m·s, there is the corresponding relation between the interface velocity and droplet deformation velocity. The higher interface velocity accelerates the droplet deformation in the first 0.45's and in the following 1.05's, with the decreasing of the interface velocity, droplet slowly deforms until attaining steady state.
Maximum interface velocity at various times.
3.4. Effect of Electric Properties of the Liquids on Droplet Deformation
When the droplet and surrounding liquid are leaky dielectrics and are exposed to an external electric field, the droplet deforms into either prolate or oblate ellipsoid. The final shape of the droplet depends on ratio of two different liquids in conductivity and permittivity. In above part, the effect of viscosity on deformation is presented. It is necessary to show the effect of conductivity and permittivity on the deformation. Firstly, the conductivity ratio (R) is changed in Table 3 and the rest of physical parameters remain invariable. The deformation rates under different conductivity ratios are illustrated in Figure 8. When R = 1.1, the droplet nearly remains unchanged. For ratio larger than 1.1, the droplet takes prolate shape. For radio less than 1.1, the droplet takes oblate shape. By f d = 0, the theoretical value is R = 1.18, when the droplet keeps sphere shape. Obviously, the numerical result is in agreement with theoretical result.
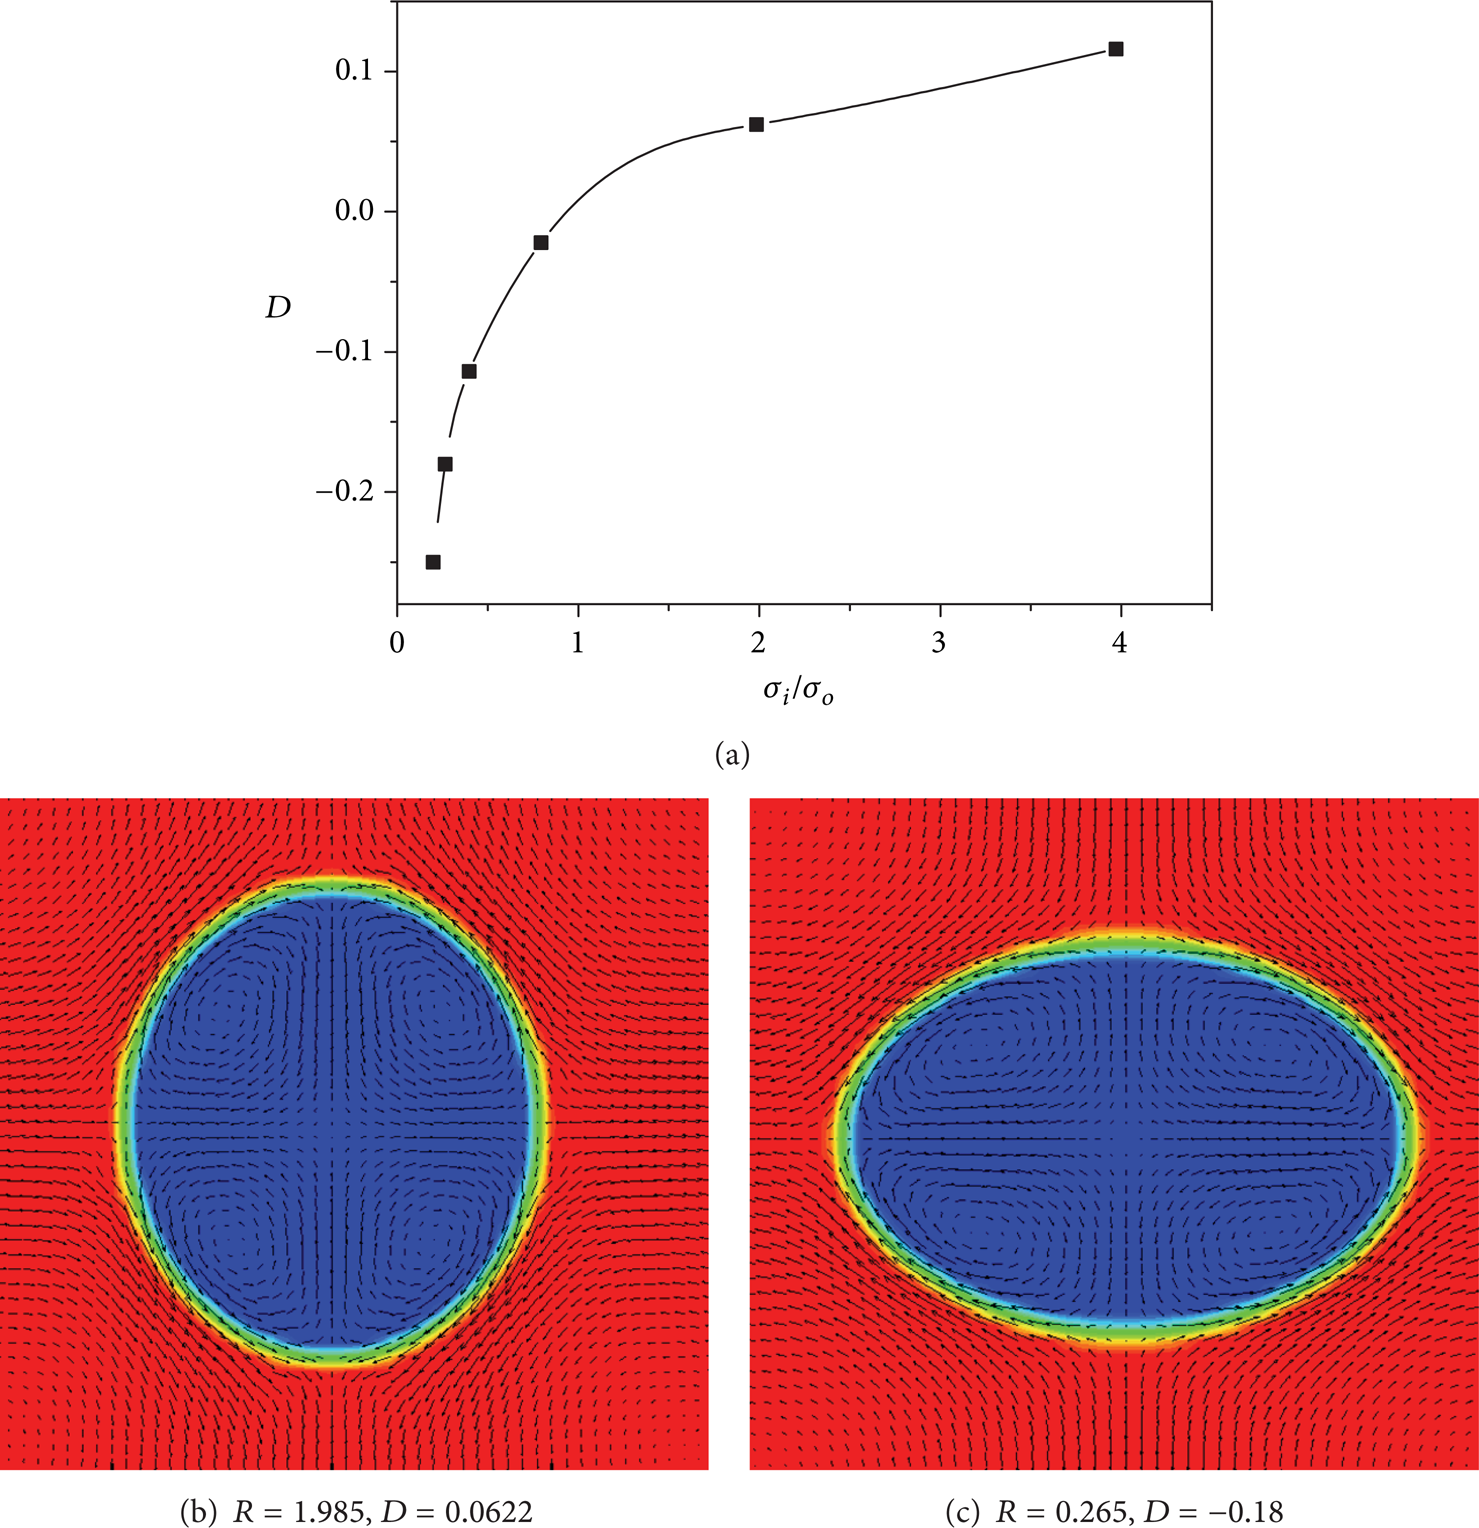
The effect of conductivity radio on droplet deformation. (a) Deformation rates at various conductivity radios, (b) prolate ellipsoid at R = 1.985, (c) oblate ellipsoid at R = 0.265.
When the droplet and surrounding dielectric viscous fluid are exposed to electric field, they are polarized and the charges accumulate on the interface and the distribution of the charges is inhomogeneous which depends on the electric strength, direction of electric field, and the relative magnitude of R and S. Reddy and Esmaeeli conducted the expression of surface charge density [15]
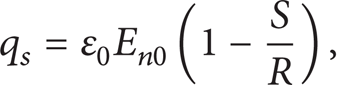
where En0 is the electric field strength of normal to the interface, ε0 = 8.854 × 10⁻¹² F/m.
Accordingly, the change of conductivity results in the variety of charges distribution due to the expression. Figure 9 shows the charges distributions for R = 1.985 and R = 0.265. When R = 1.985, the negative charges accumulate on the upper interface and direction of the electric field is from the upper polar plate to the bottom end. The charges would reach maximum at the droplet upper and bottom ends, respectively. The direction of electric field force is from equator to poles at the interface, which makes the droplet generate continuous deformation of prolate shape. When R = 0.265, the opposite situation took place and the electric field force direction is from two poles to equator, which leads to the droplet deformation of oblate shape.

Charge distributions at the interface at R = 1.985 (a) and at R = 0.265 (b).
In order to show the effect of permittivity on deformation, the two different liquid permittivity ratios are selected to be compared with each other. The deformation rates under different permittivity ratios are illustrated in Figure 10. The critical value of droplet nondeformation is S = 2.3 which is in agreement with theoretical value (S = 2.35) according to f d = 0. When S>2.3, the droplet presents oblate shape and when S<2.3, the droplet presents prolate shape. In the same way, the variety of permittivity causes the different charges distribution which were shown in Figure 11. When S = 0.3 and S = 0.011, the opposite charge distributions lead to opposite direction of electric field force, which drives the droplet to present different deformation direction.

The effect of permittivity radio on droplet deformation. (a) Deformation rates at various permittivity radios, (b) oblate ellipsoid at S = 0.3, (c) prolate ellipsoid at S = 0.011.
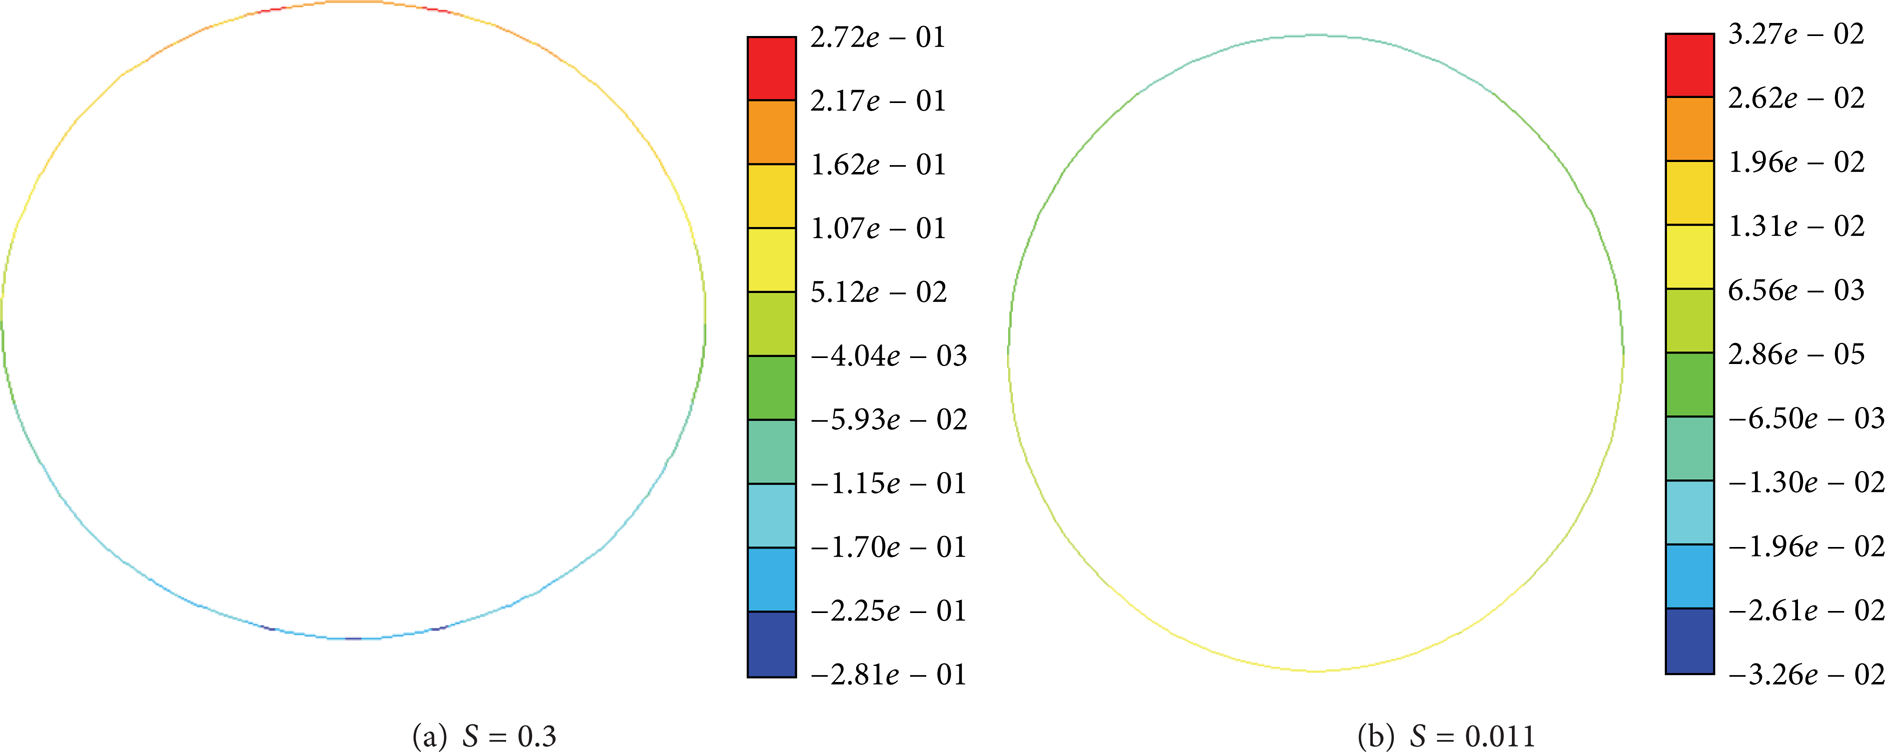
Charge distribution at S = 0.3 (a) and S = 0.011 (b).
4. Conclusions
A model which could describe the droplet deformation and interior flow inside the droplet suspended in another immiscible viscous liquid under influence of external electric field is developed to predict the droplet deformation rate and interior circulation flow using VOF method and leaky dielectric model. The droplet deformation rate and interior circulation flow inner droplet are numerically simulated under different operating conditions. The droplet deformation rate gradually increases with the increasing of the electric field strength. The direction of deformation and interior circulation flow is concerned with the liquid properties. The deformation direction is linked to fd, and the direction of circulation flow inner droplet is linked to R/S. When f d <0, the droplet deforms into oblate shape and when f d >0, the droplet deforms into prolate shape. When R/S<1 the interior circulation direction is from the poles to the equator, while when R/S>1 the interior circulation direction is from the equator to the poles. The results of droplet deformation rate obtained by VOF method are compared with Taylor's analytical data and experimental results by Torza. When the droplet deformation rate is very small, the numerical results are consistent with analytical and experimental results. When the droplet deformation rate is large, the calculated results are consistent with experimental results, while there are discrepancies to Taylor's analytical data. In prediction of interior circulation flow, the results obtained by VOF method coupled with leaky dielectric model are in accordance with the results obtained by Level Set method and the front tracking method (Front Tracking Method). Additionally, the droplet viscosity dominates deformation velocity. The higher viscosity droplet obtains lower interface velocity, which leads to droplet to need more time to attain steady state. At last, the effect of conductivity ratio and permittivity ratio on droplet deformation is presented. When fluid electric properties are changed, the charge distribution at the interface is various, which leads to the droplet taking on different deformation shapes.
Footnotes
Nomenclature
Conflict of Interests
The authors declare that there is no conflict of interests regarding the publication of this paper.
Acknowledgments
This work is supported by National Natural Science Foundation of China (no. 51106064) and Jiangsu University Cultivation Project for Young Excellent Teachers.