
Abstract
In order to improve the quality of applications, such as recommendation or retrieval in knowledge-based service system, it is very helpful to uncover research topics of academic communities in scientific collaboration network (SCN). Previous research mainly focuses on network characteristics measurement and community evolution, but it remains largely understudied on how to uncover research topics of each community. This paper proposes a nonjoint approach, consisting of three simple steps: (1) to detect overlapping academic communities in SCN with the clique percolation method, (2) to discover underlying topics and research interests of each researcher with author-topic (AT) model, and (3) to label research topics of each community with top N most frequent collaborative topics between members belonging to the community. Extensive experimental results on NIPS (neural information processing systems) dataset show that our simple procedure is feasible and efficient.
1. Introduction
Social network (SN) analysis is regarded as a powerful tool to find out social links and network structure of actors [1–9]. Scientific collaboration network (SCN) is a kind of complex SNs of researchers, in which a link between two researchers is established if they coauthored one or more scientific papers [10, 11]. Therefore, it is also called as coauthorship network [10, 12]. Previous studies on SCN [6, 9, 11–16] can be roughly separated into two stages: (1) the first stage mainly focused on how to construct network and how to measure network characteristics with some metrics [10, 14, 17], such as degree distribution, clustering coefficient, and average path length; (2) the second stage paid more attention to network structure analysis, community evolution, and so on [1, 2, 8, 13, 18, 19].
As we all know, most real-world networks contain groups in which nodes are more highly connected to each other than those to the rest of the network [13]. The sets of such nodes are usually called communities, clusters, cohesive groups, or modules [13, 20]. Similar to the real-world networks, SNs also include many communities based on common location, interests, and occupation. As one kind of SNs, it should be no exception for SCN [2, 7, 13, 19, 20]. According to whether or not a node is allowed to be a member of more than one community, the communities can be further divided into two types: overlapping and nonoverlapping. Most real-world networks are characterized by well-defined statistics of overlapping and nested communities [13].
Although real motivations for a link in the SCN are still not well understood at present, there usually exists one or more than one relationship (such as co-colleagues, advisor-advisee, classmates, coproject, friends, or many others) in the real world if two researchers coauthored some papers. Moreover, in order to follow the frontier research or borrow main ideas from other fields [18], an active researcher might involve multiple fields. Intuitively, it is unreasonable to limit one researcher to belong to only one community. Therefore, it convinces us of the fact that overlapping communities also exist in the SCN.
It is increasingly important to detect communities in SN in modern applications, ranging from bioinformatics, enterprise organization management, to bibliometrics [21]. Many approaches have been proposed to detect communities in the SN [22, 23], such as traditional methods based on clustering like k-means and other applications, division algorithms based on hierarchical clustering, modularity-based algorithms, spectral algorithms, dynamic algorithms, statistical inference-based methods, multiresolution methods, and lastly methods to find overlapping communities and other miscellaneous methods [23]. But most existing methods for finding communities just discover the separated sets in networks and ignore the overlapping phenomenon [13, 23].
In fact, it is the first step to identify network structure if one wants to provide a valuable insight into how network function and topology affect each other. In a knowledge-based service system, users may be interested in not only the link structure in a network but also in the reason why they form a community. However, most present methods merely focus on detecting the structures or monitoring evolution of communities. There are few literatures on uncovering research topics of academic communities and providing particular information for searching a group of researchers with similar interests. To the best of our knowledge, only Ichise et al. [18] put forward a method to detect academic communities with topic identification in literature. On closer examination, one can see that the word assignment technique was utilized for obtaining the communities. Unfortunately, the method has the limitation of trust in the keywords.
To overcome these problems, the paper proposes a nonjoint approach, which integrates community detection method and author-topic (AT) model. Specifically, it consists of three simple steps: (1) to detect overlapping academic communities in SCN with the clique percolation method, (2) to discover underlying topics and research interests of each researcher with author-topic (AT) model, and (3) to label research topics of each community with top N most frequent collaborative topics between members belonging to the community, where common topics between researchers are seen as collaborative topics.
The remainder of the paper is organized as follows. Section 2 provides related works on community detection models and topic models. Section 3 illustrates the analysis framework in the study and then introduces each unit of the framework. Section 4 describes and discusses experimental results. Finally, the conclusion is made.
2. Related Works
2.1. Community Detection Methods
Community detection is the organization of nodes in a network into subsets of nodes such that nodes within a subset are more densely connected internally than those within the other subsets. Another way to say this from a graph theoretic perspective is that, given a graph
Because the number of communities underlying a network is typically unknown in advance and the sizes or densities of communities are often uneven, it is not trivial to find automatically community structure. Several community detection approaches have been developed and employed with varying levels of success [25], including hierarchical clustering algorithm, Girvan-Newman algorithm [26], modularity maximization algorithm [27], and clique-based methods [13]. It is worth noting that only the last one can deal with the overlapping phenomenon.
Hierarchical clustering is a simple algorithm which employs some type of similarity metrics between node pairs to group similar nodes into communities. Girvan-Newman algorithm identifies edges that lie between communities and then removes them, just leaving behind the communities themselves. Though Girvan-Newman is popular in a number of standard software packages, its time complexity is
Clique-based methods build up the communities from the cliques in a network [28]. By clique, we mean the complete subgraphs in a network that are not parts of larger complete subgraphs. Specifically, the general procedure of the methods is to find cliques firstly and then to unite the cliques bigger than a minimum number of nodes to define a subgraph of original network, and finally components (disconnected parts) of the defined subgraph are used to define communities [22, 23]. The alternative of the method is to use k-cliques, which are complete subgraphs with k nodes, to construct line graph known as clique graph [20, 28]. In fact, clique graph is a hypergraph of original graph, the nodes of which are k-cliques, and the edges of which record the overlap of the cliques in the original graph. The difference between k-cliques and cliques is that k-cliques can become subsets of larger complete subgraphs. A typical approach based on k-cliques is the clique percolation method (CPM) [13, 29], which defines communities as percolation clusters of k-cliques. CPM algorithm runs in the time
2.2. Topic Models
Topic models are a family of statistical models for discovering a mixture of “components” in a collection of documents [31]. In these models, each topic is modeled as a probability distribution over words in the vocabulary of corpus and each document in corpus is modeled as a mixture of topics given by a multinomial distribution over the topics [32]. An early topic model called probabilistic latent semantic indexing (pLSI) was proposed by Hofmann [33]. While Hofmann's work is a useful step toward probabilistic modeling of text, it is incomplete in the fact that it provides no probabilistic model at the level of documents. In order to overcome this problem, Blei and his coworkers developed latent Dirichlet allocation (LDA) model [34]. LDA is similar to pLSI, except that in LDA model the topic distribution is assumed to have a Dirichlet prior. In practice, the assumption usually brings about more reasonable mixtures of topics in a document. Subsequent topic models, such as author-topic (AT) model [35], topic over time (ToT) model [36], author-topic over time (AToT) model [31, 32, 37], and conference-author-relation topic (CART) model [38], are generally extensions on LDA.
As a famous topic model, LDA [34] is a generative probabilistic model for collections of discrete data such as text corpora [39]. LDA model is based upon the idea that the probability distribution over words in a document can be expressed as a mixture of topics. It means that each document may be viewed as a mixture of various topics. LDA model can be viewed as a generative process. A document can be generated in following three steps: (1) to sample a mixture proportion from a Dirichlet distribution, (2) to sample a topic index according to the mixture proportion for each word in the document, and (3) to sample a word token from a multinomial distribution over words specific to the sampled topic.
AT is also a generative model that extends LDA model to include authorship information [40, 41]. The model provides a relatively simple probabilistic model for exploring the relationships between authors, documents, topics, and words. In the model, each author is represented by a multinomial distribution over topics and each topic is represented by a multinomial distribution over words. The words in a document coauthored by multiauthors are assumed to be the result of a mixture of topic mixture of each author. Then, the topic-word and author-topic distributions are learned from text corpus. Compared with LDA, AT can give the increase of salient topics and more reasonable researchers interest patterns [40]. AT model has been proved to be an essential way to uncover the research interests of each researcher [40, 41].
3. Method
The analysis framework of proposed approach is illustrated in Figure 1. The framework is composed of four parts: to preprocess data, to detect communities in scientific collaboration network, to discover collaborative topics between authors, and to uncover topics of academic communities. We describe each part in detail in the following subsections.

Framework of the method.
3.1. To Preprocess Data
In this part, words and authors are extracted from papers collected. First word terms are extracted to build vocabulary and all stop-words are eliminated. Then word frequency and inverse document frequency of each word in vocabulary are computed for following author-topic model. Next, author names are extracted and the name disambiguation algorithm is used to process ambiguous names, such as an author with multiple names or multiple authors with the same name, and then all author names are normalized to a standard name and assigned a unique ID number.
3.2. To Detect Communities in SCN
From a “topological” point of view, network can be divided into four categories: undirected binary network, directed binary network, weighted directed network, and weighted undirected network [10, 14]. In the part, a SCN is first created by following the principle of undirected binary network, in which each node represents an author and each edge represents the coauthorship between two linked authors. Specifically, if two authors coauthored one paper at least, an edge with unit weight will be created. In other words, no matter how many papers two authors coauthored, there is only one edge between them. For example, if
Then, cliques are extracted from constructed SCN and communities are detected with k
-clique-community detection algorithm [13]. The community definition in the algorithm is based on the observation that a typical node in a community is linked to many other nodes, yet not necessarily to all other nodes. A k
-clique-community is the union of all k-cliques that can be reached from each other through a series of adjacent k-cliques, where adjacency means sharing
3.3. To Discover Collaborative Topics between Authors
Here, AT model is used to uncover the research interest of each author. The graphical model representation for AT model is shown in Figure 2. The following notations are used in this study. Let P and W be the set of papers and unique words in the corpus, respectively. For each
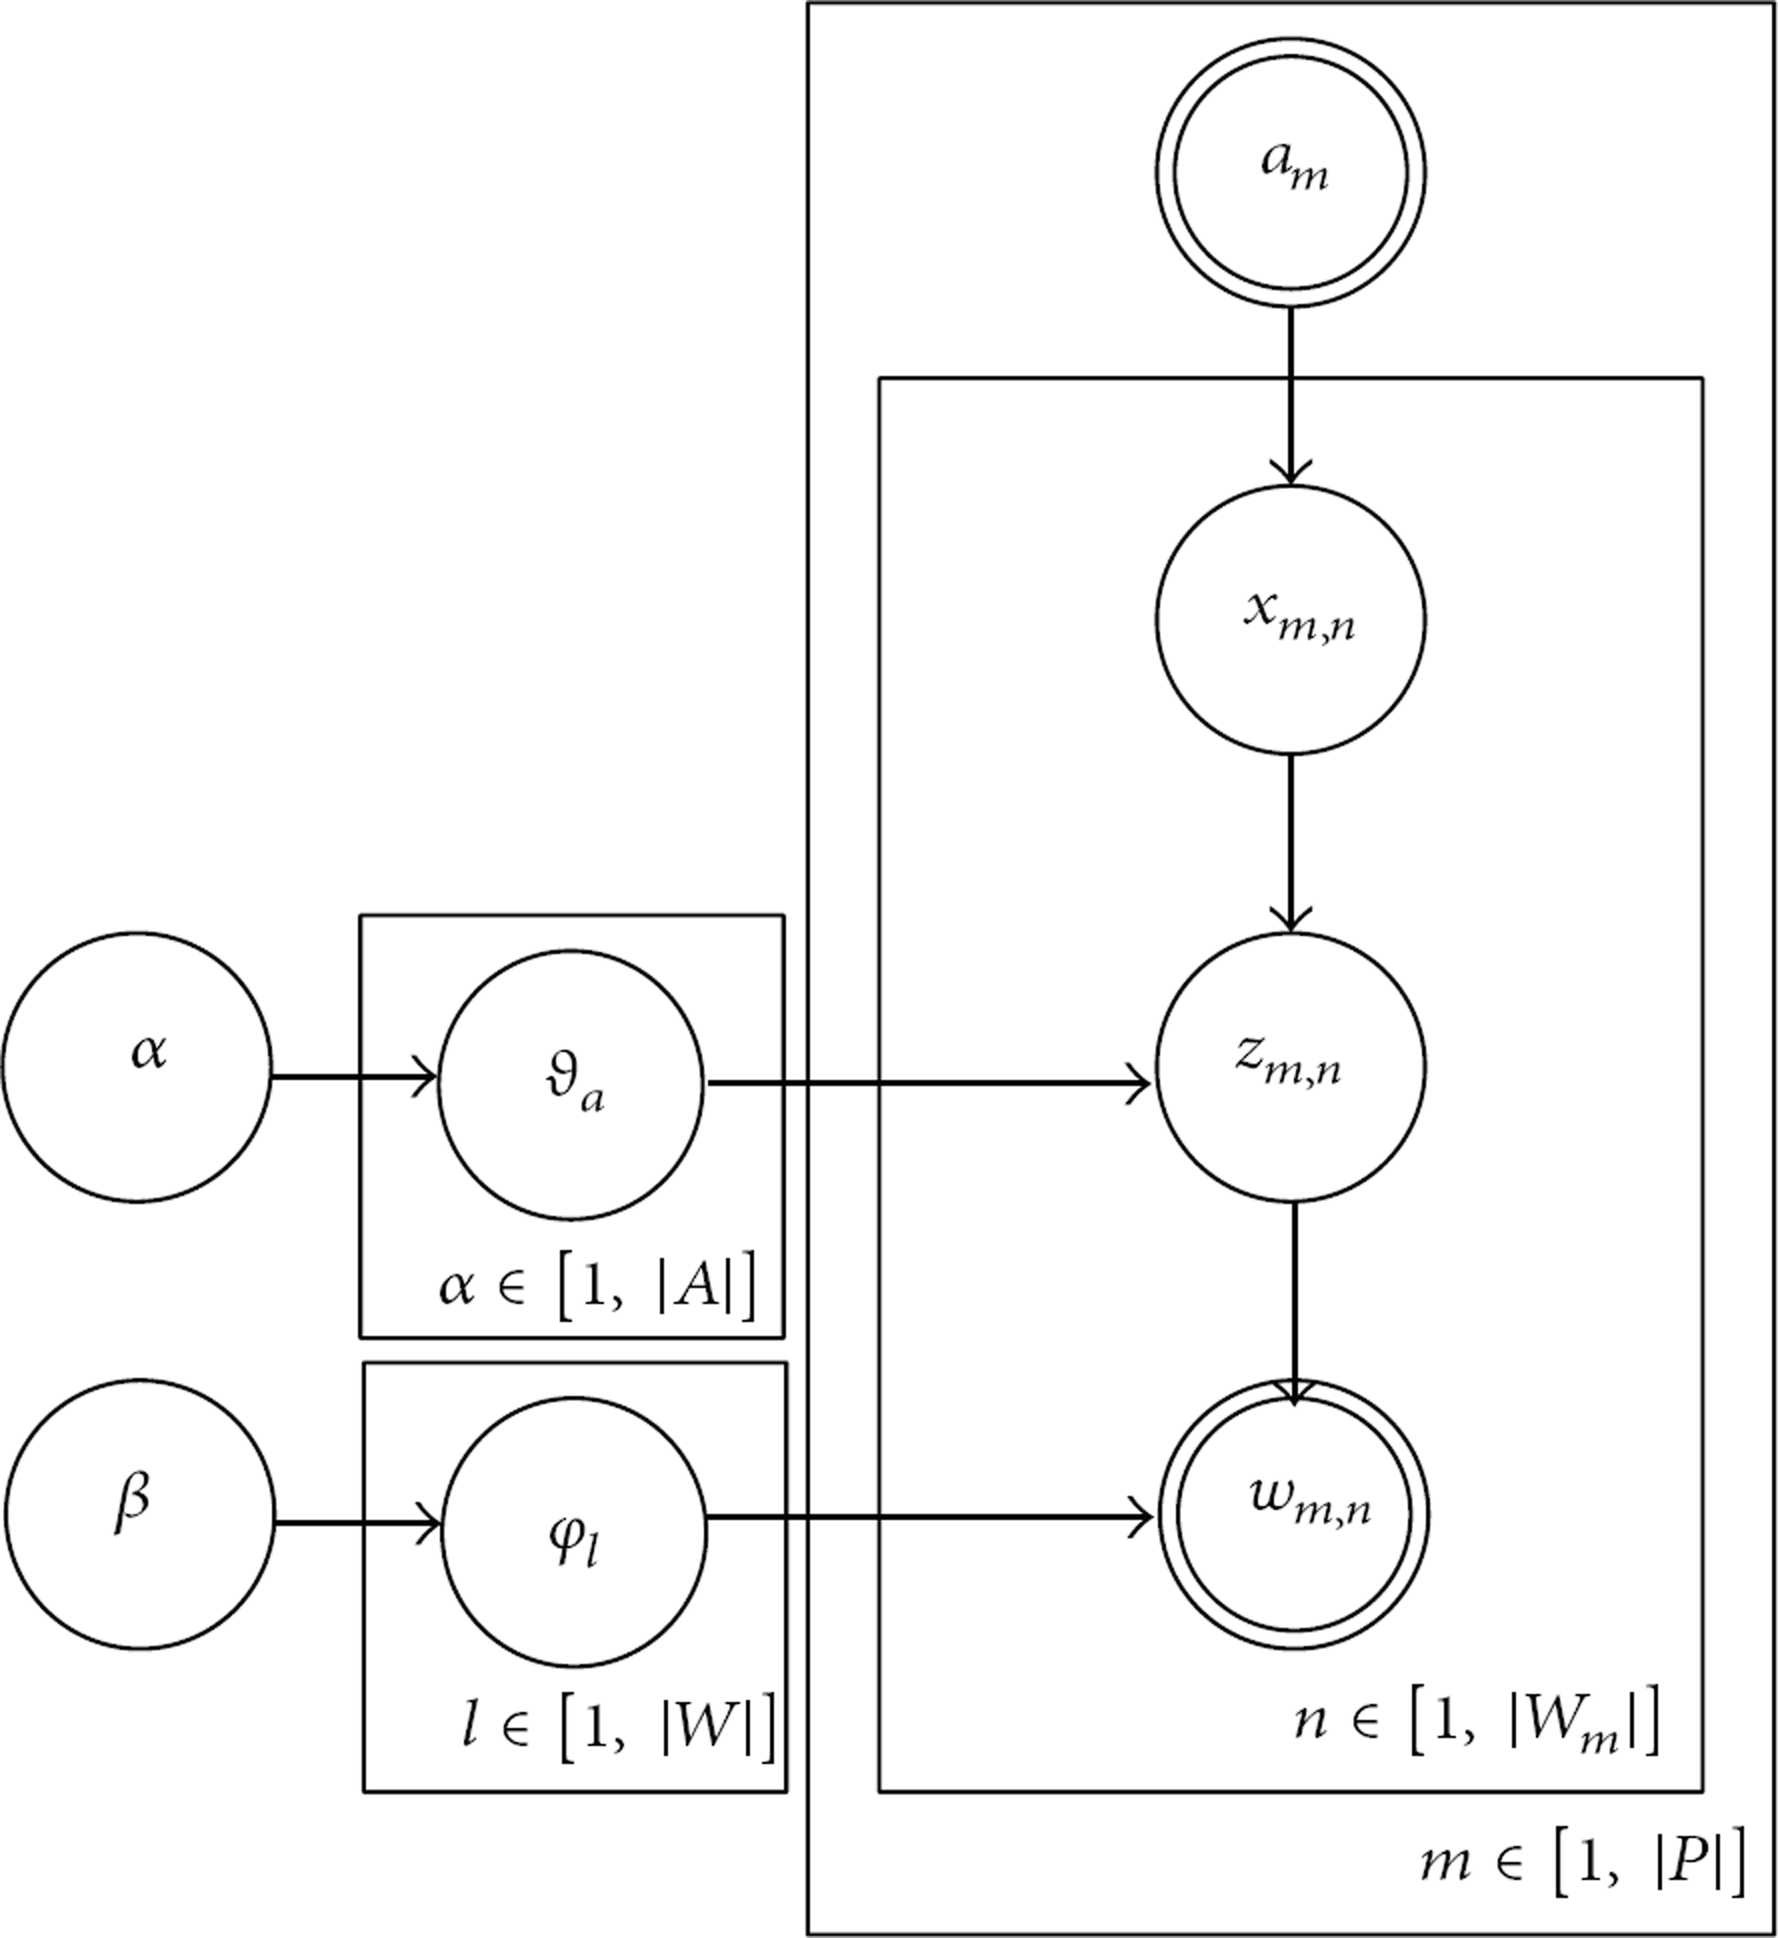
The graphical model representation of the author-topic model.
In this work, collapsed Gibbs sampling algorithm, which runs over the three periods, initialization, burn-in, and sampling with L iterations in total, is used for inference on

In our paper, each topic is represented with the top 10 words most likely to be generated conditioned on the topic, and research interest of each author is represented with the top 10 most likely topics. From the results of AT model, we can build the relation matrix between authors and topics. Each element of the matrix is the association probability between an author and a topic. With the matrix, it is easy to get collaborative topics between any two authors with coauthorship. Formally, for each
3.4. To Uncover Topics of Academic Communities
In Section 3.2, we have detected communities in SCN. In Section 3.3, we have got topics of authors and we have also obtained the collaborative topics between any two collaborated authors in detected communities. Here, we will integrate both results to uncover the topics of academic communities by ranking topics and selecting the most frequently collaborated ones.
For a SCN,
In Section 3.3, we have obtained collaborative topics for each edge in

Once we have got collaborative frequencies of all topics in community
To illustrate the process clearly, let us take a simple example in Figure 3 with a community consisting of four nodes. Given author topics as follows:

An example of community.
Using (2), we can easily get the frequencies of all topics:
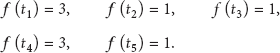
Finally, if we rank the frequencies and select top 2 topics as research topics of the community, the result is
4. Experimental Results and Discussion
4.1. Data
NIPS proceeding dataset is utilized to evaluate the performance of proposed framework, which consists of the full text of the 13 years of proceedings from 1987 to 1999 Neural Information Processing Systems (NIPS) Conferences (http://www.cs.toronto.edu/~roweis/data.html). The dataset contains 1,740 research papers and 2,037 unique authors. Because all the author names have been processed and normalized, we need not run name disambiguation algorithm in the step of preprocessing data. Based on coauthorship, we count the collaborative numbers between coauthored researchers. The distribution of the numbers of author pairs over collaborative numbers is shown in Table 1. It shows that the maximum collaborative number between authors is 9 corresponding to author pair (Smola_A ID: 1475 and Scholkopf_B ID: 1504).
Distribution of the number of author pairs over collaborative numbers in NIPS dataset.

In addition to downcasing and removing stop-words and numbers, we also remove the words appearing less than five times in the corpus. After the preprocessing, the dataset contains 13,649 unique words and 2,301,375 word tokens in total. In our experiments of AT model, the number of topics is fixed at 100, the symmetric Dirichlet priors α and β are set at 0.5 and 0.1, and Gibbs sampling is run for
4.2. Scientific Collaboration Network
Based on coauthorship, we construct the scientific collaboration network containing 1897 nodes and 3130 edges. That is to say, there are 140 authors who did not collaborate with any other authors. The constructed network graph is shown in Figure 4. From Figure 4, we find that the NIPS network is composed of a larger subgraph (in the center of the picture) and many smaller subgraphs.
NIPS scientific collaboration network.
4.3. Component Analysis
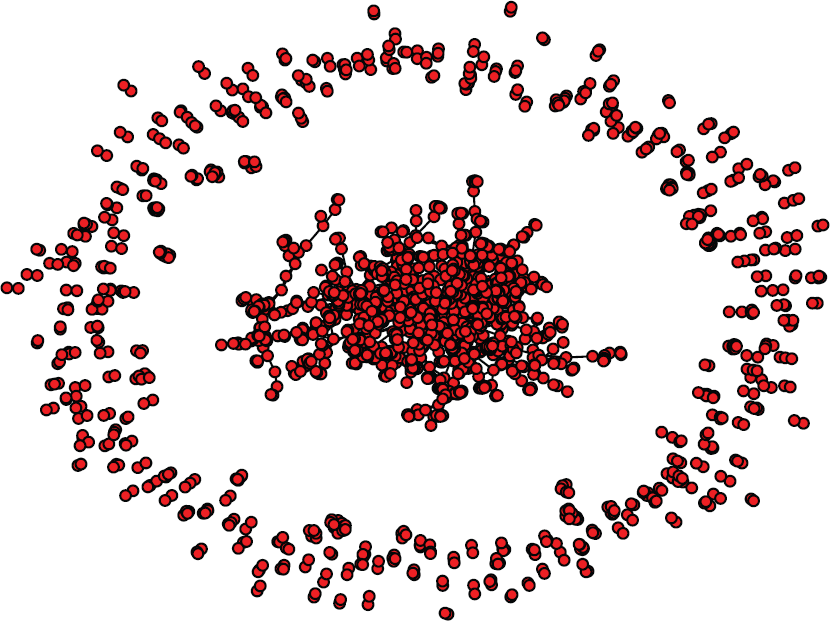
Using component analysis approach [42] on the network, we found 235 components totally. That is to say, the network contains 235 separated subgraphs. The number of author nodes in the top 10 components is 1061, 37, 27, 22, 19, 15, 11, 10, 10, and 9, respectively. We select the largest one (1061 authors) as analysis object in the following experiments. Figure 5 shows the graph of the largest component.

The largest subgraph of NIPS network.
4.4. Cliques
The k -clique-community detection algorithm in NetworkX tools [42] is used to discover all cliques in the network. The size and number of cliques in the network and the largest component are shown in Table 2. The size of the largest clique in the network is 10, which means that it contains 10 authors, while the size of largest clique in the largest component is 9.
Sizes and numbers of cliques.

4.5. Community Analysis
The detected communities depend on the value of parameter k, where k refers to the size of cliques. Typically, the value of k is between 3 and 6 [13]. Increasing k makes the communities smaller and more disintegrated, but, at the same time, also more cohesive [13]. Different value of k will give rather different results and thus give us flexibility when providing research community service for users in knowledge-based system.
The cliques found in Section 4.4 are used to detect communities. Communities detected under different k value are presented as follows.
(a)
(b)
(c)
Detected communities (

CNo is the abbreviation of community number.
(d)
Detected communities (

CNo is the abbreviation of community number.
The subgraphs of the 6 communities

Subgraph of discovered communities
4.6. Topics and Collaborative Topics between Authors
By running AT model on NIPS dataset, we obtain 100 topics and assign each topic an ID number range from 0 to 99. In Table 5, we list some typical topics and top 10 hot words for each topic with corresponding probabilities. Among them, there are some representative domains in NIPS in the listed topics, including support vector machine (SVM) and kernel methods, neural network, speech recognition, image and vision, EM and mixture model, and independent component analysis (ICA).
Some typical research topics in NIPS.

Author topics of overlapping nodes (

AID is the abbreviation of author ID.
After running AT model on NIPS dataset, we also obtain research topics of each author. We select the 10 most likely topics as research topics for each author, and each topic has a probability value indicating the possibility that the author is related to the topic. Table 6 shows research topics of the authors corresponding to the overlapping nodes in communities under the condition
From the results of authors’ research topics, we can easily obtain the collaborative topics between two collaborated authors by finding their common topics. In the results of AT model, we got the probabilities between authors and topics. If two authors collaborated a topic, we use the smaller value of probabilities to express the possibility of the topic they are related to. For example, Vapnik_V (726) and Smola_A collaborated in topic 77, and the probability values they are related to the topic are 0.26370 and 0.33208, respectively, so the probability they collaborated in the topic is 0.26370. In Table 3, we have listed all authors in community 2
Collaborative topics between authors 726, 1475, and 1504.

4.7. Community Topics
In this subsection, we will integrate the results from Sections 4.5 and 4.6 to uncover the research topics of communities. Our main idea is to find out the most frequent and possible collaborative topics in each community.
To be specific, for each community, we count all collaborated topics in all edges of the subgraph using (1) and then rank them by sorting both collaborative frequencies and probabilities descendingly. We use the minimal collaborative probabilities as probabilities for each topic in the counting process. We show the result of community 1 (
Collaborative topics of community 1 in Table 4.

TID is the abbreviation of topic ID. Freq. is the abbreviation of frequency.
With ranked collaborative topics of communities, we can select the most outstanding topics or select top N topics as research topics for each community. In this paper, we use top N topics to represent the research interests for all detected communities. Here, we set
Community topics (

CNo is the abbreviation of community number. TID is the abbreviation of topic ID. Freq. is the abbreviation of frequency.
According to the results, we can speculate the research interests for each community. It seems that the main interest of community 1 is related to “pattern recognition” and “outlier detection,” community 2 “speech recognition,” community 3 “SVM & kernel method,” community 4 “EM & mixture model” and “neural network and Boltzmann machine,” community 5 “independent component analysis” and EEC, and community 6 “image and vision” and “independent component analysis.”
In order to investigate the effectiveness of proposed method, we check all the papers collaborated by authors in each detected community in Table 4. We found that the uncovered topics for most communities are closely related to topics of the papers written by the community authors. For example, there are 16 papers collaborated by authors in community 3
Finally, we examine the function of the overlapping nodes. In our experiments, when
5. Conclusion
In this work, a method of uncovering research topics of communities in scientific collaboration network is proposed. The method integrates community detection model using k -clique-community algorithm and the author-topic model. The approach of k-clique-community algorithm is to detect overlapping communities in scientific collaboration network, while the approach of AT model is to discover topics and authors’ topics. We use common topics of coauthored researchers as their collaborative topics. Finally, we count all collaborative topics and select the most frequent collaborated topics among authors as research topics of communities. Experimental results on NIPS dataset show that our method is feasible and efficient.
In a knowledge-based system, it will be useful after obtaining the information of communities and their research topics. This information will help users position an interesting academic community quickly, and then they can be led to find interesting topics, researchers, and papers by using the topics and coauthorship of authors in the community. This information will also help us improve the application effect and user experience in academic recommendation system and provide researchers in a community with information they really need. Therefore, the more interesting problems related to the method are how to use it and its results in a knowledge-based system and how the parameter k in k -clique-community algorithm affects user selection in the practical application.
There are some challenge problems for future studies. One is to develop an algorithm to obtain collaborative topics between authors directly by extending AT model. Another one is to analyze topic evolution of communities and the functions of overlapping nodes in the evolution process.
Footnotes
Appendices
Conflict of Interests
The authors declare that there is no conflict of interests regarding the publication of this paper.
Acknowledgments
This work was supported by the Key Technologies Research on Data Mining from the Multiple Electric Vehicle Information Sources which is sponsored by Key Technologies R&D Program of Chinese 12th Five-Year Plan (2011–2015) under Grant no. 2013BAG06B01, and the Scientific Collaboration Network Analysis Based on Content and Linkage Data which is sponsored by ISTIC Preresearch Foundation under Grant no. YY201221, respectively.