
Abstract
This paper, aimed at the problems of high-speed train seat design standards that lack biomechanical analysis, analyzed the lumbar force of sitting position and verified the validity of the finite element model of human lumbar L1–L5 that had been built by reverse engineering technology. Based on the lumbar force distribution, the methods of exterior penalty and moving least square were adopted to establish a high-speed train seat equation that caters for physical ergonomics and a new high-speed train seat model was designed so as to improve the comfort for passengers.
1. Introduction
Seat which obviously is an essential facility of high-speed trains is directly related to the degree of comfort and affected people's choice of transportation when traveling [1]; the finite element models of human and seat cushion containing 16 bones assemblies are used in the seat comfort research. The requirements of modern passengers for train seats are not only to satisfy the beauty in appearance but also to take human factors into consideration such as comfortable sitting positions, convenient operating positions, and reasonable body pressure distribution [2]. In China, a certain demand of safety and soundness seats is made, while there is no obvious requirement for health on seats. Therefore, attention should be paid to the seat design. This design sets from the impact of sitting positions on lumbar force distribution and then makes the finite element simulation of human lumbar. In terms of the combination of lumbar pressure concentrates on the natural ecological principle, the method of exterior penalty is adopted to design the high-speed train seats and moving least square is used to design the curve and hook face of seats, to get equation of a surface which is conformed with ergonomics. A new high-speed train seat model is designed by CATIA so as to improve the comfort of the passengers.
2. Construction and Static Analysis of Finite Element Model of the Spine
Because of complex surfaces of the human lumbar spine, the traditional surface modeling has its faults: there is high work intensity and surfaces are oversimplified. It is unable to accurately express the real situation of the spine. For this reason, the reverse model is adopted to generate the lumbar finite element model.
In present work, CT scanner scanned the volunteer's lumbar vertebra. The result was reserved in DICOM form. The outline of lumbar vertebra was obtained by suitable threshold in software mimics (Figure 1). The primary model was imported to the software hypermesh and was trimmed. Finally, a complete model of human lumbar spine bone was accomplished (Figure 2).
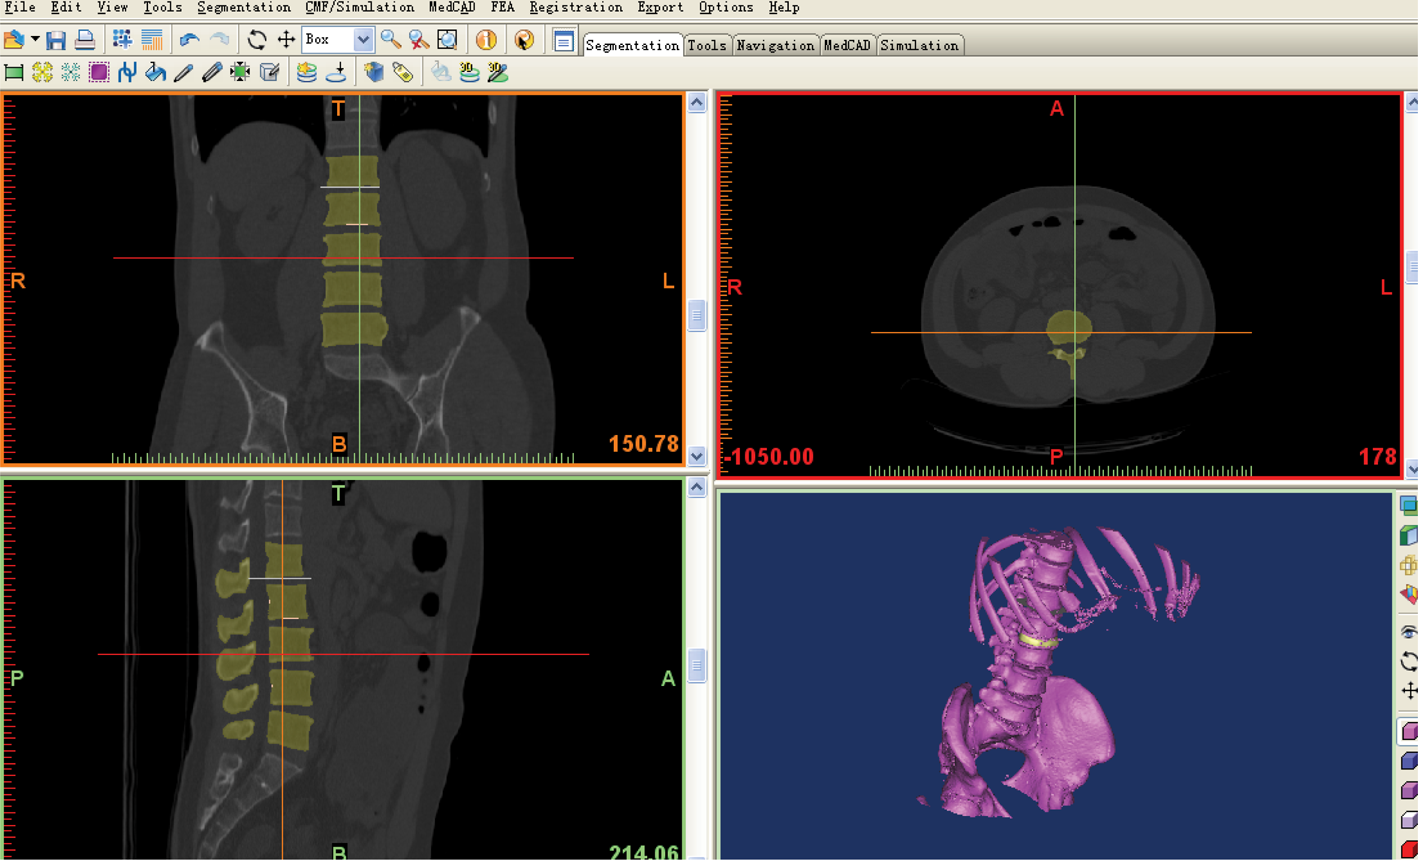
The outline of the human lumbar vertebrae in mimics.
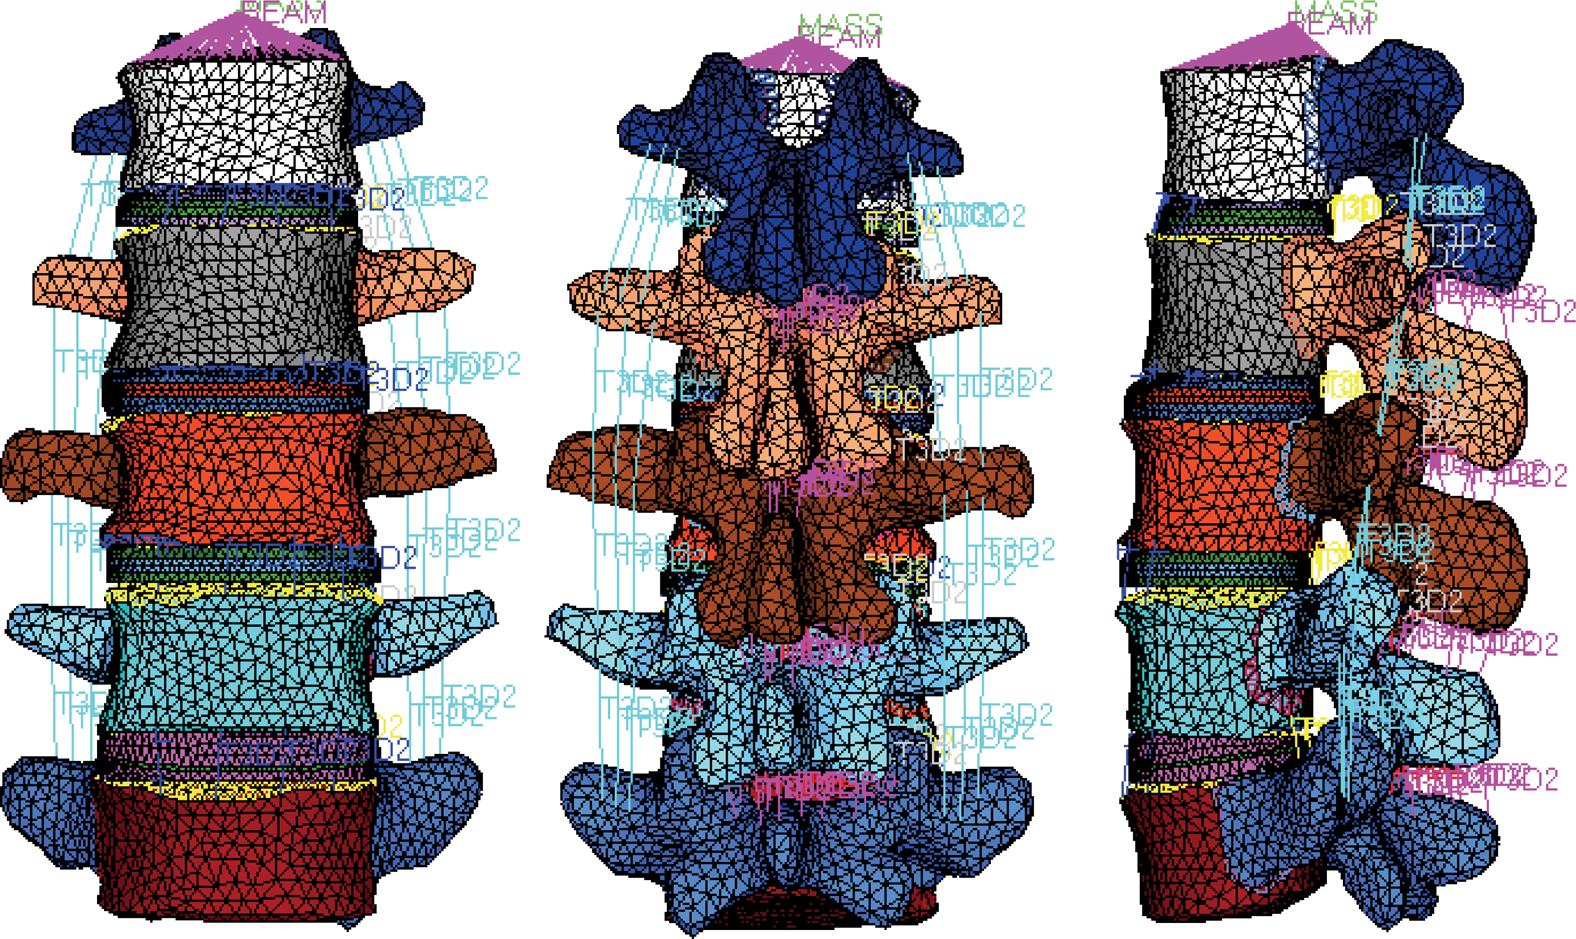
The model of human lumbar vertebrae in the hypermesh.
The model materials unit is shown in Table 1. Because the body surfaces of the lumbar vertebra L5 and the sacrum are connected, the boundary conditions on the inside surface of the lumbar vertebra L5 x, y, z direction displacement are constrained. And there is a contact between the vertebrae and the posterior vertebral disc, so the constraint between the parts uses the function of small sliding in abacus software to simulate the sliding friction and separation characteristics.
The element type and material parameters of lumbar vertebrae.

Through the software Abacus, the model was defined a quality block on lumbar vertebra L1 surface, and set the block to be 40 kg [3].
In order to analyze the observation results conveniently and make the force result of human lumbar spine clearly, the stress situations of the vertebra, lumbar intervertebral disc, and vertebral posterior structure were separated. The result provided the biomechanical basis for the high-speed train seats design.
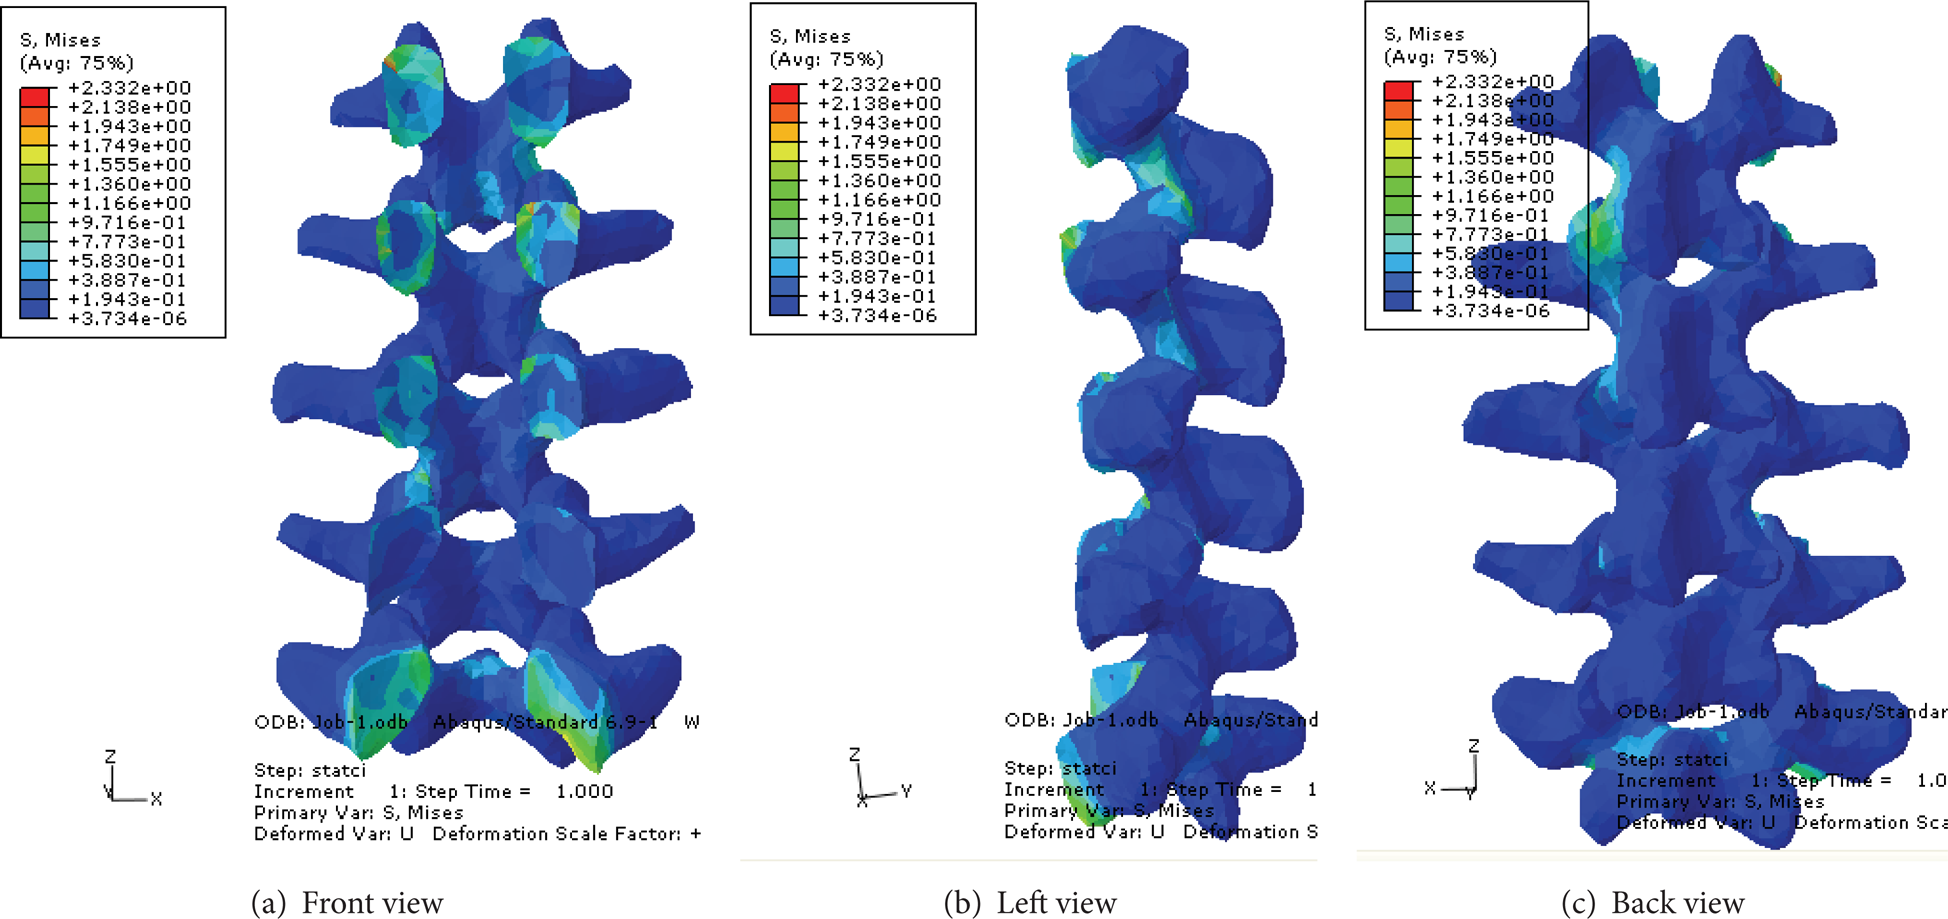
The observation results of the cloud in a sitting posture are as follows (Figures 4 and 5).
Observing the overall stress distribution situation, the fifth block vertebra appeared apparent concentrated stress, of which the maximum could reach 7.21 Mpa. The apparently vertebra stress was much higher than lumbar intervertebral disc and vertebral posterior structure.
On account of the close position of the force applied to the model of the L1 block of lumbar, the stress on L1 was max, but lumbar was actually wrapped by muscles in the human body, while most of the force could be endured in perspective of the local stress distribution, and the phenomenon of excessive stress in the L1 segment was understandable. If we ignored the effects of muscle problems, the maximum stress which appeared in the L5 block of vertebral body was 7.21 Mpa. The posterior structure stress of the maximum 3.032 MPa appeared in the L4 block. The lumbar intervertebral disc stress maximum value appeared in the L4-L5 segment.
The trend of stress was shown in Figure 6.
As seen from the chart, the vertebral stress appeared stress concentration on L5, and the stress of vertebral posterior structure remained in a stable condition. Meanwhile, lumbar intervertebral disc stress displayed the gradual downward trend. Vertebrate supported the main stress, lumbar intervertebral disc second and vertebral posterior structure least in contrast.
Taken as a whole, the place where supported the main stress concentration was the L5 vertebral body, followed by the L4 vertebral body. An ideal high-speed train seat design should be able to relieve and even eliminate the stress concentration at these two points to improve the ride comfort.
3. Validation of the Model
3.1. Experimental Validation
In the first step, a death spine specimen in a young adult which was placed in −18°C refrigerator 24 h before the experiment was prepared and thawed at room temperature for 10 h. The L1–L5 segments were selected, the lumbar muscle was cleared, and joint capsules and lumbar intervertebral discs and ligaments were reserved. Following that, the FlexiForce A201 thin film sensor was implanted into the L1–L5 vertebrae. The dealt lumbar sample was placed and fastened on the material testing machine, as shown in Figure 3. In order to simulate the lumbar force under the human body sitting posture, we applied a constant load to the lumbar 400 N that lasted for 10 seconds or more and meanwhile we measured the lumbar pressure.

The stress contour of L1∼L5 vertebral body at upright sitting posture.

The stress contour of L1∼L5 lumbar intervertebral disc at upright sitting posture.
The stress contour of L1∼L5 posterior structure at upright sitting posture.
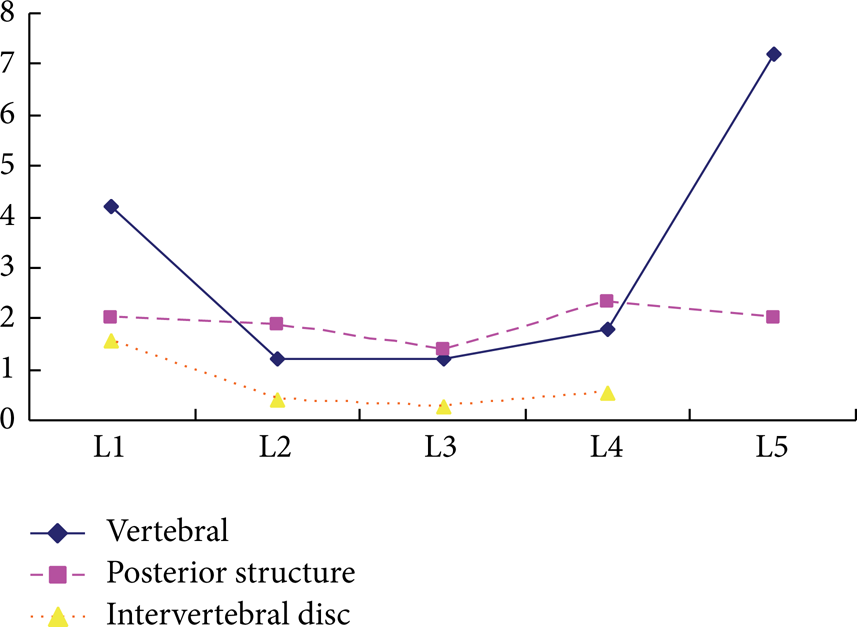
The stress trend of the separated lumbar vertebrae.
Comparing the experimental results with the finite analysis of lumbar spine and Berkson et al. [4], we got a lumbar stress distribution in upright sitting position by the experiment, as shown in Table 2.
Results contrast between the model in simulation and the experiment.

From Table 2, the lumbar pressure distribution was consistent with Berkson's experimental results. What was more was that it exhibited the maximum value of the stress in vertebral body, followed by the rear of the structure. The pressure change of the lumbar dice was the smallest. The maximum stress of lumbar intervertebral disc and vertebral posterior structure in finite element simulations was 1.073 Mpa and 3.032 Mpa. The similar results between the experiment and the simulation proved the validity of the model.
3.2. Theoretical Validation
Lumbar first-order natural frequency can be calculated by theoretical formula.
The vibration of the structure can list the basic equations as follows:

The equation of free vibration without damping from the formula (1) is as follows:

Free vibration of the structure can be equated to a series superpositions of harmonic vibration and vibration mode. Therefore, the form of solution of type (2) can be assumed as follows:
In formula (3),
Formula (3) is brought into (1), eliminates the factor e jωt , and gets formula (4) as follows:

A solvability condition for formula (4) is


where K was the stiffness of lumbar, and the result which was operated by the system (Figure 3) was up to 600 KN/m. M, the mass of lumbar, was up to 1.02 kg.
Calculated by formula (7),
The modal analysis which was related to the finite element model of the lumbar spine was analyzed by modal software Abacus, and its first natural frequency was 4.0762 Hz as a result. This was very close to the theoretical result.
By analyzing the whole process above, the experimental and the theoretical results were basically identical to the modal theory simulation result which was obtained from the finite element mode. The validity of the model was demonstrated from both aspects.
4. The Seat Surface Design
4.1. Current Seat Surface Design and Its Defects
As shown in Figure 8, in CRH2 high-speed train, the seat part of waist almost does not support the human waist. The concentrated stress at the waist cannot be mitigated. If a travel takes a long time, this design will cause the passenger's muscle fatigue. The seat cushion is almost a plane; it does not meet the human body pressure distribution. Riding for a long time will affect the blood circulation [5–8], leading to ride hip fatigue. Furthermore, when the vehicle turns, this design will cause poor ride stability.
4.2. Seatback Design Ideas
Surface design of the seat back should be as close as possible to the back of the passenger's natural physiological surface. On one hand, it can ease L4∼L5 lumbar stress concentration, and, on the other hand, it can be used as a lumbar support, and it maintains the physiological curve of the lumbar spine and relieves muscle fatigue, improving human ride comfort.
Surface modeling is different from feature modeling. Feature modeling can be well-defined parameters. But surface modeling integrates a large number of points data. How to generate consistency between design requirements and beautiful surface is really a tricky thing. The seat back design is adopted by the design method: point→curve→surface.
4.3. The Control Point on Central Seatback Curve
A reasonable design can alleviate the waist tension. The more important part of the seat back design can be simplified into three-point support principles, namely, lumbar support, shoulder support, and headrest point support. Control point of the central curve of the seat is determined by the seat of feature points. Seat feature points included seat back lower end X, waist support point Y, shoulder support J, and headrest support S (Figure 9). Based on static analysis, the L5 lumbar vertebrae body had stress concentration. Through CT data could be queried, the height of L5 from the seat cushion was 230 mm. Considering people's sitting posture in the seat, cushion has certain subsidence. Therefore, we designed the first support point, lumbar support with the vertical height of 250 mm. Reference to the ergonomic body size, the second support points shoulder designed by 500 mm height, the third support point headrest by 700 mm height.
4.4. Seatback Curve Fitting and Optimization
The central control line curve of seat back was generated by thousands of feature control points. This simulation selected 50 central control points. In order to fit this smooth curve formed by 50 points, a cubic spline interpolation was used to fit the central curve of seat back, and the curve was optimized by outside the penalty function method.
Interpolation calculation of arbitrary point could be achieved by using MatLab software for the precise control of point. The fitting center equation is as follows:

Curve equation is as shown in Figure 10.
The optimization method of minimum curvature radius error is adopted, namely, to make the error of the radius of curvature whose curve was designed between lumbar support and shoulders support minimum. The coordinates for the lumbar spine and shoulder blades, which are located near the x direction of the curve, are 250 and 500. The radii of curvature of these two points are, respectively, 350 mm and 1000 mm. The following curve is optimized.
(1) The Establishment of the Optimization Model. For any point on the curve S(x) radius of curvature is

The objective function is constructed from R(250) and R(500). On the basis of a maximum degree to meet passenger's ride comfort, the radius of curvature error can be controlled at the minimum, which enables the establishment of optimization objective function. Consider

In the constant optimization of the interpolation process, the equation F(x) should approach the minimum.
(2) Constraint Conditions. In order to control the variation of the amplitude changes of the curve, constraints are added to upper and lower bounds of the variables. Consider

where xi is a function of the value of the node before interpolation and yi is a function of the value of the node after interpolation.
(3) Optimization of Data Points and Fitted Curve before and after. There is an optimization problem which is equal to constrained multidimensional optimization problem. Outer point penalty function method is adopted in the paper. The outer point penalty function method makes the radius of curvature of the point in the curve S(x) and gets the point that the human spine and shoulder blades in comfortable sitting position are very close. Fitting curve is shown in Figure 11. Consider

4.5. Fitting Surface Based on Moving Least Squares
The traditional surface fitting method as the least squares method generally obtains a system of linear equations by getting the error quadratic sum minimum [9]. The fitting surface can be achieved by solving linear equations. However, if the gross of discrete data is too large, surface shape is complex and there is a requirement for blocks dividing into fit and smooth, and difficulties frequently occur in the practical application.
The moving least square method (MLS) established a new method of surface fitting. This method can overcome the difficulties aforementioned all. Mobile least squares method was first used in surface generation by Lancaster and Salkauskas [10]. Later, the method is applied to the nongrid method by Belytschko et al. [11]. Comparing moving least squares method with the traditional method of least squares, there are two relatively large improvements.
The establishment of fitting functions is different. This method does not use the traditional polynomial fitting function or other functions. It is composed of coefficient vector a(x) and matrix function p(x). Here, a(x) is not constant; it is a function of the x.
The concept of compact support was introduced. This concept considers the value of point x of y where nears the region affected by a sub node. This subdomain called the affected area by point x. The node outside the area has no effect on the value of x. Define a weighting function w(x) on the affected area. If the weighting function is taken to be constant throughout the region, it can get the traditional method of least squares.
Moving least squares surface fitting equation is

including

where
The selections of the weighting function with a certain degree of arbitrariness can be the exponential function, cone function, trigonometric function, spline function, and so on. Although the choice is free, it still needs to meet certain principles. The common weighting function is the spline function,

4.6. Fitting the High-Speed Train Seatback Surface
The previously seat central control line obtained is extended to get the back surface of the seat by the standard. Seat backrest follows the model established by CATIA.
The seatback surface model which is established by the CATIA was meshed and was output in points cloud mode (Figure 16). The region

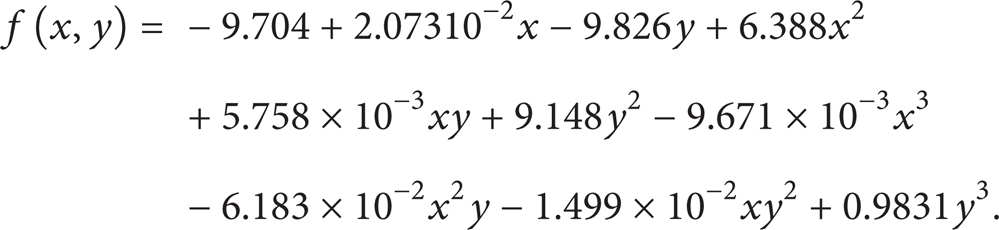
The point's data was substituted in moving least squares fitting function (14), and the fitting surface equation was

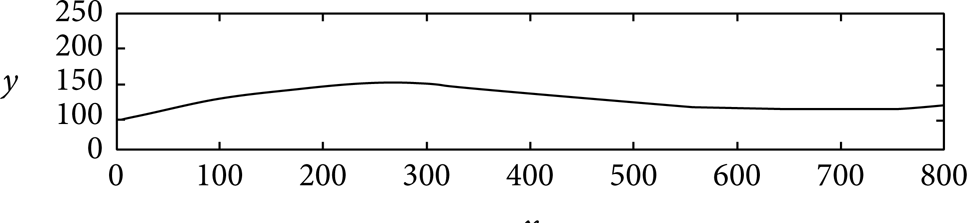
The simulation of fitting curved surface equation by MatLab is shown in Figure 13.
The seat surface of high-speed train was designed in form of a digital modeling of its surface in CATIA. The seat back surface which was optimized contrasted with the previous back surface. The result was as shown in Figures 12 and 14.
4.7. Fitting Surface of the Seat Cushion
In the state of human sitting posture, weight on the cushion pressure distribution is called the body pressure distribution. It is closely related to the sitting posture and the structure of the seat.
As can be seen from Figure 7, the existing high-speed train cushion is almost a flat surface; it is not beneficial to a reasonable human body pressure distribution. So according to the reasonable pressure distribution [12], a new seat surface is designed by software CATIA.

The test system of the lumbar pressure and stiffness.
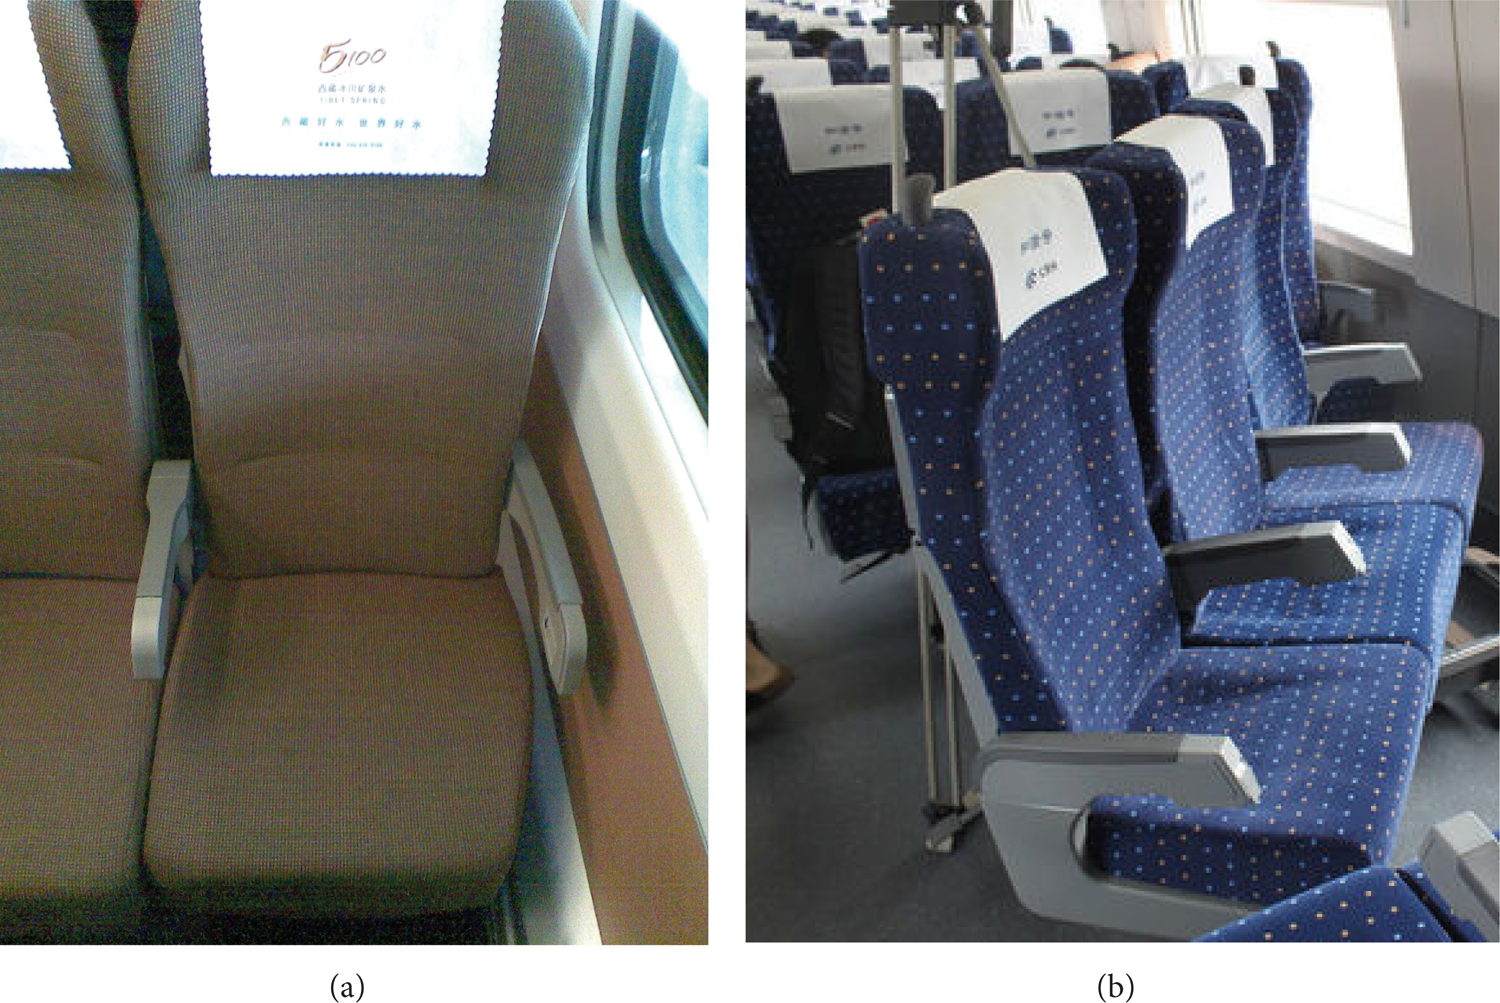
(a) High-speed railway (from Shenyang to Harbin) and (b) high-speed railway (which is from Shanghai to Beijing).

The control node of the center line of the seat.
The curve of the seat-back.

Curve after optimization.

Backrest three-dimensional model.

Surface fitting of seat back.

The contrast of the curved surface designed between the new shape and the past. (a) Surface before optimization, and (b) surface after optimization.
The seat cushion surface model which was established by the CATIA was meshed, and the point's data was output in points cloud mode. The region

The point's data was substituted in moving least squares fitting function (14), and the fitting surface equation was calculated as follows:
The simulation of fitting curved surface equation by MatLab is as shown in Figure 17.
The seat cushion equation was more accurate, more reasonable, and in line with reasonable state body pressure distribution, and it had a certain reference value (Figure 15).

The pressure distribution in the seat on the human body.

The new seat cushion model by Catia.

Surface fitting of seat cushions.
5. Three-Dimensional Model of the Train Seat
Train seat model can be composed of three basic parts: seat back, cushion, and seat underframe. According to the previous study on the seat back and cushion surfaces and combined with the practical experience, the model of seat back and seat cushion was established by CATIA software (Figure 18).

The contrast of the seat three-dimensional model and the seat of CRH2.
6. Conclusion
Based on the force analysis of lumbar, the shape surfaces of high-speed train seat are designed by theories of biomechanics and human body engineering.
In perspective of the biomechanical analysis, the human lumbar spine finite element model was established by hypermesh, and its force condition was simulated in Abacus software. Afterwards, according to the result of simulation, in order to ease the pressure on the lumbar, the shape and curvature of the spine were analyzed. The calculation result showed that the normal radius of curvature of the lumbar spine of women in a comfortable sitting down was approximately 251 mm, while that of the male was about 360 mm. By means of using external point penalty function method, a biomechanical central control line equation of high-speed train seat was established.
The train seat backrest and the seat cushion were designed according to the idea of model: data points→curve→surfaces→seat. Justified by the body size and body pressure distribution, the train seat model was established by modeling of the backrest and the seat cushion surface and application of CATIA. And then, on this basis, the CAD model of seatback and the seat surface was obtained by means of meshing which was output in digital point cloud model. Consequently, the curve surface equation was carried out on application of the least squares methods and surface fitting of seatback and cushion.
At the same time, simulating this equation by using MatLab provided a theatrical basis for the optimization of the seat surface shape and reverse engineering CAD modeling, promoted the body's lumbar support points closer to the curvature, promoted seat surfaces more in line with human physiological curve of the lumbar spine and more adequate support for the lumbar spine, and relieved stress concentration as well, thereby improving the riding comfort of the seat body.
Conflict of Interests
The authors declare that there is no conflict of interests regarding the publication of this paper.
Footnotes
Acknowledgments
This paper is supported by the National Science and Technology Support Program (2009BAG12A01-E05-1) and the Fundamental Research Funds for the Central Universities (N100603004).