
Abstract
The objective of this research is to evaluate the impact of pedestrian countdown signals on crossing behavior at intersections. Data were collected by means of questionnaire and video recording at two signalized intersections: one was with pedestrian countdown signal and the other was with traditional signal. The questionnaire aims to reveal pedestrians' preference to countdown signals. It shows that 91.8% of pedestrians believe that countdown signals are helpful in determining the time to enter crosswalk, and 72.6% of pedestrians think that countdown signals are more comfortable for crossing. To evaluate effects of countdown signals, four measures of effectiveness, that is, proportion of compliers, adventurers, violators, and trapped pedestrians, are applied. Hypothesis testing results show that countdown signals can significantly increase proportions of compliers and reduce proportions of violators and trapped pedestrians compared with traditional signals. However, countdown signals have weak impact on adventurers since many pedestrians do not understand the meaning of flashing signal.
1. Introduction
Pedestrians are a vulnerable road user group. In China, 16,281 pedestrians were killed in traffic accidents in 2010, accounting for 24.96% of the total road traffic fatalities [1]. In built-up area, the use of intersections by pedestrians, bicycles, and vehicles poses a potential conflict in the movement of these traffic users. Consequently, pedestrian signals become imperative to allocate the right-of-way for safe crossing of pedestrians at intersection. Normally, pedestrian signal phases consist of symbols displaying a steady person in green for “Walk,” a flashing person in green for “Don't Walk,” and a steady person in red for “Don't Walk.” A steady pedestrian symbol in green means that pedestrians can start crossing and have plenty of time to reach the other side before the signal changes. A flashing person in green means that pedestrians are not allowed to start crossing. If they have already started and are in the crosswalk, pedestrians may finish crossing. It is a warning to pedestrians who have not yet entered the intersection that it is too late to safely cross the street before the traffic signal changes. A steady pedestrian symbol in red means that pedestrians are not allowed to enter, walk, or stay in crosswalk.
In China, two types of pedestrian signals are widely used: one is traditional pedestrian signal displaying messages only with symbols and the other one is pedestrian countdown signal. Instead of traditional pedestrian signals, which only display symbols, pedestrian countdown signals display messages with symbols and a numerical sequence counting down the seconds remaining until the next phase appears. Compared with traditional pedestrian signals, countdown signals can provide extra information for pedestrians to make better decisions about when to cross and at what speed to cross, in order to complete crossing before the “Walk” signal expires.
Unlike young pedestrians, the older are much more cautious, especially when there are no countdown displays [2]. Previous researches have shown that older pedestrians cross the road more slowly [3–5]. With countdown signals, the older pedestrians can wait for proper time to cross street at slow speed. In the past several decades, many evaluation studies on the effectiveness of the countdown signals have been conducted. Kim et al. that found 62% of pedestrians surveyed claimed that they were comfortable with countdown signals, and 68% of pedestrians thought that countdown signals were helpful to decide whether to enter the crosswalk or not [6]. Lambrianidoua et al. indicated that the countdown signals were able to provide pedestrians with valuable information that enhanced the safety level as far as crossing of the intersection was concerned [7]. Pilot installations in San Francisco, USA, showed a 52% reduction in pedestrian injury collisions due to countdown signals [8]. Keegana and O'Mahonyb observed an 11% increase of people starting to cross the intersection during the steady “Walk” and flashing “Don't Walk” signals [9]. A before and after observational study found a significant decrease in pedestrian-motor vehicle conflicts after installation of pedestrian countdown signals [10]. Lipovac et al. concluded that a countdown display could reduce the total number of violators significantly [11], whereas some other authors do not have the same significant conclusion on the impact of countdown displays and suggest further study. Huang and Zegger found that countdown signals had undesired effect of reducing compliance with walk phase [12]. Camden et al. even indicated no statistically significant effect of countdown signals on pedestrian-motor vehicle collisions based on data collected from 1965 intersections in Toronto [13].
The effectiveness of countdown signals is a complex issue due to the fact that we cannot take into account all relevant factors affecting more or less the crossing behavior of pedestrians. Prevailing opinion is that countdown signals have a positive impact on pedestrians only on certain appropriate intersections [13]. This paper is intended to reveal effectiveness of countdown signal on crossing behavior compared with traditional pedestrian signal. The rest of the paper is organized as follows. Section 2 describes the study sites and the data we collected from questionnaires and video recordings. Section 3 presents pedestrians’ attitude and preference to countdown signals and statistical results of the effects of countdown signals. The conclusions and recommendations for further study are presented in Section 4.
2. Method
Two types of data, obtained from questionnaire and video recording, were collected at two sites. One site was with countdown signal and the other one was with traditional signal. The survey was conducted to evaluate pedestrians’ attitude towards the countdown signals. Data extracted from payback of the video recordings was used to study pedestrians crossing behavior.
2.1. Site Description
The pavements of the two intersections are all clearly marked with crosswalks and stop bars. Demand of pedestrian crossing is quite high at the selected two intersections due to the fact that a large shopping center is adjacent. The left intersection is signalized with countdown pedestrian signal and the right one is with traditional signal. Distance of the two sites is about 250 m. Figure 1 shows locations of the two sites.

Locations of the two sites.
The explicit descriptions of the sites are as follows.
Treatment Site. The intersection is with countdown pedestrian signal. Pedestrian signal phases consist of symbols displaying a steady person in green for “Walk,” a flashing person in green for “Don't Walk,” and a steady person in red for “Don't Walk” with a numerical sequence counting down the seconds remaining until the next phase appears. Signal cycle is 160 seconds, and the pedestrian signal phase is as follows: 40 seconds with a steady person in green for “Walk,” 30 seconds with a flashing person in green for “Don't Walk,” and 90 seconds with a steady person in red for “Don't Walk.”
Control Site. The intersection is with traditional pedestrian signal. Pedestrian signal phases consist of symbols displaying the same message as the treatment site except the counting down device. Signal cycle is 120 seconds, and the pedestrian signal phase is as follows: 45 seconds with a steady person in green for “Walk,” 20 seconds with a flashing person in green for “Don't Walk,” and 55 seconds with a steady person in red for “Don't Walk.”
2.2. Data Collection
We got data concerning pedestrians’ attitude and preference towards countdown and traditional signals from interview survey. For each reviewer, six questions were asked as follows.
Is the countdown signal helpful in determining the time to enter the crosswalk?
How do you feel about crossing the crosswalk with a countdown signal compared with the traditional signal?
Do you prefer the countdown pedestrian signal to the traditional signal?
Which type do you prefer, the numeric countdown signal or the graphic countdown signal?
How long can you wait for crossing before becoming impatient?
Do you think it is necessary to install pedestrian countdown signals?
Pedestrians were asked to answer the above six questions at the sites of the countdown signalized intersection and the traditional signalized intersection. Totally, 73 questionnaires were gathered for statistical analysis.
Besides pedestrians’ attitude and preference to countdown signal from questionnaire, we collected data of crossing behavior by video recorder at each intersection. The video camera was placed on a tripod and set up on the sidewalk along the side street in order to capture the pedestrian signal as well as the pedestrian behavior at the crosswalk. At the treatment site, 1888 pedestrians crossing Haidian 1st E. Street along the east crosswalk were recorded within 1.2 hours. Among these pedestrians, 1221 persons are north bound and 667 persons are south bound, accounting for 64.7% and 35.3%, respectively. At the control site, 830 pedestrians crossing Haidian 1st E. Street along the west crosswalk were recorded within 0.9 hour. Among these pedestrians, 487 persons are north bound and 343 persons are south bound, accounting for 58.7% and 41.3%, respectively.
Pedestrians are classified as three categories according to the signal state when they enter the intersection:
compliers: those who entered the intersection during the display of a steady person in green for “Walk”;
adventurers: those who started crossing during the display of a flashing person in green for “Don't Walk”;
violators: those who entered the intersection during the display of a steady person in red for “Don't Walk.”
From the video recordings, we could get data of the number of compliers, adventurers, violators, and trapped pedestrians in each cycle. Trapped pedestrians are those who still stay in intersection when a steady person in red for “Don't Walk” is on. Impact of countdown signal on crossing behavior will be evaluated according to four measures of effectiveness, that is, proportions of compliers, adventures, violators, and trapped pedestrians.
3. Results
3.1. Pedestrian's Attitude and Preference
A survey aiming to gather information from pedestrians concerning their attitude and preference to the countdown pedestrian signal was conducted at the two intersections. Results based on pedestrians’ interviews are shown in Figure 2. Seventy-three pedestrians were interviewed at the two selected sites. Among these interviewers, 45 are female and 28 are male, accounting for 61.6% and 38.4% of the total, respectively.
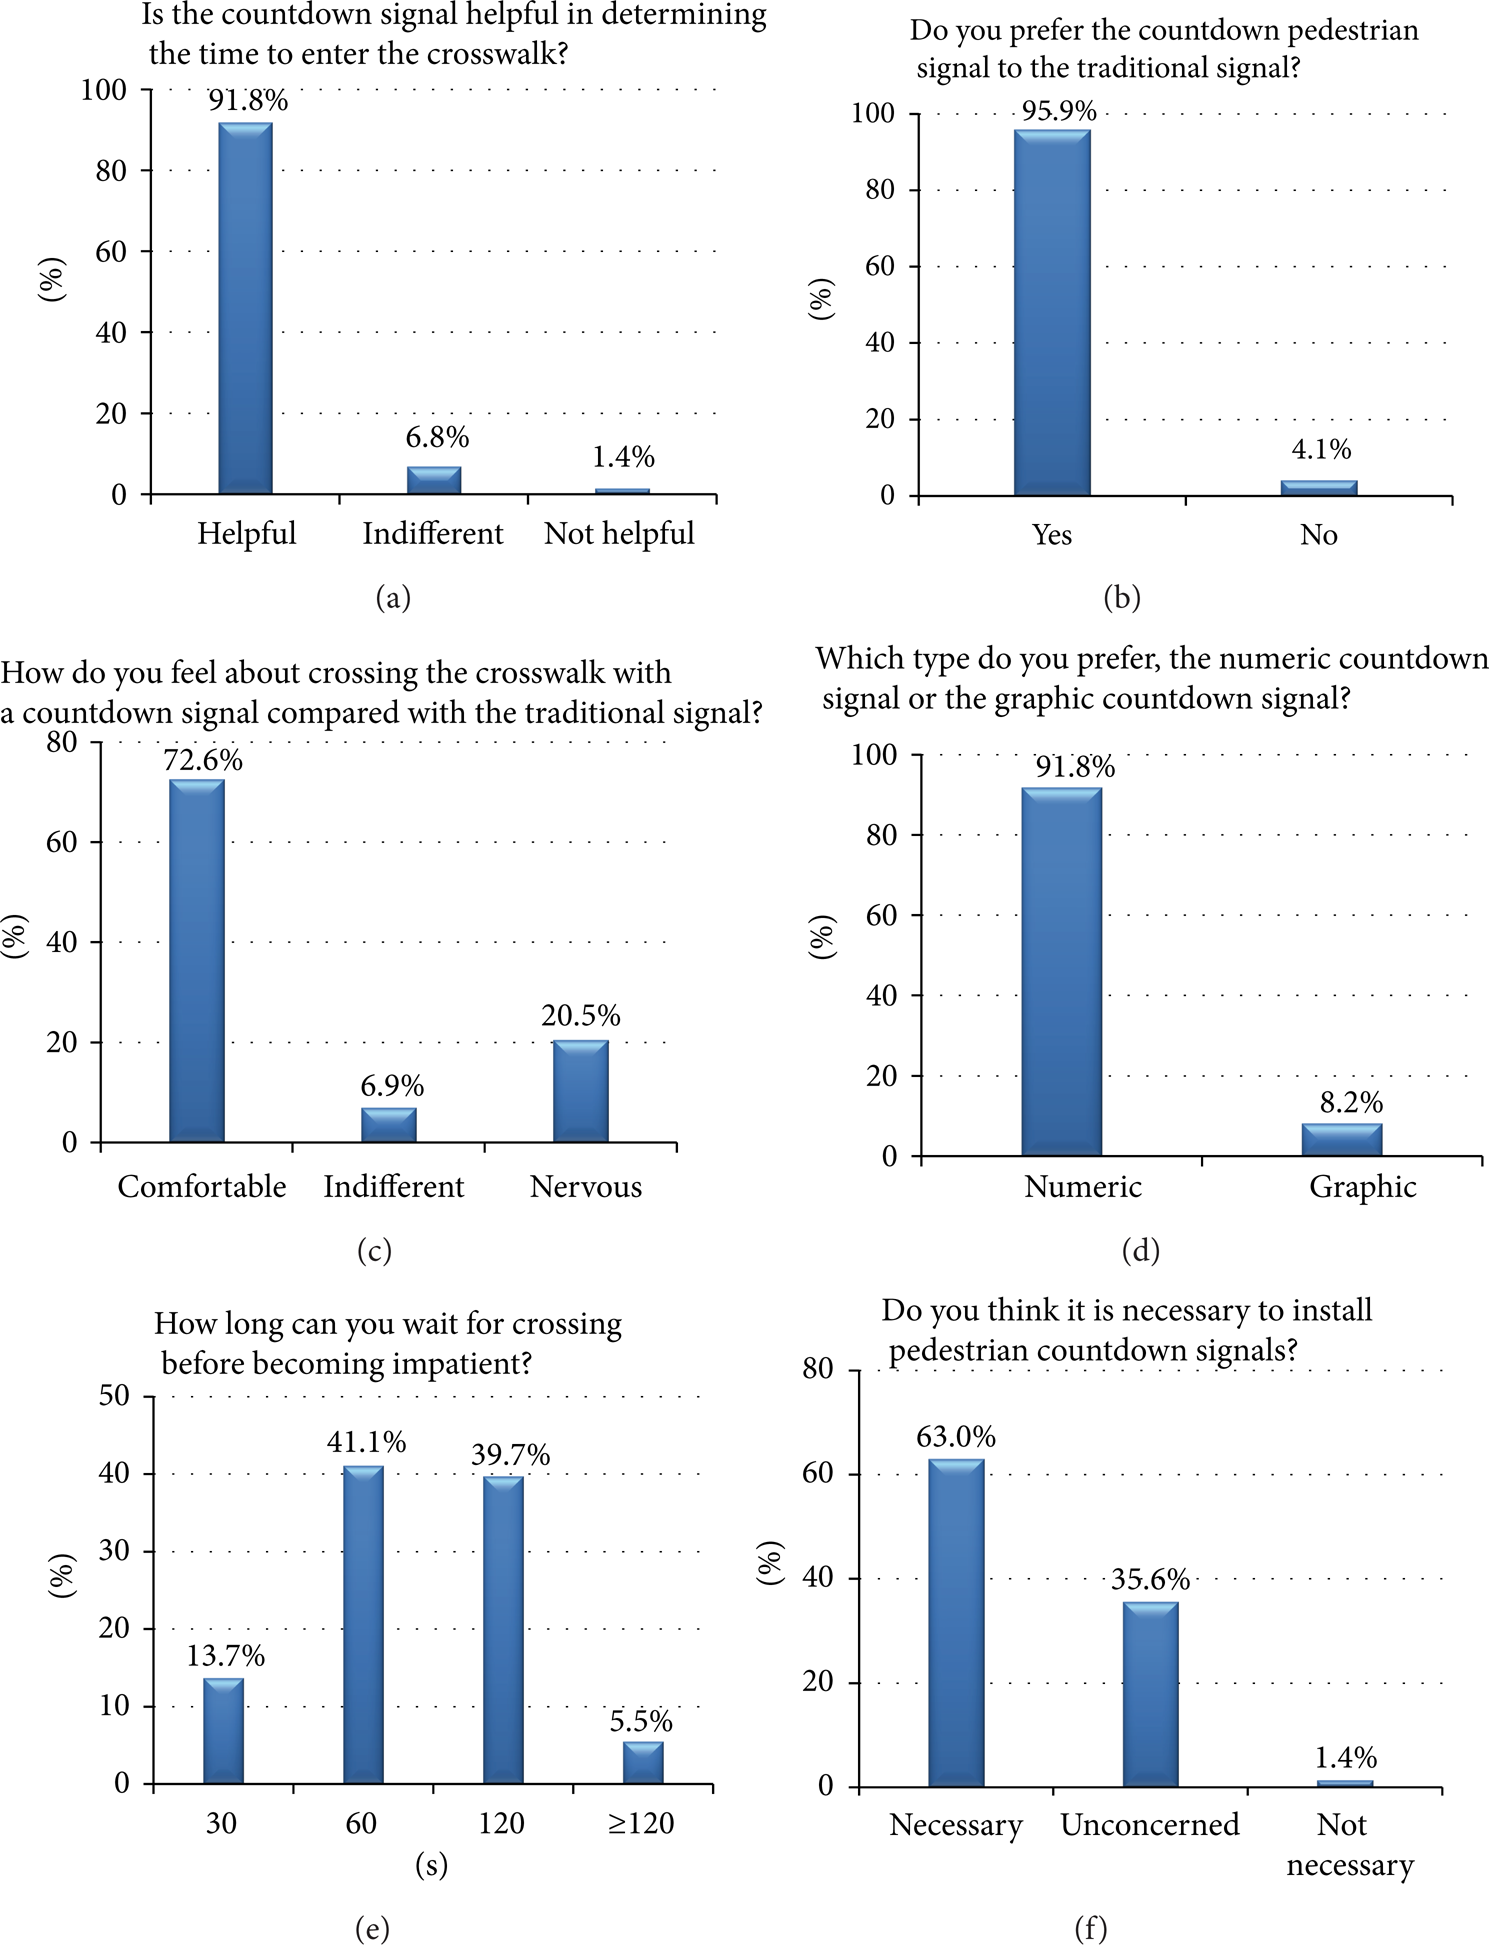
Results of pedestrian survey.
Figure 2(a) shows that 91.8% of pedestrians interviewed thought that countdown signals were helpful in determining the time to enter crosswalk. The answer is in accordance with results in Figure 2(b). It shows that as high as 95.9% of pedestrians preferred countdown signal to the traditional one. In Figure 2(c), only 72.6% of pedestrians felt comfortable with countdown signals compared with traditional signals, and 20.6% of pedestrians still felt that crossing was nervous no matter what type of signal was installed. The reason is that although pedestrians prefer countdown signals, crossing is still dangerous to them due to vehicle violation. As to numeric or graphic display for the countdown signal, 91.8% of pedestrians preferred the numeric type, which is shown in Figure 2(d). Figure 2(e) reflects pedestrian tolerate waiting time to cross intersection. Data shows that 94.5% of pedestrians cannot tolerate signal phase in red as long as 120 seconds. As for the question whether it is necessary to install countdown signals, only 63.0% of pedestrians thought it was necessary, and as high as 35.0% of pedestrians were not interested in such issue, as shown in Figure 2(f). This finding agrees with results from Figure 2(c).
3.2. Pedestrian Crossing Behavior
We study pedestrian crossing behavior at countdown signalized intersection and traditional signalized intersection by means of video recorder. During the field survey time, we collected data of 27 signal cycles from the countdown signalized intersection in 1.2 hours and 27 signal cycles from the traditional signalized intersection in 0.9 hour. Table 1 shows data collected at the two intersections.
Video data collected at the two intersections.

To intuitively reveal whether the countdown signal has influence on pedestrians crossing behavior, we list proportions of complier, adventurer, violator, and trapped pedestrians cycle by cycle in ascending order. See Figure 3.
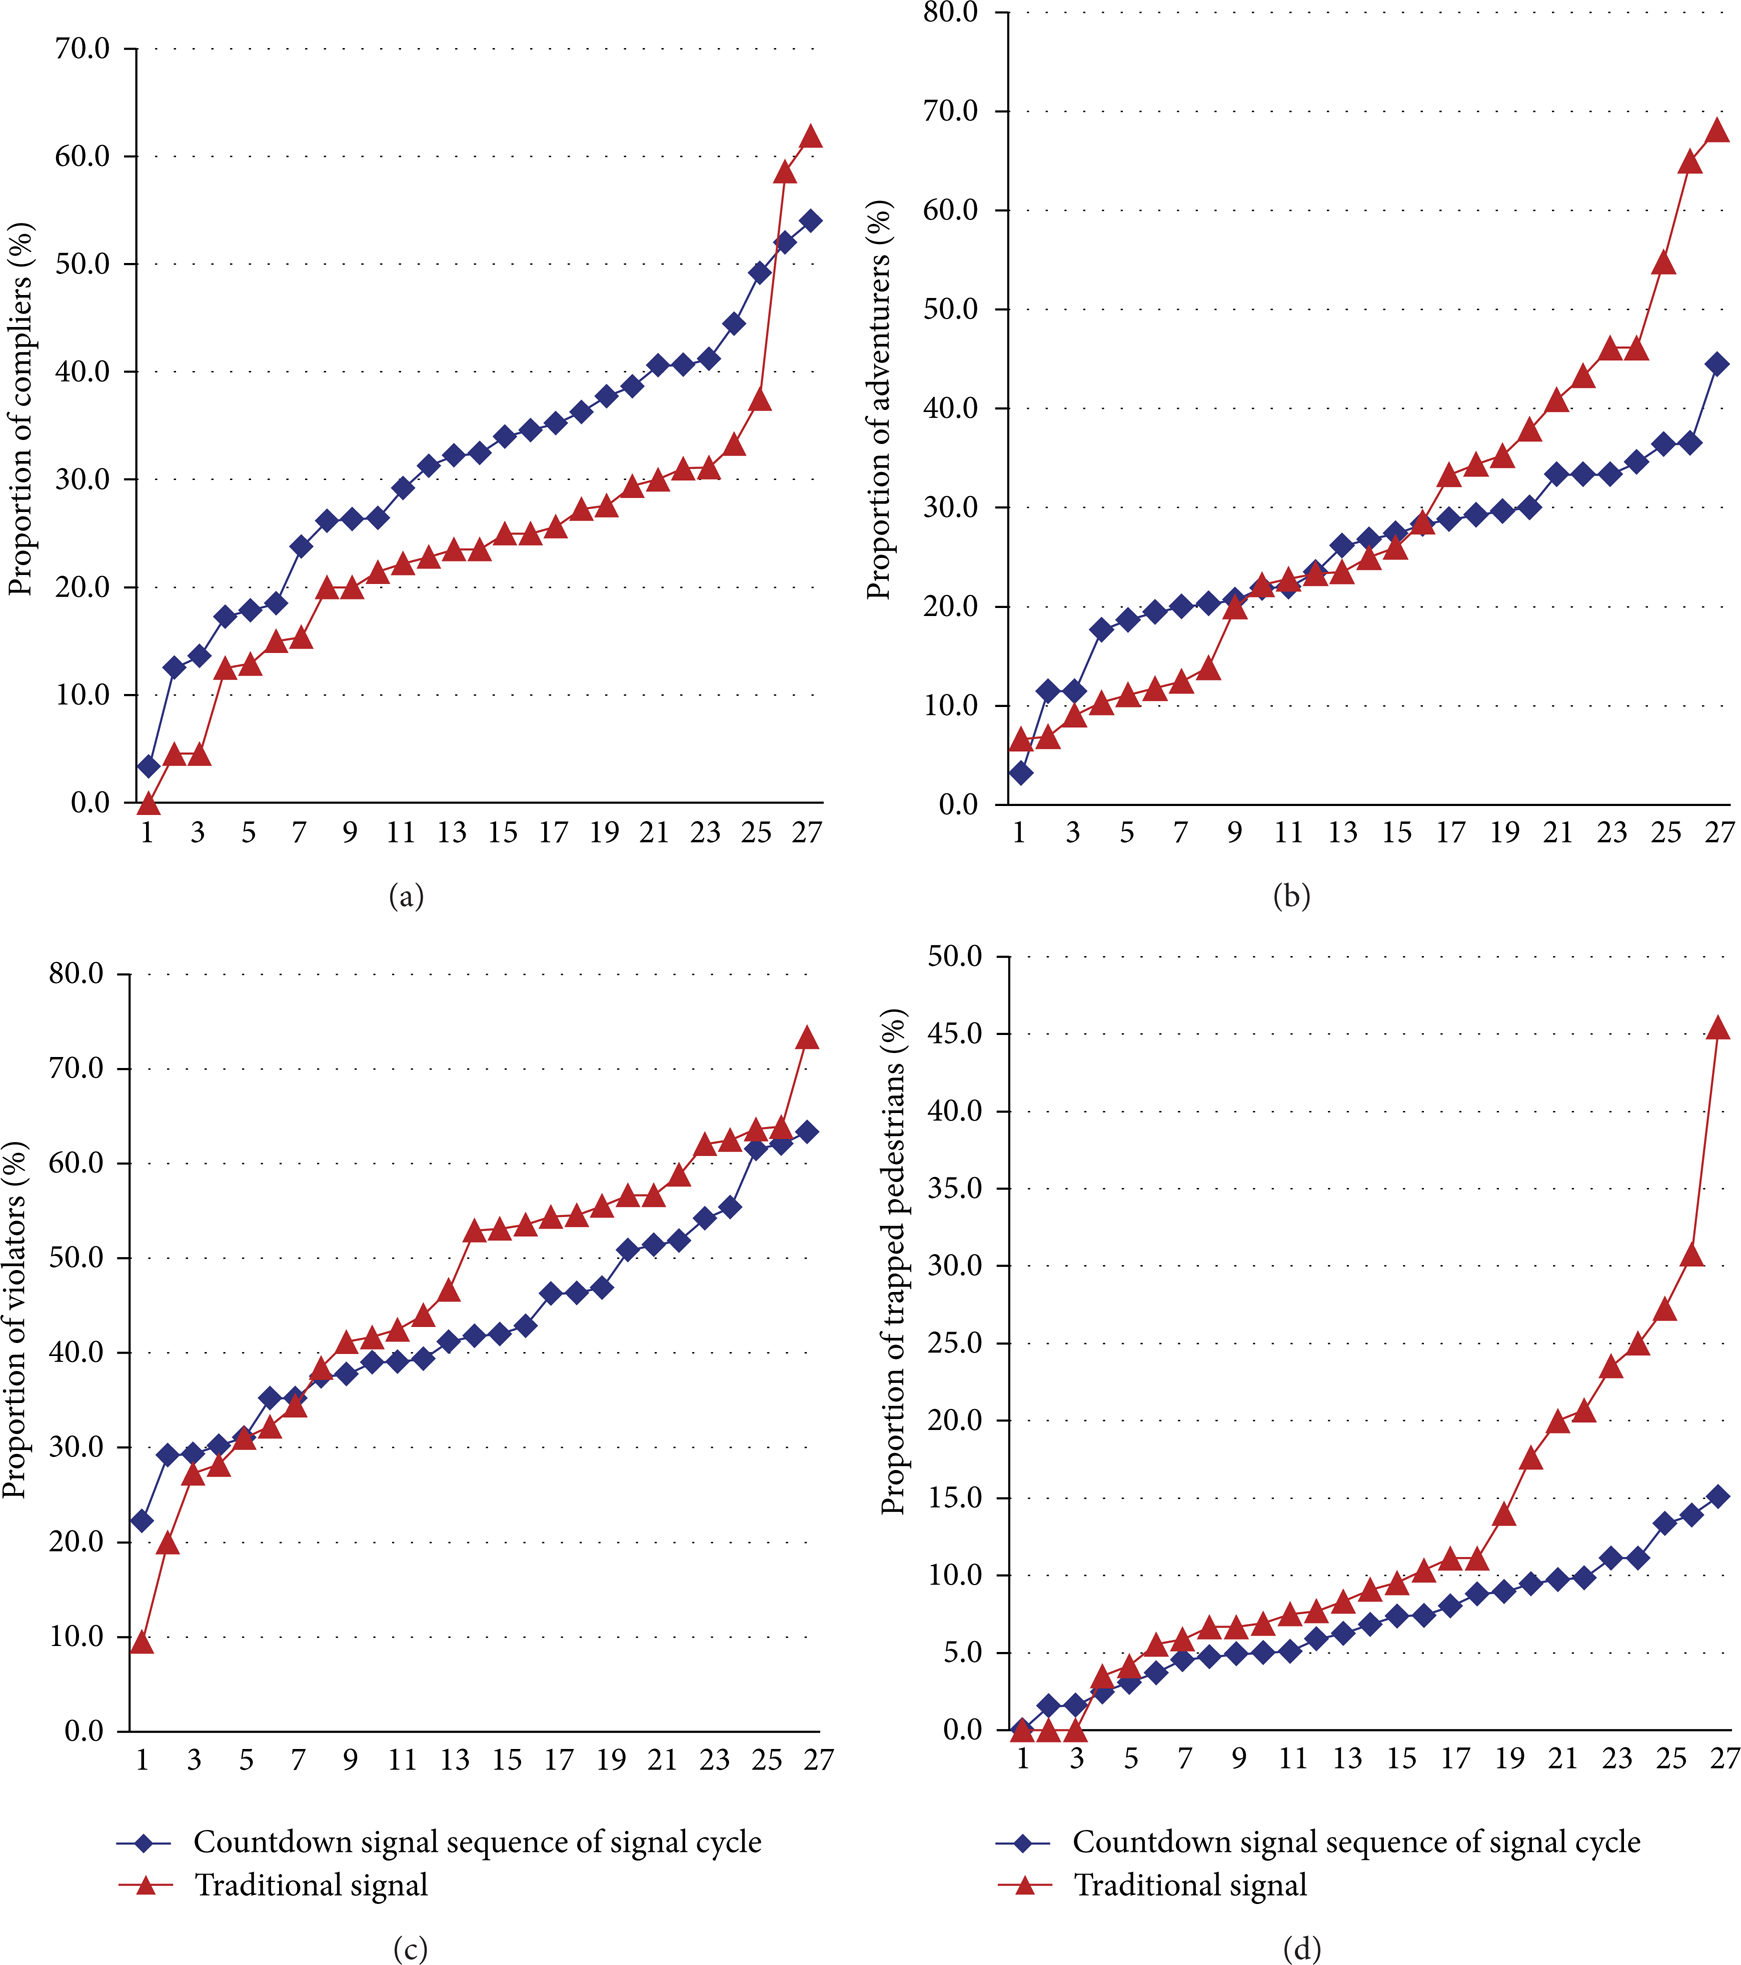
Comparison of pedestrian behavior at the two intersections.
Figure 3(a) shows that in each cycle except the last two, proportions of compliers at countdown signalized intersection are much larger than those at the traditional signalized intersection. The average proportions of compliers at the treatment site and control site are 32.2% and 24.8%, respectively. It indicates that countdown signal has positive effect on pedestrians crossing behavior. In Figure 3(b), we notice that during some cycles, proportions of adventurers at the countdown signalized intersection are less than, equal to, or larger than measures at the traditional signalized intersection. The average proportions of adventurers at the treatment site and control site are 25.7% and 27.6%, respectively. We cannot conclude that the countdown signal has significant positive effect on pedestrians crossing behavior. Statistical analysis will be conducted thereafter. Figure 3(c) shows proportions of violators at the two intersections. It is clear that during the first seven cycles, measures at the countdown signalized intersection are larger than those at the traditional intersection. For the other 20 cycles, the situation is reversed. The average proportions of violators at the treatment site and control site are 42.1% and 47.6%, respectively. A statistical analysis will be conducted to reveal whether and on what degree that the countdown signal has positive effect on pedestrians crossing behavior. In Figure 3(d), we can see that, almost during every cycle except the first three, proportions of pedestrians trapped in countdown signalized intersection are larger than those in the traditional signalized intersection. The average proportions of pedestrians trapped at the treatment site and control site are 7.0% and 11.8%, respectively. It indicates that countdown signal has positive effect on pedestrians crossing behavior in terms of traffic safety.
Applying four measures of effectiveness abovementioned, a statistical analysis on effects of countdown signal is presented in more detail as follows.
3.2.1. Behavior of Compliers
Compliers are those who entered intersection during the display of a steady person in green for “Walk.” To study whether there is difference with respect to behavior of compliers at countdown signal and traditional signal, we conduct hypothesis testing analysis.
We formulate null hypothesis and alternative hypothesis as

where p1 is proportion of compliers at the countdown signalized intersection and p2 is proportion of compliers at the traditional signalized intersection. The estimators of the population proportions are
The test statistic for H0:p1 = p2 is then

We reject H0:p1 = p2 if
From Figure 3(a) we see that proportions of compliers at countdown signalized intersection are much larger than those at the traditional signalized intersections. With countdown signal, pedestrians arriving at the curbside are quite clear to know how many seconds remained. Pedestrians with such information are very confident to make decision whether and when to cross intersection. The reason is in accordance with findings from Figure 2(a). Hypothesis testing shows strong evidence that countdown signal has positive effect to increase proportion of compliers.
3.2.2. Behavior of Adventurers
Adventurers are defined as those who started crossing during the display of a flashing person in green for “Don't Walk.” We formulate null hypothesis and alternative hypothesis as we did in (1), where p1 is proportion of adventurers at the countdown signalized intersection and p2 is proportion of adventurers at the traditional signalized intersection. The estimators of the population proportions are
It indicates that behaviors of adventurers at the two intersections are not different. We conclude that countdown signal does not have positive impact on adventures. In fact, there are many pedestrians who do not understand the meaning of the flashing signal displaying a person in green. Robertson and Carter found that only about half of pedestrians understood the meaning of the flashing “Don't Walk” display [14]. Upon seeing the flashing signal, some pedestrians think there exists all-red time for them to cross street safely after the timer counting to zero. To reduce the number of pedestrians who enter the intersection during flashing signal, we suggest that the symbol in green should be changed in amber.
3.2.3. Behavior of Violators
Violators are those who entered the intersection during the display of a steady person in red for “Don't Walk.” To reveal whether the countdown signal has positive impact on reducing proportions of violators, we formulate null hypothesis and alternative hypothesis as we did in (1), where p1 is proportion of violators at the countdown signalized intersection and p2 is proportion of violators at the traditional signalized intersection. The estimators of the population proportions are
When pedestrians arrive at the curbside, countdown signal provides clear information on how long they should wait for the next “Walk” signal. If the waiting time is not too long, pedestrians are willing to wait for some time to cross street. Without countdown signal, pedestrians get no information on how long to wait. Under such circumstance, some pedestrians will take risk to cross street. Actually, we even found that some pedestrians entered intersection at the last few seconds of the steady “Don't Walk” red signal phase at the traditional signalized intersection. However, this phenomenon never occurred during the survey time at the countdown signalized intersection. Hypothesis testing shows strong evidence that countdown signal has positive effect to reduce proportion of violators.
3.2.4. Proportion of Pedestrians Trapped
Pedestrians trapped are those who still stay at intersection when a steady person in red for “Don't Walk” is on. Proportion of pedestrians trapped is defined as number of trapped pedestrians over total pedestrians entering the intersection during the same time period. We apply this measure of effectiveness to evaluate whether countdown signal has positive impact on pedestrian safety. A hypothesis testing is conducted with null hypothesis and alternative hypothesis as shown in (1), where p1 is proportion of trapped pedestrians at countdown signalized intersection and p2 is the proportion at traditional signalized intersection. The estimators of the population proportions are
Recalling results from pedestrian survey, as high as 91.8% of pedestrians believe that countdown signal is helpful in determining the time to enter crosswalk. Even for the slow walker and those who entered at the last few seconds of steady “Walk” green signal, they will know how much time they have and will presumably attempt to finish crossing before “time runs out.” There is strong evidence to support the claim that countdown signal has significant positive impact on pedestrians’ traffic safety.
4. Conclusions
To study the effectiveness of countdown signals on pedestrians crossing behavior, two intersections were chosen as comparison scenarios. One intersection was with countdown signal taken as treatment site, and another intersection was with traditional signal taken as control site. Data were collected by means of questionnaire and video recordings at the two signalized intersections. The questionnaire aims to reveal pedestrians’ preference to countdown signals. It shows that 91.8% of pedestrians believe that countdown signals are helpful in determining the time to enter crosswalk, and 72.6% of pedestrians think that countdown signals are more comfortable for crossing.
Data from video recordings were applied to study effects of countdown signal on pedestrians crossing behavior. Four measures of effectiveness, that is, proportion of compliers, adventurers, violators, and trapped pedestrians, are used for statistical analysis. Hypothesis testing results show that countdown signals can significantly increase proportion of compliers and reduce proportion of violators and trapped pedestrians compared with traditional signals. However, countdown signals have weak impact on adventurers since many pedestrians do not understand the meaning of flashing signal. To decrease the proportion of adventurers, we suggest the display of flashing pedestrian in green to be in amber.
A larger number of treatment and control sites are needed for the further research to test the countdown signals. In addition, to reveal pedestrians crossing behavior, vehicle traffic flow, width of streets, trip purpose of pedestrians, type of crosswalk, and conformist mentality should be taken into account.
Conflict of Interests
The authors declare that there is no conflict of interests regarding the publication of this paper.
Footnotes
Acknowledgments
This work is partially supported by Beijing Municipal Natural Science Foundation (Grant no. 8092026). The authors are grateful to reviewer(s) for the invaluable comments.