
Abstract
Nondestructive detection of structural component of track crane is a difficult and costly problem. In the present study, acoustic emission (AE) was used to detect two kinds of typical welding defects, that is, welding porosity and incomplete penetration, in the truck crane boom. Firstly, a subsidiary test specimen with special preset welding defect was designed and added on the boom surface with the aid of steel plates to get the synchronous deformation of the main boom. Then, the AE feature information of the welding defect could be got without influencing normal operation of equipment. As a result, the rudimentary location analysis can be attained using the linear location method and the two kinds of welding defects can be distinguished clearly using AE characteristic parameters such as amplitude and centroid frequency. Also, through the comparison of two loading processes, we concluded that the signal produced during the first loading process was mainly caused by plastic deformation damage and during the second loading process the stress release and structure friction between sections in welding area are the main acoustic emission sources. Thus, the AE is an available tool for nondestructive online detection of latent welding defects of structural component of track crane.
1. Introduction
Track cranes are widely used in construction sites; however, there are many unpredictable fatal accidents arising every year in the world because of rupture of crane boom caused by welding defects such as weld porosity, oxide slag, and cracks. Therefore, those latent defects should be detected in advance to avoid catastrophic accidents; on the other hand, the detection activity should not affect normal operation of track crane. Acoustic emission (AE) technology has the advantages over other nondestructive tests (NDT); hence, we adopt this technology to detect welding defects in track crane boom online in this paper.
Acoustic emission is the phenomenon of transient elastic wave generation caused by structural alteration in solid materials under stress. When the material is subjected to stress at a certain level, a rapid release of strain energy takes place in the form of elastic waves which can be detected by transducers placed on it [1]. Friction, plastic deformation, initiation, and propagation of cracks are among the main sources of acoustic emission in metals [2, 3]. The elastic waves can be detected and monitored by sensors to yield information about AE source location and AE source characteristics, which in turn can aid structural damage assessment [4]. Compared to other observation techniques, AE technology has some of the principal advantages. (a) Since AE is produced at microscopic level it is highly sensitive and offers opportunities for identifying defects at an earlier stage when compared to other monitoring techniques. (b) As AE only detects high-frequency elastic waves, it is insensitive to structural resonances and typical mechanical background noise [5]. (c) It can even detect the growth of subsurface cracks even before it appears on the surface, which is one of the advantages of AE technology over the well-established vibration analysis [6]. (d) AE monitoring has an added advantage that it can record the damage process including precise determinations of the beginning of fractures and their consecutive progression during the entire load history without any disturbance to the specimen [7]. AE technique is widely used in nondestructive testing for the detection of crack propagation and failure detection in metal materials. However, damage and failure processes often generate several thousand events from one damage zone within a very short time interval, revealing a huge amount of data [8]. As numerous AE signals can occur during a nondestructive test, a variable which can represent the features of the AE signals is used in AE signal processing. With parameter-based AE techniques a fast analysis can be performed even online. The most common AE parameters measured are ring down count, event count, event duration and rise time, energy, and peak amplitude of the AE signal [9].
The aim of the paper is to assess the potential of the acoustic emission technology for detecting and locating two representative welding defects, that is, weld porosity and incomplete penetration welding defects, in truck crane boom. The specific objective is (1) to verify the ability of AE source location, (2) to compare AE source characteristic and its statistical characteristic of the two kinds of welding defects, and (3) to find the influence on AE signal by different loading steps.
2. Experimental Equipment and Methods
As is known to all it is terribly dangerous and costly to create boom fracture incident artificially such as presetting welding defect in the truck crane boom itself directly and to detect boom fracture directly during fracture process. Considering that the truck crane used in this study is a new one and there is not any active welding defect in its boom and other components, we design a subsidiary test specimen which has special welding defect preset on its center. In order to simulate defect and failure process of truck crane boom, the test specimen was added on the boom surface with the aid of two steel plates. During the loading process, when there are synchronous deformations such as plastic deformation and crack initiation appearing in the test specimen, other structural components such as truck crane boom are also in safe condition. Thus, the safe and normal operation of track crane cannot be influenced, and on the other hand real reliable defect information can also be achieved.
2.1. Experimental Instrumentation
The acoustic emission instrumentation consists of two transducers, a preamplifier, and a signal-processing unit. Monitoring of AE signals is achieved with the use of two commercially available piezoelectric sensors (Physical Acoustic Corporation type “R15”) with resonance frequencies at 150 kHz and an operating frequency range of 100 kHz∼400 kHz. The two piezoelectric sensors were mounted on the side of the test specimen specially designed with prefab welding porosity or incomplete penetration welding defects. And the two sensors were bound in place with elastic rubber ring symmetrically and coupled with silicone grease. AE parameters such as event counts and absolute energy were recorded over a time constant of 10 ms and sampling rate of 100 Hz. The signal output from the preamplifier (AEP4, 40 dB) was connected (i.e., via BNC/coaxial cable) directly to a commercial data acquisition card (Physical Acoustic Corporation type “SAMOS”). A PC is used for the acquisition and memorization of the AE signals. The signals are filtered with the threshold of 42 dB [10].
2.2. Test Specimen and Its Installation
HG70 steel is widely used for manufacturing structural component of track crane; therefore, test specimens were also made of this material in this study. And in order to study AE activities of welding crack defect, we prefabricated some welding cracks during the welding process. And all the samples were inspected using the Olympus microscope to ensure whether there had been any of the two welding defects introduced at the welding position during preparation [11]. Finally, seven samples with welding porosity and seven samples with incomplete penetration defects were selected as the test specimens, as is shown in Table 1.
Welding defect TAB.

The structural shape and size of the test specimens were shown in Figure 1. The width of cross-section of the specimen within the central 20 mm range is 10 mm, while on both ends it reached 50 mm; that is, the cross-sectional area of the middle section of 20 mm long is only one-fifth of that of both ends, so the deformation of the former should be five times that of the latter. The deformations occur at the small middle section of the steel plate. During the loading process, the test specimen attached on the boom will have the same synchronous deformation as the boom. When some welding defects are implemented in the central middle section of the test specimen, the internal activity of the deformation and fracture can be fully revealed during the loading process. By this way, we can analogue the destructive process of the boom during the loading failure process and get the AE feature information of the welding defect source.

Structural shape and size of the test specimens.
As shown in Figure 2, the test equipment used in this study is QY90V533 truck crane (Zoomlion Heavy Industry Science & Technology Development Co., Ltd., Changsha, China). Considering that the middle surface of first quarter of the main arm has maximum deformation in the loading process and it has enough space to hold auxiliary block and also that it is far from the engine so as to avoid noise signal of engine as far as possible, firstly we welded the two ends of the test specimen on two subsidiary narrow steel plates, and then the steel plate was welded through the multiple welding within the range of 1 meter on the main arm along both of the narrow ends of the steel plate.
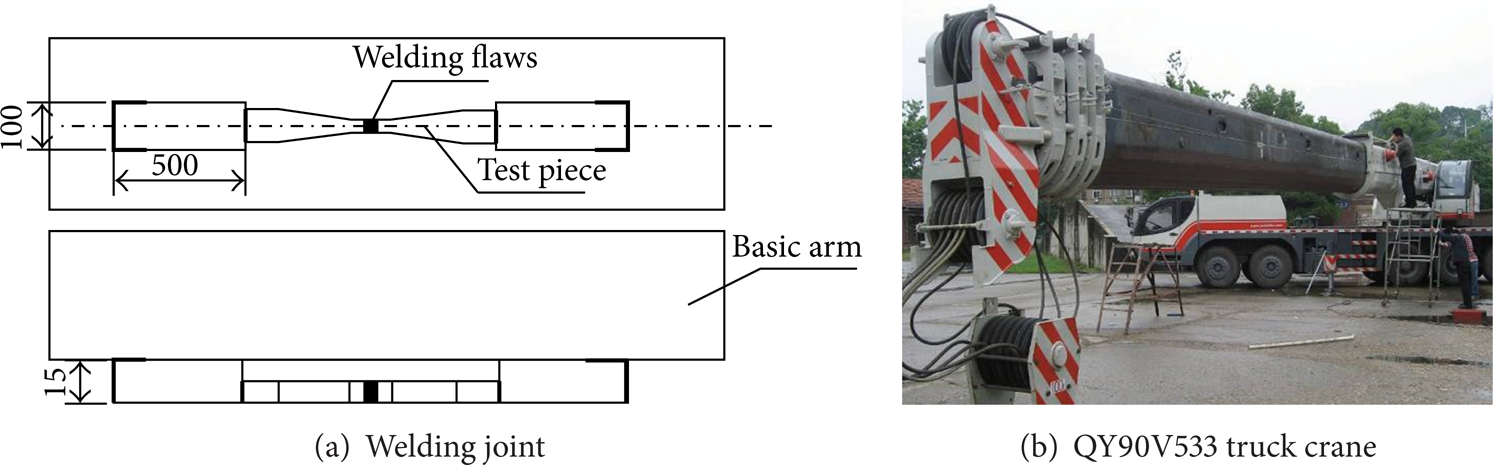
Welding position of the test specimen.
2.3. Loading Curve and Test Procedure
The load process includes two circles (loading curve was shown in Figure 3), and every circle constitutes three steps, that is, the loading, holding, and unloading course. If fracture failure happened during the first loading circle, then the second circle will not be done. The lifting weight used in this study is one and one-quarter times the rated load of the corresponding conditions. In order to produce the greatest deformation, corresponding elongation of boom, working range of basic boom should be selected. The loading mode used is four-arm not completely stretched out; the length of boom extension is 44 meters and the load is 11 tons; and the working range of basic boom is 13 meters.

Loading curve.
After the first loading circle, there are macrocracks appearing in five of the seven incomplete penetration test specimens, while there are macrocracks appearing only in one of the seven specimens with weld porosity. The reason is that different welding defects have different structure. Compared to weld porosity defects, the change of joint surface size of incomplete penetration specimen is larger, and the stress concentration is more distinct; therefore, macrocracks more easily appear in incomplete penetration test specimen.
A very useful method for evaluating AEs has been used to correlate the main parameters with the AE source physical process such as fracture. The procedural map of hits versus time of one test specimen selected at random from all of the test specimens was shown in Figure 4. From this figure, we found that during the beginning short 46 seconds, there are AE hits appearing; the reason is that, during this process under the combined stretching stress and bending stress, a large number of acoustic emission impact signals appeared which indicated a wide range of plastic deformation and welding crack initiation process happened in the crane jib weld zone. While in the holding step, because load no longer increases, no more acoustic emission signals appeared except for some scattered signals because of the Kaiser effect. Those scattered signals were caused perhaps by load fluctuating and boom shaking.

Acoustic emission signal location map of macrocrack damage process during the two loading circles.
3. Results
3.1. Analysis of AE Source Location
Determining of source locations of signals originating in real time from materials under load is one of the major advantages that AE offers over other NDT techniques. With knowledge of the signal velocity, the location of the AE source can be identified. For this investigation, at a threshold of 42 dB and with known distances between the AE sensors, the velocity of the AE waveform under such conditions was experimentally determined at 5000 m/s [12]. This velocity was used for all linear source location investigations by measuring the difference of arrival time of acoustic emission signals at the sensors. The three-dimensional linear location map of the bend course is presented in Figure 5. The time of bend course is plotted on the y-axis against the distance along the specimen (x-axis) and the events of the signals on the depth axis (z-axis).
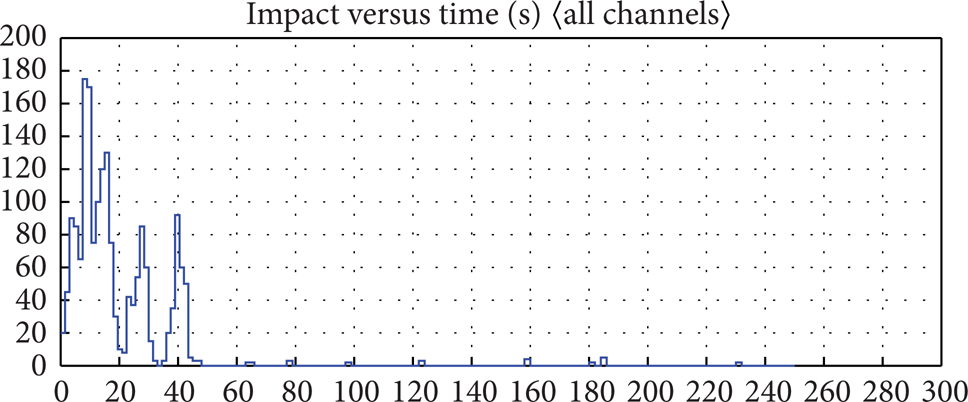
Procedural map of hits versus time during the first loading circle.
Location maps of macrocrack damage process WHT-5 and plastic deformation damage process QK-7 are shown in Figures 6 and 7, respectively. During the loading process the location position determined by AE signal is the same as the welding gap area, which indicated that by using AE technology we can determine the location of different welding defects accurately. According to the three-dimensional histogram, more than 90 percent of location events occur in loading process within 20's. During the load holding process, there are bare AE events caused by the damage process of welding defects which occurs within a short time of loading stage. On the other hand, location events for macroscopic crack of welding defects are concentrated mainly in the central region, while the distribution of the positioning result of those location events caused by plastic deformation defects is more dispersed.
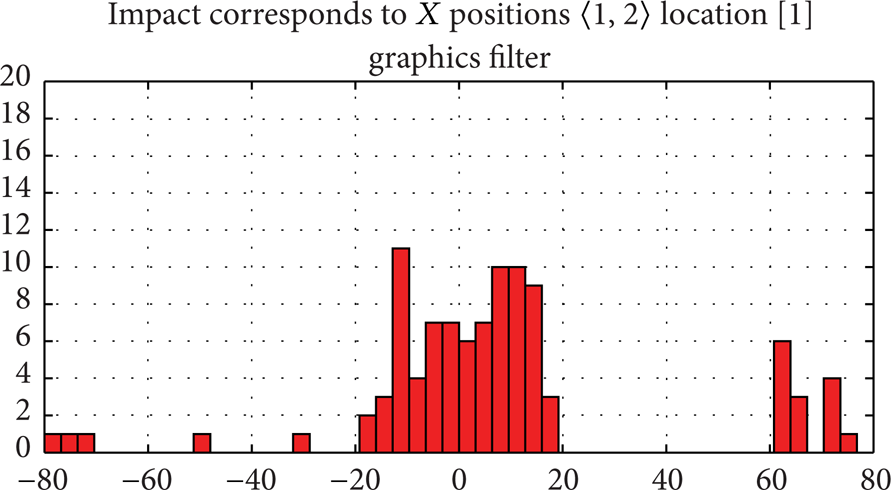
AE location map of macrocrack damage process.
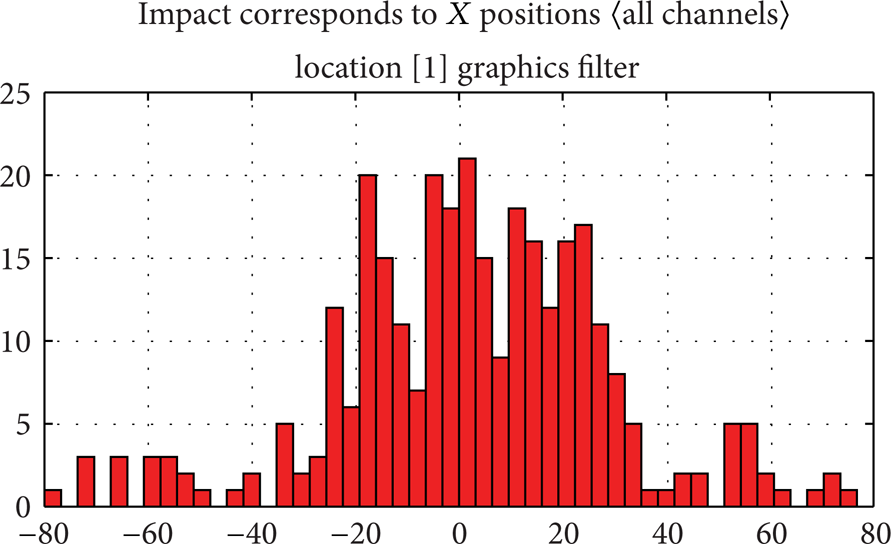
AE location map of plastic deformation damage process.
Moreover, the acoustic emission signal location maps for the two loading circles were shown in Figures 4 and 8, respectively. As shown in the two figures, during the first loading circle, because plastic deformation happened mainly in weld area, so the location signal appeared also in this position. After the unloading process, boom reset with the support of elastic deformation, so boom's length increases. Therefore, during the second loading process, location events appeared mainly on both sides of the sensor area, which is fit for the condition of region of stress. Thus, we can deduce that the rudimentary location analysis can be attained using the AE signal.

Acoustic emission signal location map of plastic deformation damage process during the two loading circles.
3.2. AE Source Statistical Characteristic of Different Welding Defects
Acoustic emission characteristics parametric statistics results of different welding defects were shown in Table 2. The comparative results indicate that the amounts of AE signals caused by welding porosity and incomplete penetration defects are roughly in the same order of magnitude; however, the distribution range of acoustic emission parameter value such as amplitude, energy value, count value, and time duration caused by the former is wider than that caused by the latter. For example, for QK-1 and QK-3 there are 10 percent and 15 percent of the whole location events whose amplitudes are larger than 60 dB, respectively, while for incomplete penetration specimen, those location events whose amplitudes are larger than 60 dB are distributed sporadically; for example, for WHT-5 the rate is 2 percent and for WHT-7 the rate is only 1 percent. For frequency domain characteristic parameters, the distribution of peak frequency for the two kinds of welding defects is basically the same range, while the distribution of frequency center of mass for the incomplete penetration specimen is relatively high, which is caused by a different mechanism of signal producing. In welding porosity defects there are many microholes with different sizes, so after stress deformation, micropore sizes get larger and there are slipping deformations. However, there is small range of macroscopic fracture, so the AE signal gives priority to plastic deformation, while for incomplete penetration defect welding connection was achieved only by a few weld joint surfaces and there are abrupt changes in section within weld zone; therefore, more stress concentration will appear during the loading condition.
Statistical characteristic parameter for different welding defect.

3.3. AE Parametric Statistical Analysis of Different Loading Steps
For macroscopic crack fracture caused by incomplete penetration welding defects, during the first loading circle the test specimen has been destructed, so there is no second loading process. So we only propose the AE signals parametric statistical analysis of the two loading processes caused by plastic deformation. From the source locations map, the first loading location source signal appeared within the area between −20 mm and 20 mm, while the second loading location source signal focused mainly on both sides of the test specimens, and the positioning coordinate for it is about −80 mm, −60 mm and 60 mm, 80 mm. We used such tools as spatial filtering to preprocess the previously mentioned AE signals of the two loading processes and got the statistical characteristic parameter table (as shown in Table 3).
Statistical characteristic parameter for different welding defect.

Firstly, for the amplitude of AE signal of the first loading circle, the amplitudes of 60 percent AE signals were lower than 50 dB. The amplitudes of only 13 percent AE signals were higher than 60 dB, and there are no AE signals whose amplitudes were larger than 70 dB. For the second loading process, the amplitudes of all the AE signals were higher than 50 dB, and also the amplitudes of 50 percent of AE signals were higher than 60 dB, especially the amplitudes of 27 percent of AE signals which were higher than 70 dB. Secondly, for the energy accumulation of AE signals, during the first loading circle, the energies of all the AE signals were all lower than 100 eu, while, during the second loading circle, the energies of 13 percent of AE signals were higher than 100 eu. Thirdly, for the AE counts, during the first loading process, only 9 percent exceeded 100, while in the second loading process there are 60 percent of AE signals whose counts exceeded 100. Moreover, for duration time, 11 percent of AE signals during the first loading process exceeded 1000 us, while for the second loading process the number is 80 percent.
The signals produced during the first loading process are mainly plastic deformation damage signals appearing in welding defect area, so all the time domain indices of AE signals are relatively low. After completion of the unloading, plastic deformation cannot recover; therefore, stress concentration was produced in welding area at both ends. During the second loading process, stress releases and structure friction between sections in weld area are the main acoustic emission source; therefore, all time-domain indices are higher. Comparatively speaking the frequency domain characteristics index difference was not obvious.
4. Conclusion
The location characteristic of AE event and some typical AE parameters discussed in this paper can be used as the valuable indicators of welding crack defects in structural component of track crane. In order to prevent rupture accidents of track crane during its working course and also to reduce the loss, our study emphasizes the online application of those typical AE characters in order to detect obvious and especially latent welding crack defects in structural components of track crane. Some basic works were done and some valuable conclusions were achieved in this paper.
Firstly, we designed a subsidiary test specimen with special welding defect preset and added it on the boom surface to make it have the same synchronous deformation as the main arm. Therefore, during the loading process we can get the AE feature information of the welding defect source without influencing normal operation of equipment. The location of the AE source was identified by linear source location method and using the acoustic emission signal location map for the two loading circles we deduced that the rudimentary location analysis can be attained using the AE signal acquired.
Secondly, the comparative results of acoustic emission characteristics parametric statistics of different welding defects indicated that the amount of AE signals caused by welding porosity and incomplete penetration defects are roughly in the same order of magnitude. However, the distribution range of acoustic emission parameter value such as amplitude, energy value, count value, and time duration caused by the former is wider than that caused by the latter. For frequency domain characteristic parameters, the distribution of peak frequency for the two kinds of welding defects is basically the same range. The distribution of frequency center of mass for the incomplete penetration specimen is relatively high, which is caused by different mechanism of signal producing. There are many micropores with different sizes in welding porosity defects, so micropore sizes become larger and there are slipping deformations after stress deformation. There are none with wide range of macroscopic fracture, so the AE signal gives priority to plastic deformation, while for incomplete penetration defect welding connection was achieved only by a few weld joint surfaces and there are abrupt changes in section within weld zone. More stress concentration will appear during the loading condition, so its time-domain dynamic parameters of AE signal are relatively low, while its frequency domain characteristic parameters are higher.
Finally, we compared the AE signals parametric statistical of the two loading processes caused by plastic deformation. From the source locations map, the first loading location source signal appeared within the same area as the preset welding defects, while the second loading location source signal focused mainly on both sides of the test specimens. Also we found that all the time domain indices of AE signal are relatively low. Comparatively speaking the frequency domain characteristics index difference is not obvious, which is because after completion of the unloading plastic deformation cannot recover; therefore, stress concentration is produced in welding area at both ends. During the second loading process, stress releases and structure friction between sections in welding area are the main acoustic emission source; all time-domain indices are higher.
As a conclusion to this paper, we find that AE is an available and useful tool for nondestructive online detection of latent welding defects of structural component of track crane.
Conflict of Interests
The authors declare that there is no conflict of interests regarding the publication of this paper.
Footnotes
Acknowledgment
This study was funded by the National High Technology Research and Development Program of China (2013AA040402).