
Abstract
This paper presents an experimental investigation of flow phenomena related to the characteristic frequencies of pressure fluctuation in Francis hydroturbine models. The experiments were carried out on two test rigs with two model runners having hydraulic similarities. Flow field around the guide vanes was measured with a particle image velocimetry (PIV) on the first PIV test rig. Flow structures at the inlet region of runner and in draft tube at different operating conditions were visualized on another hydrodynamic test rig. Analyses of dominant frequency of unsteady hydraulic behaviors in the tested hydroturbines were performed. It was observed that the main frequency of flow over the guide vanes and the dominant frequency of channel vortex equal the blade passing frequency; the dominant frequency of flow separation at the suction side of blade inlet equals the vane passing frequency; the vortex rope in the draft tube displays a low-frequency nature. The flow instabilities and fluctuations directly influence the running of hydroturbine, thus these experimental results could provide important evidence for the stability study of a real hydroturbine.
1. Introduction
The capacity increase of power grid and the elevation of voltage level call for the larger scaled hydroturbine generator set, such as the upcoming 1000 MW hydraulic power unit. Such large-scale hydroturbine has unique characteristics, and therein the working stability becomes the key issue for the turbine design, development, and running. With the increases of capacity and dimension of turbine, the flow rate through the turbine passage increases, resulting in severe energy fluctuations in the turbine. On the other hand, the inherent frequency of turbine decreases as the turbine size increases, so that it is possible to be resonant with the low-frequency vortex rope in the draft tube. The vibration of the turbine may damage the blades, draft tube, and even the power house.
Considering the instability and vibration problems in hydroturbines, the complicated turbulent flow structures inside the turbine should be referred to, such as the cavitating flow, flow separation, channel vortex, and the draft tube vortex. On the theoretical analysis of hydraulic design, currently there are no good approaches to prediction and assessment of the possible instability issues.
For the bladed hydraulic fluid machinery, cavitation is a major factor influencing the turbine stabilities. Investigation on the cavitation in pumps has been paid much attention [1–4]. However, there are much fewer studies on the cavitation inside the hydroturbine runner, which actually calls for deeper researches on this problem. Most of studies on the characteristics of turbulent flow field in the turbine runner were accomplished by numerical simulations using computational fluid dynamics (CFD) techniques. Based on the analysis of fluid-structure interactions, Xiao et al. [5] proposed a dynamic stresses analysis on the runner blades. It was found that the flow field simulation needs to include the entire flow passage to model the runner vane surface pressure distribution so that stresses in the runner vane can be accurately calculated. Jošt and Lipej [6] numerically predicted the patterns of vortex rope in the draft tube, and they concluded that pressure fluctuations were usually a result of the strong vortex created in the center of flow at the outlet of the runner. Their simulations also showed that the results based on the improved Reynolds averaged Navier Stokes model (RANS) rather than the multiphase cavitation model agreed better to the experimental results. Ruprecht et al. [7] carried out a series of numerical simulations on the vortex rope under part-load operating conditions. By applying the extended model of Kim and Chen [8], the prediction was improved and the vortex rope was captured in their simulations, and the results of the vortex rope agreed well with measurements. Vu et al. [9] introduced a novel method for mitigating the severe flow field fluctuations in Francis turbines operated at part-load condition, which led to the conclusion that the occurrence of the helical vortex breakdown at part load condition is directly related to the severe flow deceleration at the axis downstream of the runner.
Owing to the development of advanced flow velocity measurement and flow structure imaging techniques, including the well-known particle image velocimetry (PIV), laser Doppler velocimetry, and laser induced fluorescence (LIF), one can employ the model test to precisely measure the flow field, shedding vortex, channel vortex, draft tube vortex, cavitation, and so forth. The accurate description of pressure on the rotating parts such as runner and on the still parts such as draft tube could provide key evidence for the stability study of hydroturbine. So far, measurements of velocity field in a hydroturbine by using PIV have been focused on the area of draft tube. The flow field measurement inside the guide vanes and runner of a hydroturbine is scarce because of the local complicated geometries of flow passage. Houde et al. [10] studied the characteristics of the cavitating and noncavitating part-load vortices in the draft tube of a propeller turbine by means of PIV/LIF and CFD. Ciocan et al. [11] presented a CFD methodology to study the unsteady rotating vortex in the Flindt draft tube and also reported an associated experimental study of the flow phenomena. A large experimental database was built in the frame of the Flindt project for partial flow rate operating regime. Kuibin et al. [12] developed an approach to creating new instruments for assessment of turbine behavior running with conditions far from the design operating point and obtained results in good agreement with the experimental data available for a Francis model turbine. Kasper et al. [13] has studied the passage vortex breakdown by injecting ink inside the passages of a linear vanes cascade. It has for the first time shown detailed flow visualization photographs of the interaction between the vane passage vortex and the rotor of an axial flow turbine. The event of a vortex breakdown has been identified. Besides, PIV system was used to measure the flow field and the rope boundary behavior in a hydroturbine model at different cavitation conditions [14, 15], which allowed an experimental database to be available for future validation of analytical modeling and numerical simulation of draft tube flows. Also in the casing of a Pelton turbine, investigations were performed on the jet coming out from the nozzle by using PIV [16].
The channel vortex, vortex shedding, and draft tube vortex would result in significant variations of the turbine performance. It is of great importance to assess the hydroturbine stabilities to ensure safe and stable running. In this study, we report experimental studies on the flow characteristics in hydroturbine using two fabricated model runners of hydroturbines. One of the turbine models was for PIV test, whose head-cover, guide vanes, and draft tube were made of transparent Plex glass, and the other one for hydraulic test was made of stainless steel in order to ensure the mechanical strength. The inner flow fields can be visualized by using high-speed camera, endoscope, and/or measured by PIV system. The flow characteristics in the guide vanes and draft tube were also investigated. The results could provide important evidence for the stability study of hydroturbines.
2. Experimental Apparatus
The current investigation was carried out with two experimental setups: a test loop including a specifically designed model turbine, which was used to measure the flow field passing the guide vanes using PIV, and a hydraulic test rig including another model turbine, which was used to observe the channel vortex and vortex shedding out of the blade. The model runners used in those two test systems had the same shape profile but different dimensions. However, the flow similarities have been guaranteed for these two models and can be directly transposed to the real runner's flow states.
2.1. PIV Test System
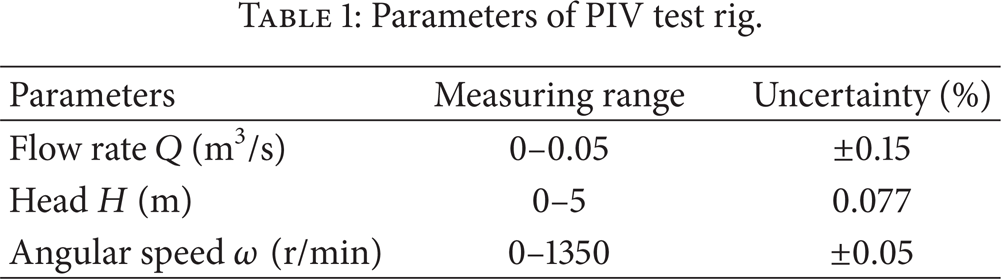
The model runner for PIV testing has a diameter of 0.15 m, with 15 blades, 24 guide vanes, and 23 stay vanes. Both guide vanes and stay vanes have a uniform height of 27.39 mm. The tip clearance between the runner blades and the shroud is 0.3 mm. The test rig with the Francis turbine and PIV setup are schematically displayed in Figure 1, and a real photograph of the model turbine system is shown in Figure 2. The main specifications of the whole system are listed in Table 1.
Parameters of PIV test rig.

Schematic of the test rig and measuring system. (1) tank; (2) pump; (3) electromagnetic flow meter; (4) gate valve; (5) needle valve; (6) stabilizing flanged gate; (7) coned tube; (8) model turbine; (9) expansion joint; (10) PIV measuring system.

The real model turbine.
The presently used PIV system is a standard two-dimensional two-component (2D-2C) PIV (TSI Inc., Shoreview, USA). For the illumination system of PIV, the double-pulsed YAG200-NWL (New Wave) laser generator has a maximum power output of 200 mJ/pulse, maximum repetition rate of 15 Hz, and emission wavelength of 532 nm. The thickness of light sheet is 0.5 mm. Pairs of digital images are captured by a 12-bit CCD camera (TSI Powerview Plus with 2048 × 2048 pixel resolution). A TSI synchronizer box controls the strobing and timing of the camera and laser. The dual frame acquisition rate is 8 Hz, and so the sampling frequency of velocity frames is 4 Hz. The used tracing particles are made of polystyrene and have 40 μm average diameter.
The model turbine for PIV test was fabricated with certain purpose of flow visualization. In order to measure the flow field inside the turbine, part of guide vanes and stay vanes are transparent to let the laser pass through (Figure 3(a)); meanwhile a hole is drilled on the casing at a corresponding position facing the transparent vanes (Figure 3(c)). To capture the inside flow, the CCD camera is set right up the head-cover with thinned transparent observing window (Figure 3(b)). Also the draft tube is made transparent to view the cavitating vortex rope. This vortex rope is recorded by high-speed camera with the aid of stroboscope (Figure 3(d)). Figure 3 shows the related transparent parts and the setting locations of experimental apparatus.
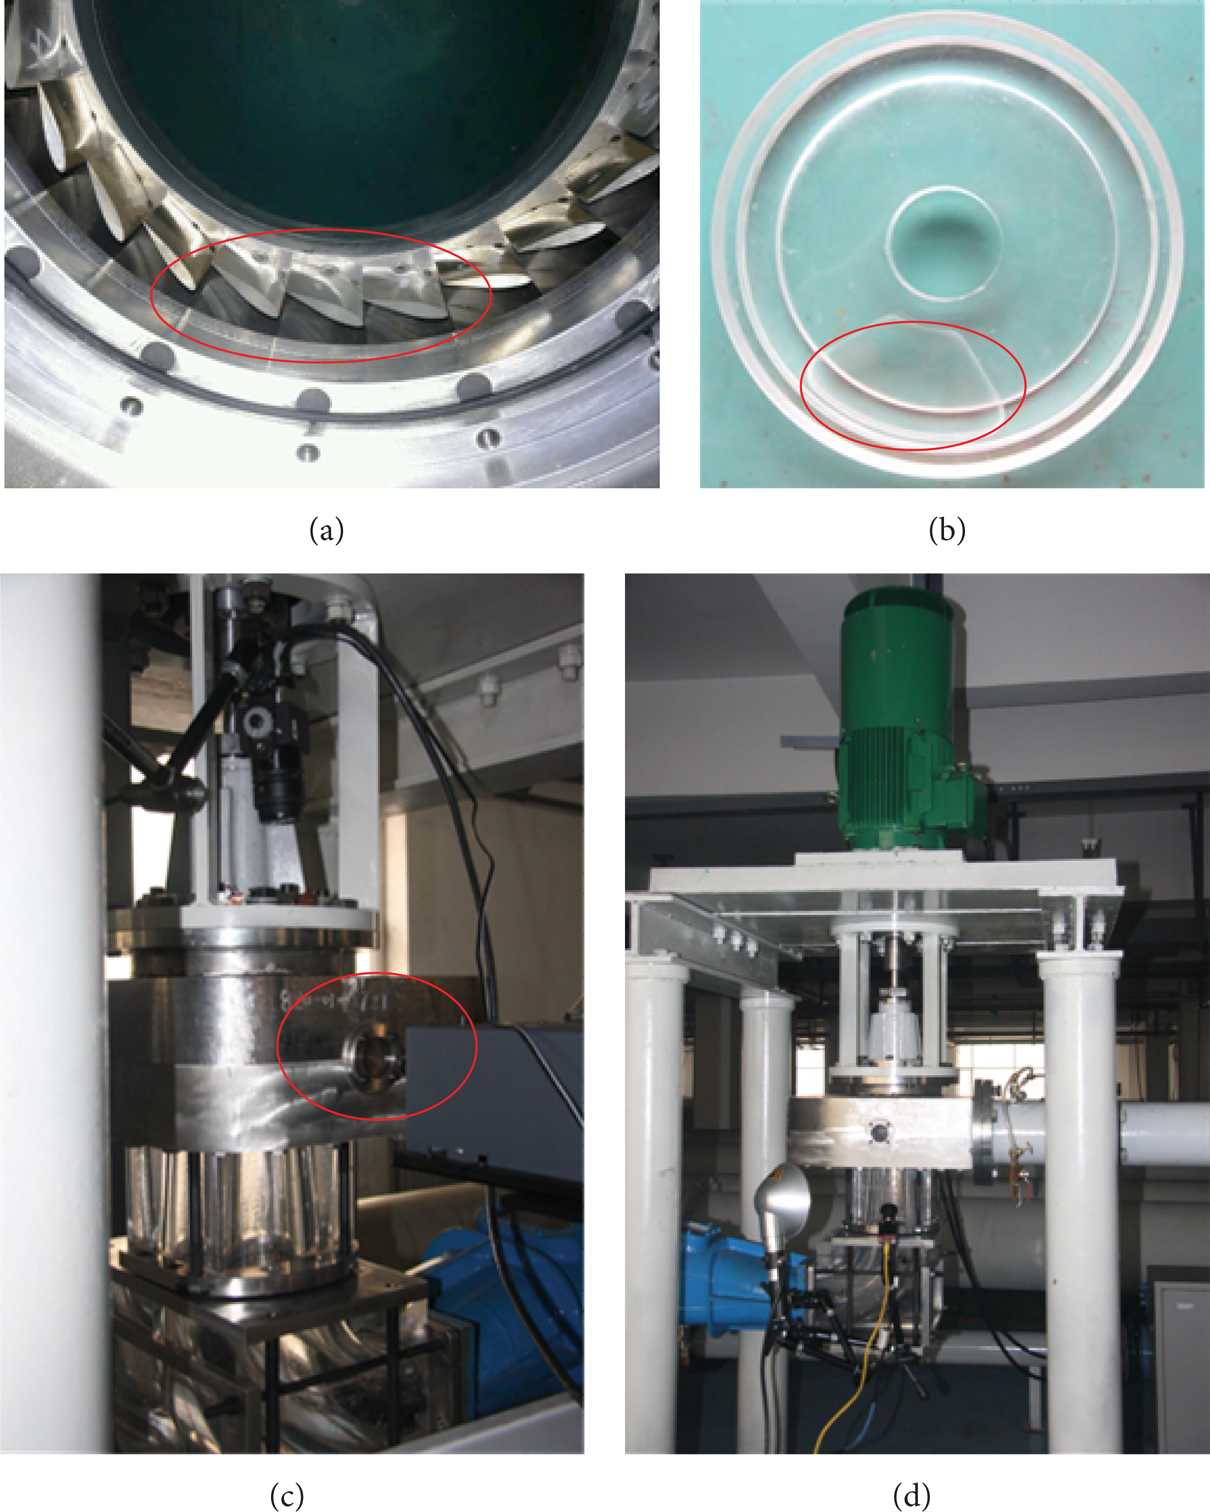
The transparent components and the setting locations of experimental apparatus: (a) transparent guide vanes; (b) transparent head-cover and thinned part; (c) drilled hole in casing; (d) settings for draft tube vortex visualization.
2.2. Hydraulic Test Rig
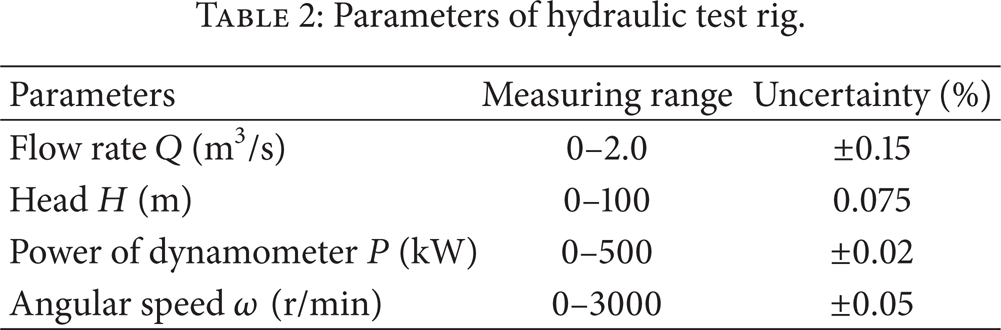
The model runner for hydraulic test has a diameter of 0.42 m and the same number of vanes as that of the former one. This model runner is nearly 3 times larger than that for the PIV test. Also the guide vanes and stay vanes have a uniform height of 76.68 mm. The hydraulic test rig is schematically displayed in Figure 4, and the main specifications of the whole system are listed in Table 2.
Parameters of hydraulic test rig.

The hydraulic test rig.
In this part of experiment, the flow visualization inside the space between two blades was realized by using an endoscope and a stroboscope. The stroboscope (3244CN, DRELLO Inc., Germany) is to supply a high-intensity light illumination and the endoscope (ϕ10 mm × 300 mm × DOV50°, WOLF Inc., Germany) is inserted into the shell of the bottom ring. Thus the flow structure is recorded by a high-speed camera connecting to the endoscope. These setting locations are shown in Figure 5.

The schematic of endoscope and stroboscope locations.
3. Experimental Results and Discussion
The operating conditions are chosen for certain flow phenomena, such as flow separation, vortex shedding, draft tube vortex, and channel vortex, which can be captured with the aforementioned two setups. The operating points are shown in the synthetical characteristic curve and labeled in red circles in Figure 6. Note that, in order to run at different values of n11, the operating conditions are presently chosen as constant rotating speed of runner but varying waterheads. The tested constant rotating speed of runner is 500 rpm.

Synthetical characteristic curve of model runner.
3.1. Flow around the Guide Vanes
The stability of a Francis turbine is determined by the interactions between wake flow of guide vanes and runner blade inlet flow and between the channel vortex in the runner and vortex rope in the draft tube. The flow instability of the Francis turbine at small opening of guide vanes (14 mm) was studied. The measuring region for PIV test is shown in Figure 7. During PIV test, the CCD camera viewing direction is adjusted to make sure that the guide vanes are overlapping onto a plane normal to the height direction, which avoids the measurement error caused by shooting angle. In the testing plane, the PIV images cover a planar rectangular area of 32.09 mm × 32.09 mm. The interrogation area is set as 32 × 32 pixels (with 50% overlap in each direction) for velocity vector analyses. The resulted spacing between adjacent vectors Δx = Δy = 0.51 mm.

The measuring region of PIV test.
To eliminate the measurement error caused by the limited number of captured PIV sample images, the number-independence verification was studied. Different numbers of images sampled in the PIV test can obtain different velocity fields. The influences of the number of images on the mean velocity and the fluctuation intensity of velocity are shown in Figure 8. It can be seen that the mean velocity and the fluctuation intensity of velocity in the measuring region are gradually close to a constant value as the number of images increases. When the number of sampled images is more than 160, the accuracy of the PIV test is acceptable. So the number of images for each operating condition for the following PIV test is chosen to be more than 200.

The variation of flow velocity and velocity fluctuations versus the number of sample images captured in PIV test.
It is imaginable that the change of velocity field nearby the guide vane should have a relationship with blade passing frequency. This periodic change causes the pressure in the vaneless space to fluctuate periodically, leading to the dominant frequency of pressure fluctuation being equal to the blade passing frequency. The pressure fluctuations in the vaneless space can be attributed to the interaction of wake flow of guide vanes and flow attack at the runner inlet. To investigate the flow interaction between runner and guide vanes, the flow distribution around the guide vanes at n11 = 55 rpm is studied. The flow evolution nearby the guide vanes is shown in Figure 9. Note that this flow evolution is obtained based on the periodicity of flow phenomenon in a hydroturbine as follows. The time interval between two neighboring runner blades passing the guide vane focused by PIV camera (equals 0.008's according to 500 rpm rotating speed of runner and 15 runner blades) is divided into four equivalent time steps with each step being 0.002's. The runner takes 0.12's to rotate one round. For each time step, PIV frames corresponding to time instants of 0.12 × N + 0.002 × (n–1) seconds are selected and averaged, where N represents integers and n represents the nth time step. It can be seen that the velocity field at the pressure side of the guide vane does not change while the velocity field at the suction side changes with time. As expected, the velocity field at the suction side of the guide vane changes periodically by 0.008's, which is obtained by inspecting all the measured velocity frames. The corresponding main frequency is 125 Hz, which is 15 times the rotating frequency (rotating speed of runner is 500 rpm). It is accordingly the same as the blade passing frequency (as introduced previously, there are 15 blades). This result implies that the vane-blade interaction occurs at every 0.008's, at the current testing position.
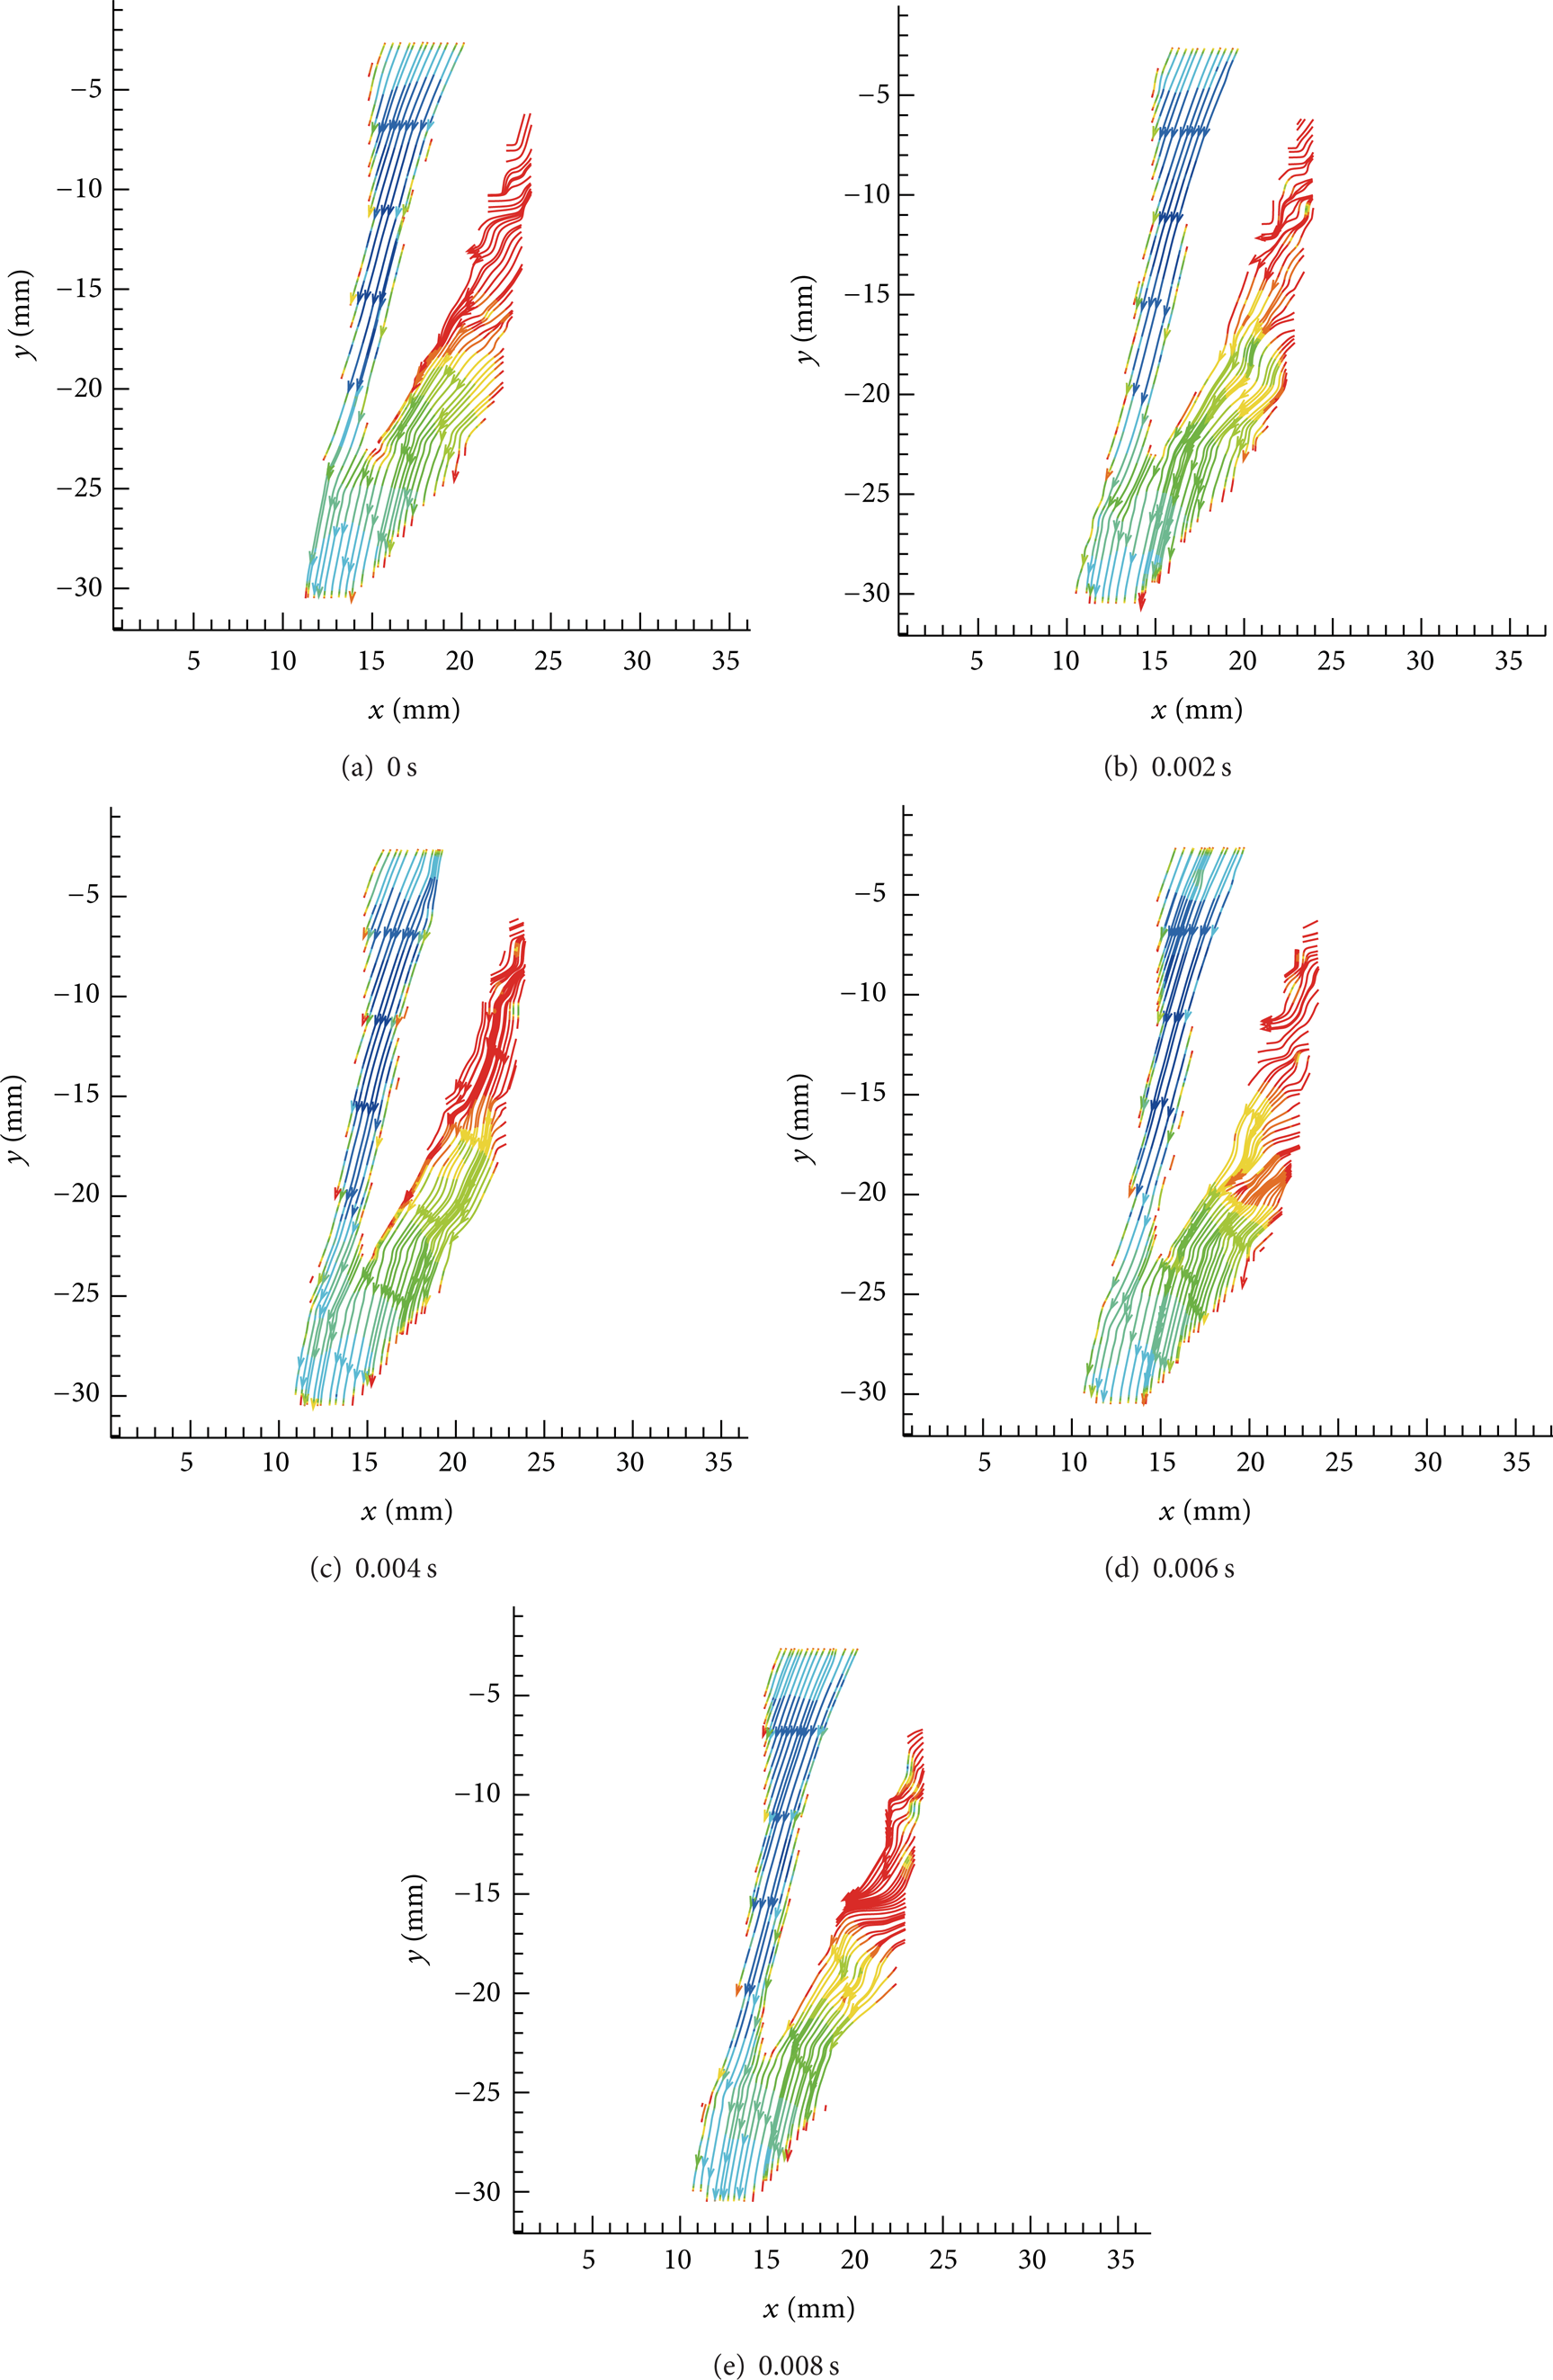
The flow field around the guide vanes.
3.2. Channel Vortex Nearby Runner Inlet
When a Francis turbine runs at some off-design conditions, cavitating flow in the runner will form a bunch of vortices called channel vortex. Since the accident of turbine system happened in Tarbela plant in 1992, the damage caused by channel vortex has drawn worldwide attention. Actually, the flow interaction between the guide vanes and the runner will propagate toward the upstream, that is, the area around the stay vanes, and also the pressure fluctuations of low-frequency draft tube vortex will propagate to the upstream, which forms complicated turbulent flow patterns in the runner. By means of endoscope in the hydraulic test rig, we were able to visualize such phenomenon.
From the synthetical characteristics of the Francis turbine (Figure 6), it can be seen that channel vortex and cavitating flow would appear at small opening of guide vanes (14 mm) as studied for the PIV test. Figure 10 shows the channel vortices evolution with time for n11 = 85 rpm. The channel vortex in the runner behaves in a periodic nature, which experiences three subprocesses, that is, onset, development, and disappearance. The channel vortex is generated in the middle of the runner passage. Its volume grows fast and then gradually moves toward the pressure side of blade inlet. When it approaches close to the pressure side of blade inlet, it will decompose into vesicular vortices separating from blade inlet. At last, the channel vortex gradually vanishes at the end of the period. The measured time of one evolution cycle of channel vortex is approximately 0.008's. The corresponding frequency is identical to that obtained in PIV test, which is 15 times as large as the rotating frequency of runner and also as the blade passing frequency. Now we can see that the dominant frequency of pressure fluctuation caused by the flow interaction between guide vanes and runner is equal to the blade passing frequency, indicating that the pressure at the runner inlet changes periodically according to the blade passing frequency. The variation of pressure at the runner inlet leads to the same periodic changing of the pressure in the runner, which causes evolution of the channel vortex.

The evolution of the channel vortex (n11 = 85 rpm).
3.3. Flow Separation at Blade Inlet of Suction Side
When the Francis turbine runs at off-design conditions due to power adjustment of hydraulic power plant, the angle of attack at the runner inlet will be changed accordingly, which may result in flow separation at the blade inlet. However, if the profile of blade is designed reasonably, the flow separation could be delayed. According to some test results, the flow separation at the suction side happens at flow conditions of high water head and low load, but the flow separation at the pressure side happens at the opposite conditions. If the blade profile is chosen ideally, the flow separation could be excluded from the normal operation conditions. Thus, the flow separation at the suction side should be paid more attention.
From the curve of the synthetical characteristics of a Francis turbine, it can be seen that flow separation at the suction side appears at n11 = 55 rpm. The evolutions of flow separation at the suction side of runner inlet are shown in Figure 11. The region of flow separation at the suction side of runner inlet is small and displays zonal distribution at the blade inlet. The flow separation lasts for a period shorter than that of channel vortex, which is about 0.005's from its onset till disappearance. This time corresponds to a frequency of 200 Hz, which is just the vane passing frequency. It can be concluded that the dominant frequency of flow separation at the suction side of blade inlet is equal to the vane passing frequency.

The evolution of flow separation at the runner inlet of suction side (n11 = 55 rpm).
The characteristics of flow separation at the suction side of blade inlet should be of high frequency. Since the distance between blade inlet and interaction area with guide vanes is quite small, it may cause the increase of pressure fluctuation of high frequency. Also the dominant frequency of pressure fluctuation nearby the runner inlet will superpose the dominant frequency caused by flow separation. It will amplify the amplitude of pressure fluctuation and then influence the stability of hydraulic turbine.
3.4. Draft Tube Vortex and Its Frequency
When the running parameters of a hydroturbine are deviated from the optimal working conditions, the rotating flow and vortex shedding out of the runner outlet will bring about pressure fluctuations and form periodic low-frequency pressure pulsations. The frequency of such pressure pulsations is generally a fraction of rotational frequency. When this frequency is close to the natural frequency of turbine unit or plant house, resonance can be produced, which causes violent vibrations of turbine unit or plant. The dynamic water load on the draft tube wall caused by draft tube vortex is very complex. It will lead to violent vibrations of tube wall as well under certain conditions.
Vortex rope in the draft tube has different shapes according to varying operating points. Figure 12 shows different draft tube vortex patterns at different operating points. The vortex ropes are in spiral shape when generated in the draft tube. When Francis turbine runs under the optimal point with small opening of guide vanes, no vortex ropes are generated. Increasing or reducing flow rate from the optimal point leads to the formation of spiral vortex rope, and the more deviation from the optimal point, the larger the volume of vortex rope. It can also be found that the draft tube vortex appears firstly under the runner cone and disappears before reaching to the elbow pipe. Draft tube vortex ropes could lead to hydraulic pressure pulsation in the draft tube, whose amplitude is small at optimal point but increases with the deviation from the optimal point due to the worsening stability of flow in the draft tube.

The varying shapes of vortex ropes at different rotating speeds.
Figures 13 and 14 show the evolution of spiral draft tube vortex rope with time at two different working conditions. It can be found that the evolution of vortex ropes presents a periodic nature. They rotate in the same direction as that of the runner at the inlet of draft tube. As shown in Figure 13, at n11 = 65 rpm, the rotary motion cycle of vortex rope is in 0.4's. The corresponding frequency is equivalent to 0.3 times the rotating frequency of runner. At n11 = 55 rpm as shown in Figure 14, the rotary motion cycle of vortex rope is in 0.3's. The corresponding frequency is equivalent to 0.4 times the rotating frequency of runner. It indicates that the rotary motion cycle of vortex rope presents a low-frequency characteristic under the tested opening of the guide vanes, and the rotary frequency varies with the operating points. The low-frequency characteristic caused by the vortex rope would lead to the increase of the amplitude of low-frequency pressure pulsation. For the whole turbine unit, the increase of low-frequency pressure pulsation amplitude can cause resonance and leads to fatigue failure of the unit.

The vortex rope evolution at n11 = 65 rpm.

The vortex rope evolution at F11 = 55 rpm.
4. Conclusions
This paper presents experimental investigations on the flow field around the guide vanes in a Francis model hydroturbine at certain operating conditions through PIV measurement and on the characteristics of channel vortex at the inlet of runner, flow separation at the suction of blade and vortex ropes in the draft tube. The flow phenomena and their evolution have been analyzed. The dominant frequency for each flow phenomenon should provide evidence for the stability research on large-scale Francis hydroturbine. The following concluding remarks are drawn from this study.
The periodic changing of flow over the suction side of guide vanes accordingly relates to the blade passing frequency. The pressure fluctuations around the guide vanes should also be the result of wake flow over the suction side of guide vanes encountering the blade inlet, which leads to the periodic variation of the wake.
The dominant frequency of channel vortex in the runner is equal to the blade passing frequency, so that the pressure fluctuations near the runner inlet have the same dominant frequency as the blade passing frequency.
The patterns of vortex ropes in the draft tube vary with the operating conditions. The rotating motions of vortex ropes have low-frequency nature, and at the certain opening of guide vanes, their frequencies are 0.3–0.4 times the rotating frequency of runner.
Conflict of Interests
The authors declare that there is no conflict of interests regarding the publication of this paper.
Footnotes
Acknowledgments
This research is supported by National Key Technology R&D Program (no. 2011BAF03B01), Heilongjiang Scientific Funds for Distinguished Young Scientist (no. JC201115), and National Natural Science Foundation of China (no. 51076077).