
Abstract
Modern agribusiness is becoming increasingly reliant on computer-based systems which was formerly performed by humans. One such technological innovation is the embedded system-based sensor array module such as flex sensor, temperature sensor, and pH sensor that have been used to monitor the turmeric finger growth characteristics. The experimental work has been tested with five different nodes and the average flex sensor resistance changes in five nodes are calculated. Among the five nodes, nodes II and V were diseased. Purposely node II was left as such and node V was treated with Pseudomonas and viride to restrict the Rhizome rot disease attack. As a result, after cultivation, it was found that the Rhizome rot disease attack on node V is comparatively lesser than node II. The greatest advantage of this method is that it helps the farmers to detect the Rhizome rot disease and also prevent it an early stage by monitoring the growth of the turmeric fingers when it is under the soil.
1. Introduction
The world population is having a rapid growth and it is demanding a fast and strong growth in the agricultural field. In the current era agriculture is gaining its own importance and it is integrated with new technology like computer-integrated management and advanced control systems [1]. Modern agribusiness is becoming increasingly reliant on computer-based systems, automation, and robotics that are taking over many of the tedious tasks formerly performed by humans, with superior performance in most cases [2]. The increasing complexity of agricultural systems force the production of agricultural machines integrating mechanical, electronic, computer, and information systems [3]. There is a need for the new methodologies to meet the increasing complexity of agricultural systems and this leads to the emergence of precision agriculture which aims to improve the efficiency of operation of agricultural enterprises and also the quality and consistency of products by compensating the vagueness and uncertainty of the environment [4]. Though sensor networks have challenges such as the fact that energy is a scarce [5] and usually nonrenewable resource, recent advances in low power VLSI, embedded computation, communication hardware, and in general the convergence of computing and communications are making this emerging technology a reality [6]. Advances in nanotechnology and microelectromechanical systems (MEMS) help in the development of networks of tiny distributed sensors and actuators [6]. Kim et al. [7] used a closed-loop irrigation system and determined irrigation amount based on distributed soil water measurements. Xijun et al. [2] explored designs for smart soil moisture sensors and sprinkler valve controllers to implement plug-and-play technology and proposed architectures of distributed sensor networks for site-specific irrigation automation. Vieira et al. [8] simulate the performance of sensor node running with low power operation in greenhouse environment to the impact of crop's growth when obstacle exists in internode's communication point. ZigBee, Bluetooth, and WiFi are the existing wireless sensor networks [9, 10]. All these are operated within the industrial specific and medical (ISM) band of 2.4 GHz which provides license-free operations, huge spectrum allocation, and worldwide compatibility [6]. The wireless sensor network technologies are highly applicable for modern precision agriculture monitoring [9, 11]. The advantages of wireless sensor network in agriculture are high performance, increase in the production efficiency while decreasing cost, and low-power consumption and collected distributed data [11].
Turmeric also known as “Indian saffron” is a plant of 4000 years with a long history of medicinal use. It is also an important constituent in drug, cosmetic, and dye industries. The essential nutrients of turmeric are nitrogen, phosphorous, and potassium and the secondary nutrients are calcium, magnesium, and sulphur. A sensor array is used to estimate the root characteristics which are composed of flex sensor, temperature sensor, and pH sensor. In the case of turmeric plant, its fingers are affected by fungus at the 6th month of growth. This Rhizome rot disease is unpredictable as it is under the soil and it is noticed only if it spreads out as “leaf spot” [12]. Since this ruins the whole plant, flex sensor is chosen to monitor the finger growth. And hence turmeric finger Rhizome rot disease can be identified at the early stage and required action (applying Pseudomonas and viride) to be taken [13, 14]. Pseudomonas and viride are the best natural biopesticides [13] for many plant diseases. This paper focuses on how flex sensors act as an effective monitoring agent to check the turmeric finger growth characteristics using embedded system. The great advantage of this method is that it helps in the early detection of Rhizome rot disease in the turmeric plant. LM35 sensor is used to measure the temperature [15] and PHE-45P sensor is used to measure the pH range. The data collected from the sensor array are transmitted wirelessly using ZigBee module [16] and is monitored using the LCD display [17]. The ZigBee module is used for wireless transmission which is mainly chosen because of its low cost and low power features [18]. ZigBee module operates within 2.4 GHz frequency band with an operating voltage of about 3.3 V and covers a distance of 25 meters [18, 19].
2. Methodology
The methodology diagram Figure 1 illustrates that three different values are collected by flex sensor, temperature sensor, and pH sensor. A module with five designed nodes has been implemented in the field at random to take readings from five nodes. The setup is kept at random in order to predict whether the turmeric finger is affected by disease. Outputs from temperature and pH sensor are given to the signal conditioning unit in order to convert the obtained analog output to digital. Flex sensor output is given to the bridge circuit to convert the obtained resistance value to a digital signal. The digital signals are then given to the microcontroller which is then given to the ZigBee transmitter. Data from ZigBee transmitter are sent wirelessly to the receiver. The receiver after receiving the signal sends it to another microcontroller which is then sent to the ZigBee receiver and the data are displayed through the LCD display. To test this experimental setup 0.25 hectare was chosen. The microcontroller is programmed in order to store values taken three times with certain time intervals—9.00 a.m., 12.30 p.m., and 5.00 p.m. It is supplied with a real time clock and readings for about 3 days can be stored.

Methodology diagram.
Since the flex sensor is more flexible [20], it is chosen so as to monitor the growth of the turmeric finger. According to the force exerted by the finger, the flex sensor bends accordingly to which the resistance value changes. Arrays of five flex sensors are placed around the plant while planting to monitor the finger growth. Sensors N1, N2, N3, and N4 are placed around the plant. Since the finger grows more downwards than laterally, N5 is kept under the tip of the plant which indicates a maximum growth rate compared to other sensors. The temperature sensor and pH sensor are used to measure the soil characteristics. Since the temperature and pH parameters vary during rainfall and when fertilizers are applied, it is essential to monitor the soil characteristics to enhance the plant growth. Out of three (flex sensor, temperature sensor, and pH sensor) measurements, flex sensor has been given much importance than the other two as this measurement acts as an effective method for detecting finger growth Rhizome rot disease in turmeric plants at an early stage.
To test the performance of the system (mainly on flex sensor), an artificial method of turmeric finger Rhizome rot disease was induced by stacking water for more than two days for the node II and node V.
3. Flex Sensor
Flex sensor as shown in Figure 2 is used to measure the growth rate of the turmeric finger. An array of five flex sensors is placed around the turmeric plant inside the soil. Four sensors are placed around the plant and the fifth sensor is placed right under the tip of the plant. The fifth sensor is placed under the tip of the plant since the finger growth will be more downwards than laterally. This sensor will first indicate the growth rate when compared to other sensors. The advantage of using flex sensor is that it bends and flexes physically with motion device which favors angle displacement measurement [20]. It has a wide range of applications—computer peripherals, virtual motion for gamming, medical devices, robotics, musical instruments, and physical therapy. The flex sensor has electrical characteristics of change in resistance of about 25 K Ohms, power rating of about 0.5 Watts, and a resistance tolerance of ±30%. Since it is flexible, its resistance varies according to its bend.
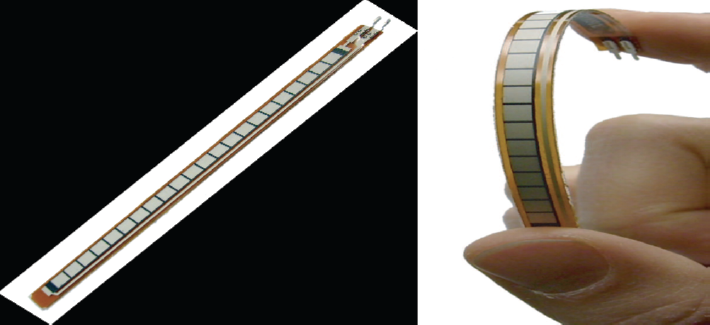
Flex sensor.
4. Temperature Sensor
The LM35 series used widely for remote application is a precision integrated circuit temperature sensor, whose output voltage is linearly proportional to the Celsius (centigrade) temperature [15]. LM35's control circuitry and interfacing to readout are made easy as it can be used either in single power supplies or with plus and minus supplies and also through low output impedance, linear output, and precise inherent calibration. It has very low self-heating, less than 0.1 c in still air as it draws only 60 microamp from its supply.
5. pH Sensor
PHE-45P pH sensor measures the pH of aqueous solutions in industrial and municipal process applications. PHE-45P process electrode is made of glass; the glass electrode must be wetted all times to ensure proper functionality. PHE-45P sensors are shipped with a fluid-filled cap over the electrode to enable immediate use. Electrodes should be dried and hydrated for 24 hours to restore full functionality. A high volume, dual junction salt bridge is utilized to maximize the in-service lifetime of the sensor. The annular junction provides a large surface area to minimize the chance of fouling.
An integral preamplifier is encapsulated in the body of the sensor. This creates a low impedance signal output which ensures stable readings in noisy environments and increases the maximum possible distance between sensor and transmitter to 3,000 feet (914 meters).
6. ZigBee Module
The ZigBee Module is a particular brand of ZigBee which is designed to meet IEEE 802.15.4 standards and support the unique needs of low-cost and low-power wireless sensor networks [21]. Since ZigBee module is readily available at low cost compared to ZigBee, it is chosen for remote applications [8]. The modules require minimal power and provide reliable delivery of data between devices [19]. The modules operate within the ISM 2.4 GHz frequency band and are pin-for-pin compatible with each other. Every RF data packet sent over the air contains a source address and destination address field in its header. The RF module conforms to the 802.15.4 specification and supports both short 16-bit addresses and long 64-bit addresses. ZigBee modules can be installed using antennas and cables constructed with standard connectors (Type-N, SMA, TNC, etc.). For installations not performed by a professional, nonstandard connectors (RPSMA, RPTNC, etc.) must be used.
7. Results and Discussion
A module has been designed with array sensors such as flex sensor, temperature sensor, and pH sensor which transmits data via the ZigBee module. Figures 3, 4, and 5 show the hardware and implementation.

Front view of the module.
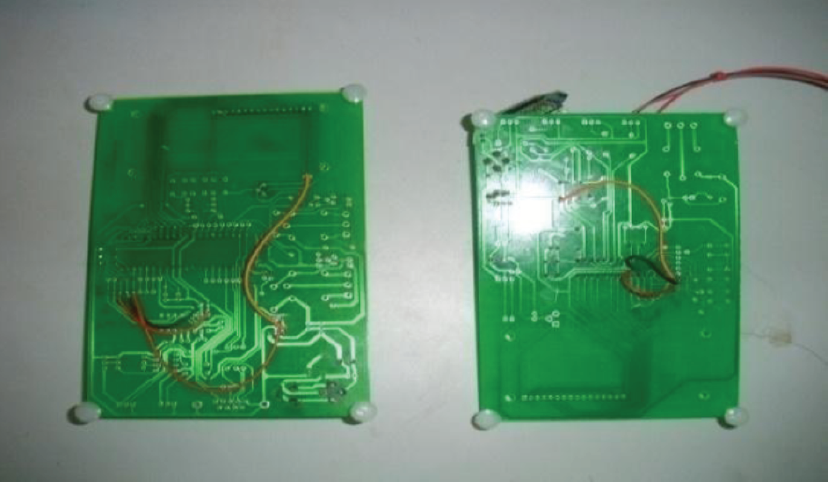
Back view of the module.

Designed module implemented in the field.
7.1. Soil pH Readings
Table 1 displays the pH readings taken periodically at regular intervals to monitor the moisture content of the soil during rainfall and while watering. These N1 through N5 represent five different nodes which were located at five different places.
pH readings.

Figure 6 graph shows the overall soil pH readings taken for five different sensor nodes. The inference was that during raining, the pH level gets increased and while applying fertilizer, pH level gets decreased. From Table 1 pH 8th and 11th readings, the set of pH measurement value gets increased more than the other readings which show heavy rainfall on those days. Water was supplied from bore well water and well water. During the last two months, there was a water scarcity in the test field. Farmer was in need to use more bore well water. The last five sets of reading show the increased pH value because of bore well water. This has been reflected in the crop as a yellow shade in leaves of the crop. Ultimately, chlorophyll content of the leaf gets decreased in larger amount. Chlorophyll, a green photosynthetic pigment that helps plants to get energy from sunlight, has a predominant role in increasing the crop yields. This fact had been discussed with Coimbatore Agricultural University and it suggested that water supply during high pH value (above 6.3) can be considerably reduced and after one supply of water (after getting high pH value) nitrogen (N) fertilizer should be used from 10 Kg to 25 Kg per hectare depending on the pH value to compensate the change in pH.

Graph for pH.
7.2. Soil Temperature Readings
Table 2 displays the temperature readings taken on daily basis to monitor the soil temperature. N1 through N5 represent five different nodes which were located at five different places.
Temperature readings.

Figure 7 graphs shows the soil temperature readings taken for five different sensor nodes. The inference from the measurement was low in temperature during rainy time. Being aware of the basic growing conditions, the turmeric crop becomes strong and vibrant depends on soil, water, and atmospheric temperature. As curcuma crop was cultivated normally in the months of May to June in India, the proposed system was implemented in the month of May. At that time temperature was very high and also that increased the soil temperature considerably. Nodes I and II were the supply of water during daytime (between 11 a.m. and 2 p.m.) and all other nodes were the supply of water during evening (between 5 p.m. and 7 p.m.). The leaf growth, root, and Rhizome biomass depend on the soil temperature. The leaf growth in the nodes III, IV, and V was high as compared to that of the other two nodes. From Table 2, the 20th and 21st readings directly reflected the high temperature because water was supplied at noon. Hence, in practice, it is suggested that supply of water in the initial stage (first water supply) as well as in further is to be done only in the early morning or in the late evening. Soil temperature has to be maintained between 17 and 18 degree Celsius to get high yield.

Graphs for temperature.
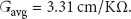
7.3. Flex Sensor Readings
In flex sensor N1 through N5 represents the individual node flex sensor array consisting of 5 sensors (5 flex sensors × 5 nodes = 25 sensors were used). Placement of the five individual flex sensors is shown in Figure 8.
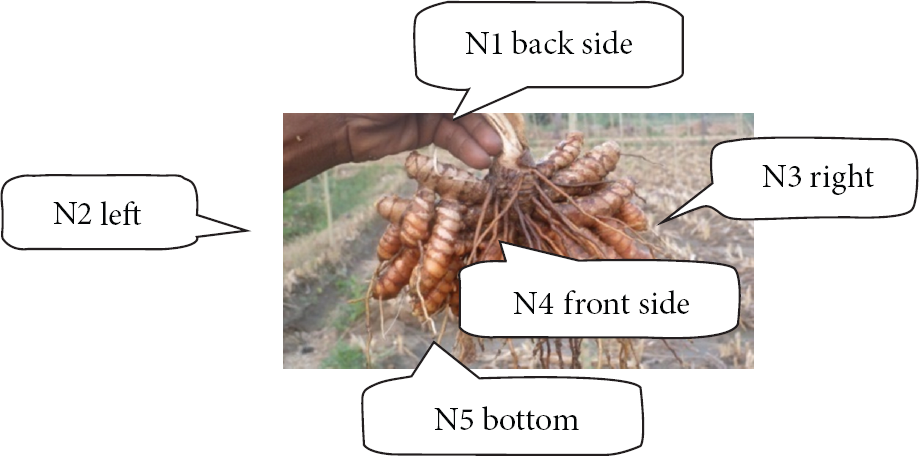
Placement of flex sensors.
7.3.1. Node I
Table 3 displays the flex sensor readings for node I taken periodically at regular intervals to monitor the periodic growth characteristics of the turmeric finger.
Flex sensor readings—node I.

Figure 9 graph shows the growth rate of the turmeric finger at node I.

Graph for flex sensor—node I.
Figure 10 shows the output image of the turmeric finger at node I.

Output image—node I.
7.3.2. Growth Result
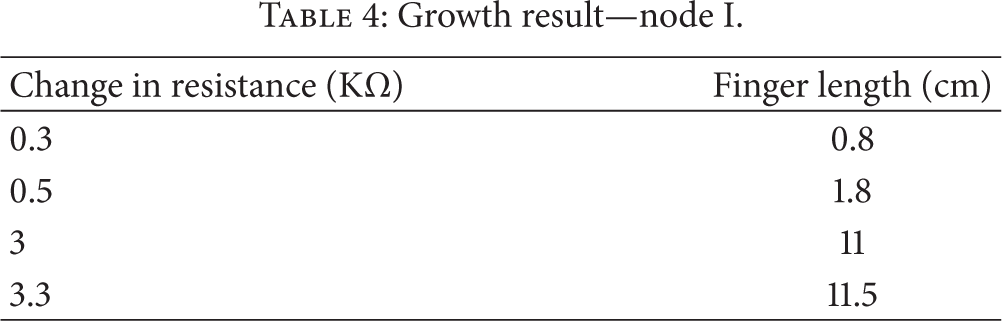
Table 4 displays the growth rate of the turmeric finger in cm according to the change in the resistance of the flex sensor for node I (after cultivation). This table has been established by taking the difference between minimum (initial) and maximum (final) resistance and finger length based on the actual physical measurement by cm scale with respect to the centre of turmeric at the end of the cultivation [22]. The same procedure was followed for all the finger growth measurements.
Growth result—node I.
Node average growth rate with respect to flex sensor resistance

where F is finger length in cm, R is change in resistance in ohm, and n is the number of distinguished readings during measurement. Consider

Figure 11 shows the relationship between the turmeric finger growths in cm and the change in resistance of the flex sensor for node I. The normal practice that prevails among the farmers even today is to measure the finger growth visually only after cultivation. Moreover, they never get chance to monitor the finger growth in between the cultivation. N1 and N4 have not much finger growth as compared to that of the other nodes. N5 has more growth than others. As turmeric is one of the row crops, the finger direction and the number of fingers depend on it [23]. In this node, an average flex sensor resistance with respect to the finger growth has been calculated as 3.55 cm/KΩ. From Table 3 readings, it is obvious that only during the last four months period the turmeric finger has full-fledged growth. Numbers of primary and secondary finger branches were 5 and 17, respectively. The maximum length of the finger was 11.5 cm and the minimum length was 0.8 cm and at last yield was 0.247 Kg after harvest. After steam and dry process, the polished turmeric yield was 0.052 Kg for sale. Node I has been kept in the middle of the row, space between the crops was minimum with that of standard distance [24], and so the yield was average. Naturally, there is no Rhizome rot disease attack in node I.

Graph for growth result—node I.
7.3.3. Node II
Table 5 displays the flex sensor readings for node II taken periodically at regular intervals to monitor the periodic growth characteristics of the turmeric finger.
Flex sensor readings—node II.

Figure 12 shows the growth rate of the turmeric finger at node II.

Graph for flex sensor—node II.
Figure 13 shows the output image of the turmeric finger at node II.
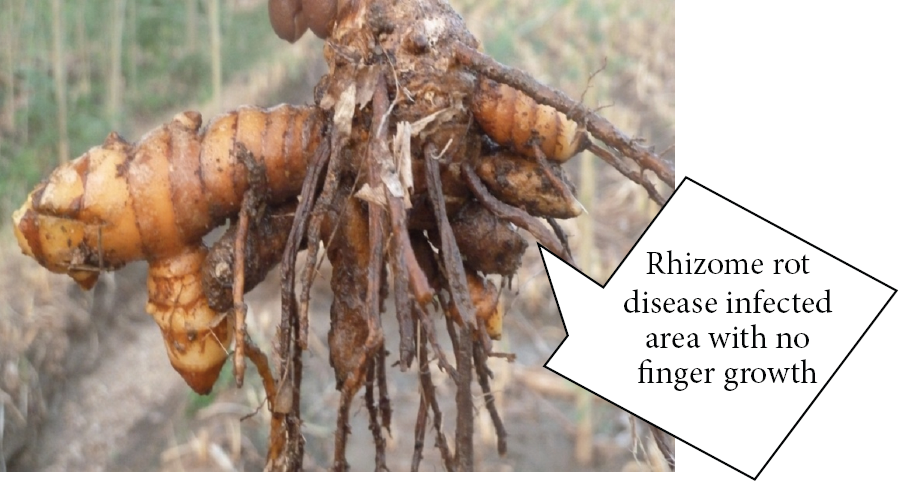
Output image—node II.
7.3.4. Growth Result
Table 6 displays the growth rate of the turmeric finger in cm according to the change in the resistance of the flex sensor for node II.
Growth result—node II.

Figure 14 graph shows the relationship between the turmeric finger growths in cm to the change in the resistance of the flex sensor for node II.

Graph for growth result—node II.
Node average growth rate with respect to flex sensor resistance
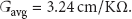
In this node an average flex sensor resistance with respect to finger growth has been calculated as 3.24 cm/KΩ. From Table 5, the turmeric finger has grown only in the last four months. Numbers of primary and secondary finger branches were 7 and 1, respectively. The maximum length of the finger was 1.6 cm and the minimum length was 0.36 cm and at last yield was 0.075 Kg after harvest. After steam and dry process, the polished turmeric yield was 0.015 Kg for sale. Node II has been kept in the middle of the row, distance between the crops was optimum [24], and an artificial method of turmeric finger Rhizome rot disease was induced by stacking water for more than two days. Hence the yield was very low. The natural pesticides like Pseudomonas and viride were not intentionally applied on the affected turmeric crop (node II) for testing the Rhizome rot disease.
7.3.5. Node III
Table 7 displays the flex sensor readings for node III taken periodically at regular intervals to monitor the periodic growth characteristics of the turmeric finger.
Flex sensor readings—node III.
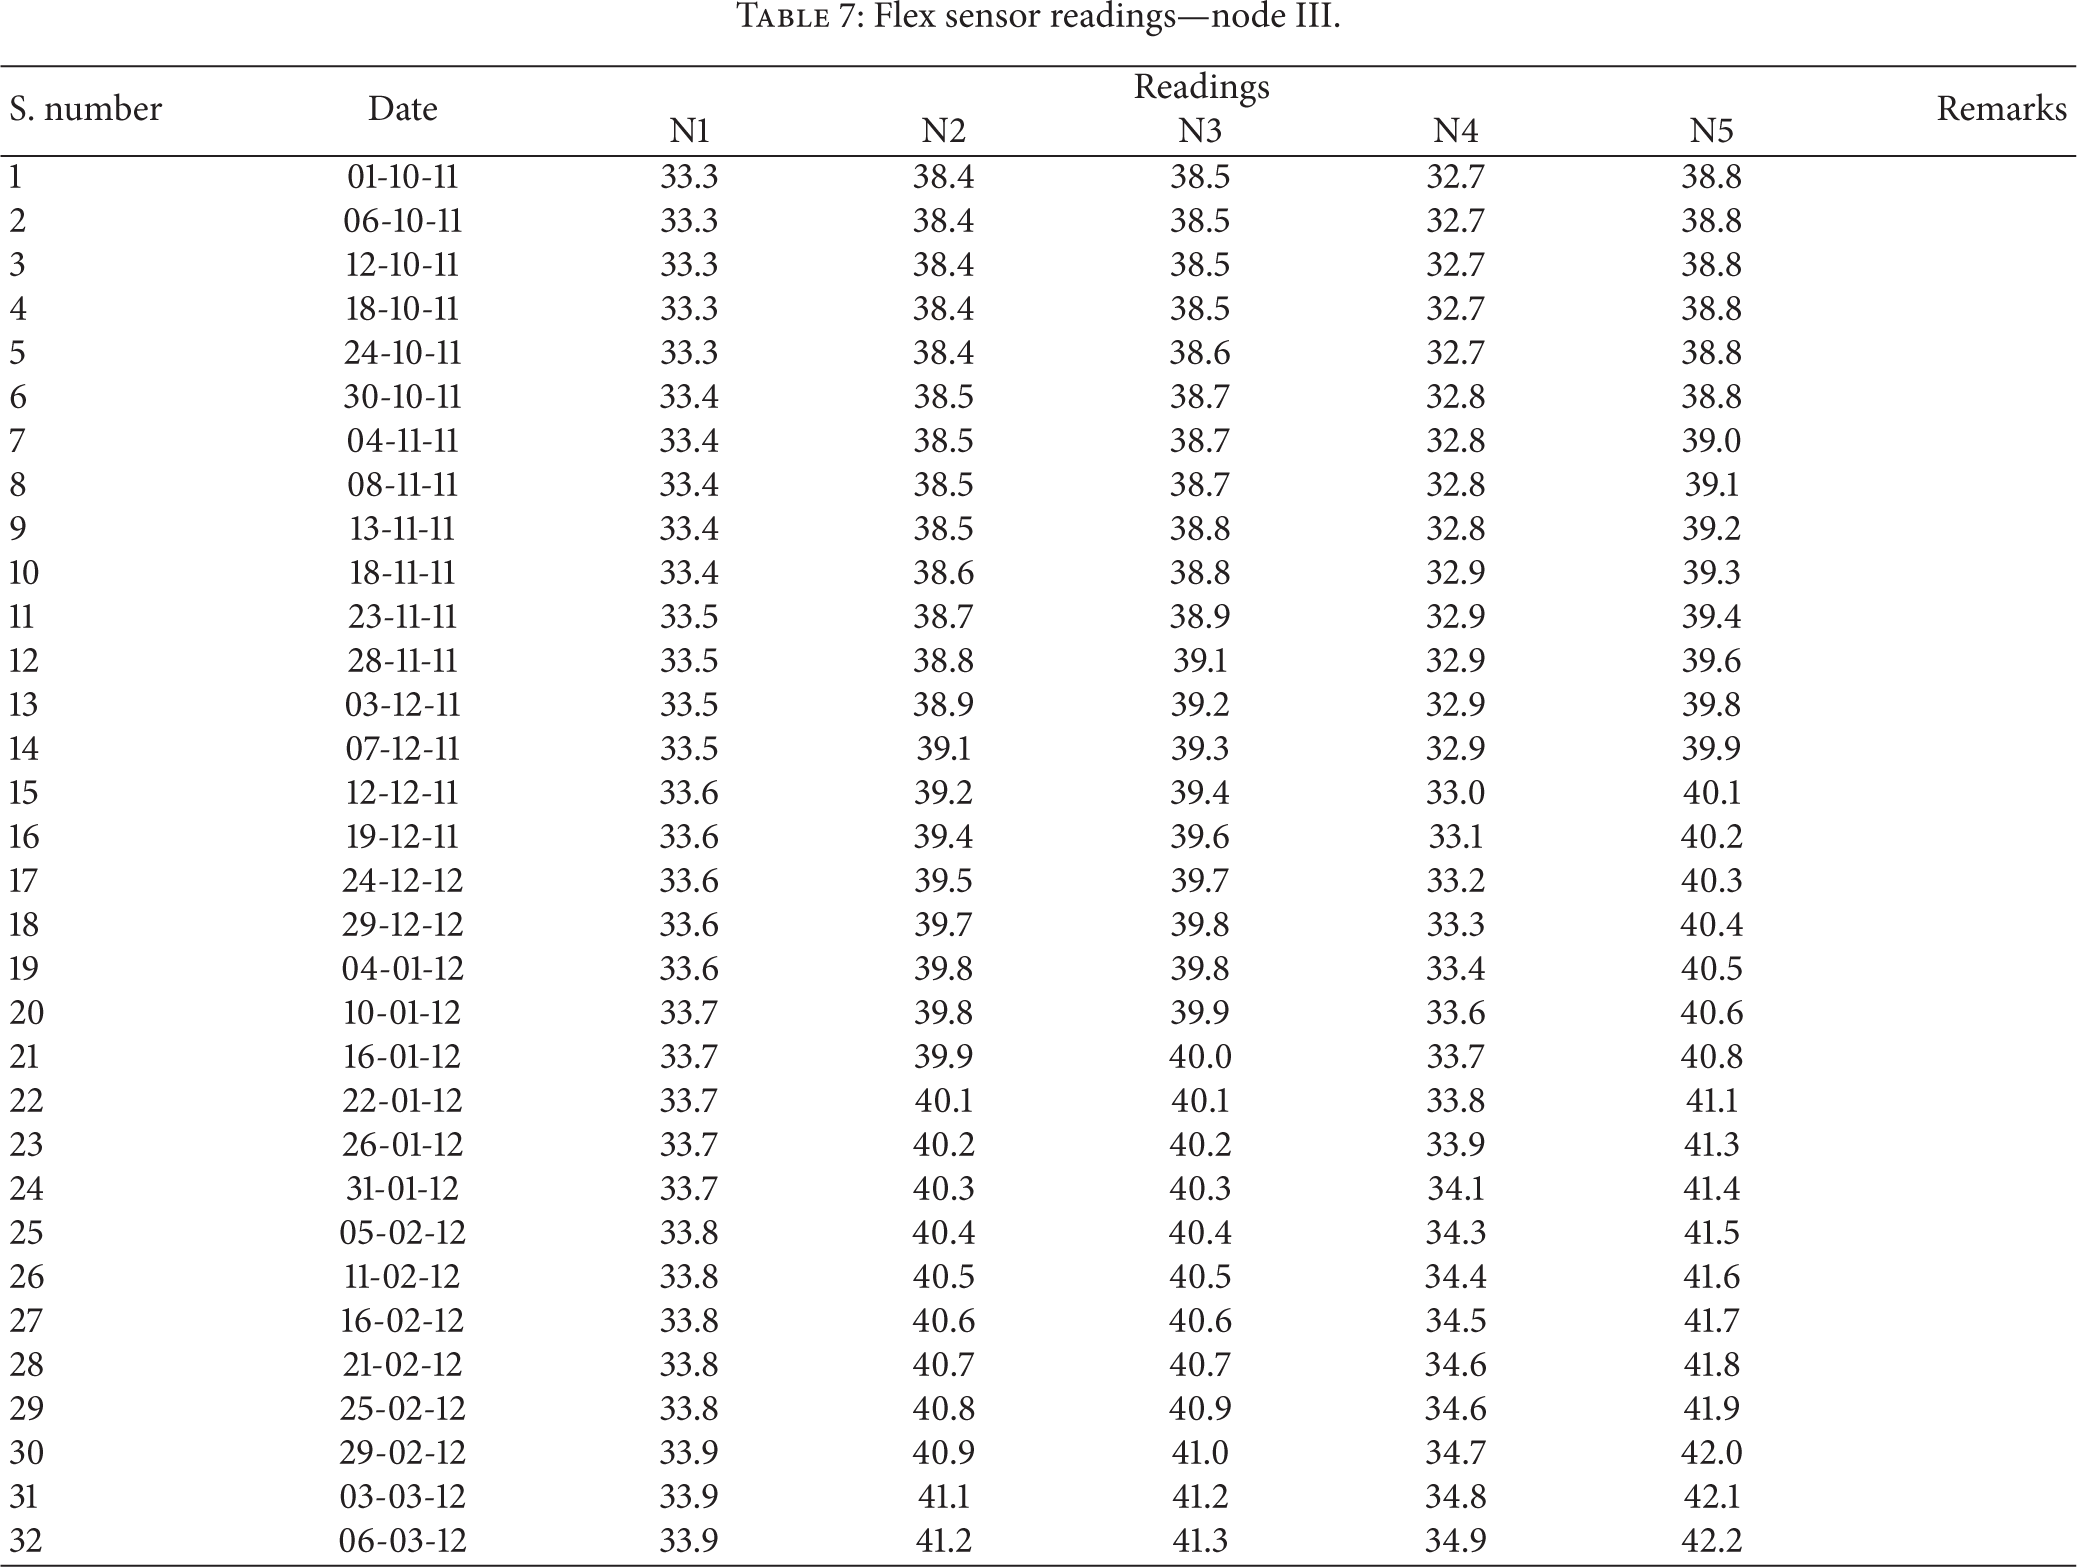
Figure 15 graph shows the growth rate of the turmeric finger at node III.
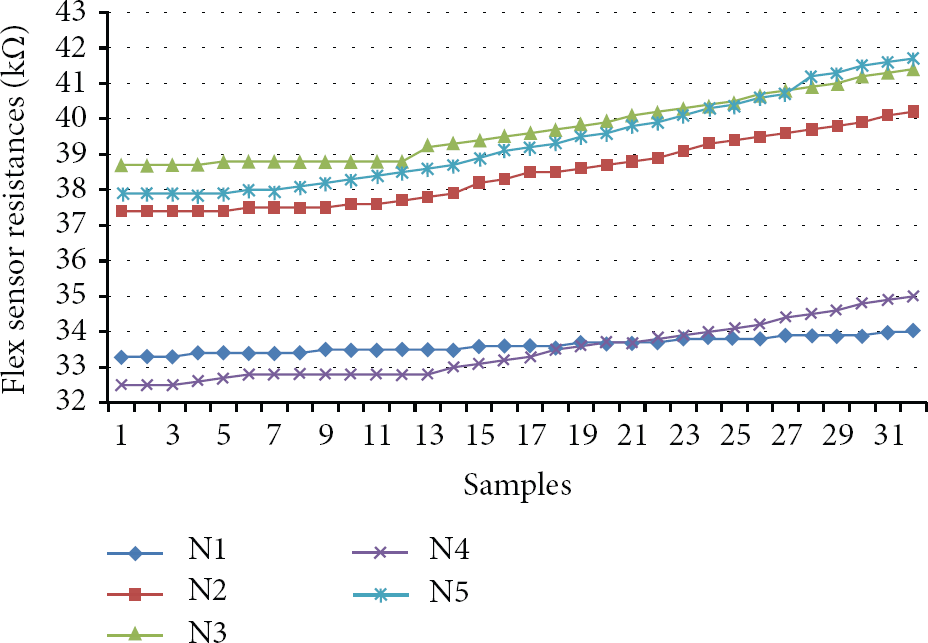
Graph for flex sensor—node III.
Figure 16 shows the output image of the turmeric finger at node III.

Output image—node III.
7.3.6. Growth Result
Table 8 displays the growth rate of the turmeric finger in cm according to the change in the resistance of the flex sensor for node III.
Growth result—node III.
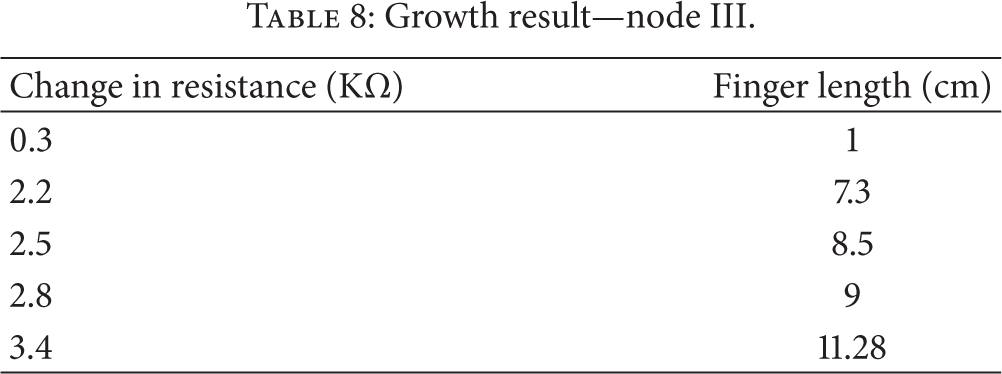
Figure 17 graph shows the relationship between the turmeric finger growths in cm and the change in the resistance of the flex sensor for node III. Node average growth rate with respect to flex sensor resistance
In this node an average flex sensor resistance with respect to finger growth has been calculated as 3.31 cm/KΩ. From Table 7, the turmeric finger has grown only in the last four months. Numbers of primary and secondary finger branches were 9 and 13, respectively. The maximum length of the finger was 11.28 cm and the minimum length was 1 cm and at last yield was 0.540 Kg after harvest. After steam and dry process, the polished turmeric yield was 0.102 Kg for sale. Node III has been kept in the middle of the row, space between the crops was optimum [24], and so the yield was average. Naturally, there is no Rhizome rot disease attack in the node III.

Graph for growth result—node III.
7.3.7. Node IV
Table 9 displays the Flex sensor readings for node IV taken periodically at regular intervals to monitor the periodic growth characteristics of the turmeric finger.
Flex sensor readings—node IV.

Figure 18 shows the growth rate of the turmeric finger at node IV.
Graph for flex sensor—node IV.
Figure 19 shows the output image of the turmeric finger at node IV.

Output image—node IV.
7.3.8. Growth Result
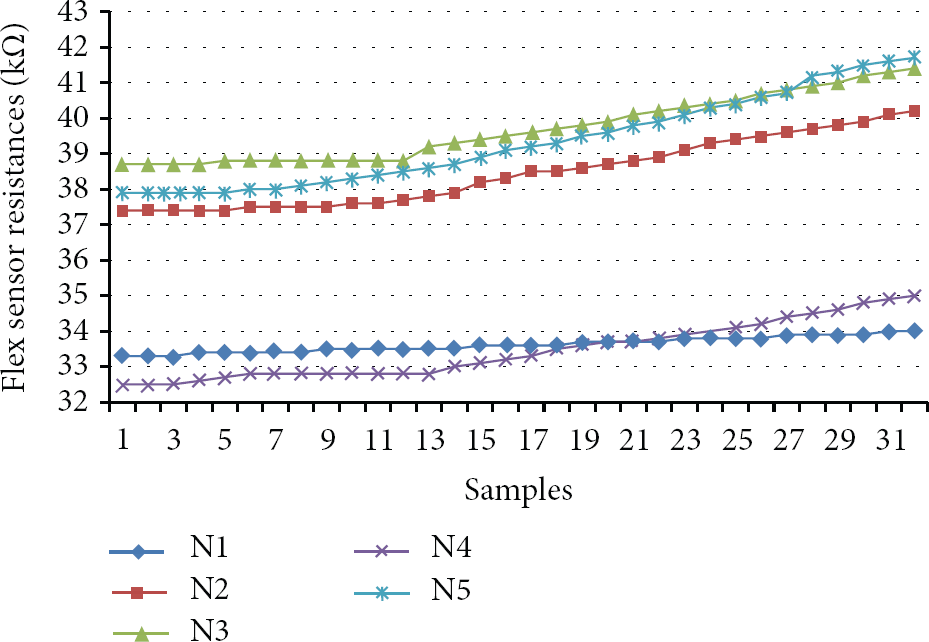
Table 10 displays the growth rate of the turmeric finger in cm according to the change in the resistance of the flex sensor for node IV.
Growth result—node IV.
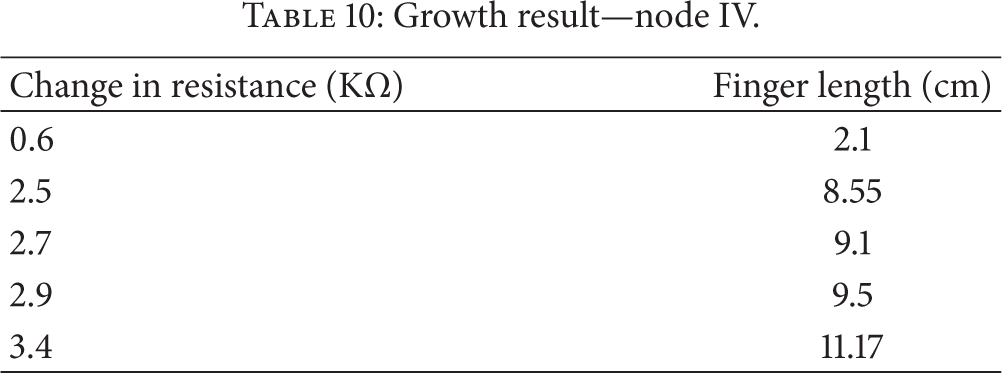
Figure 20 shows the relationship between the turmeric finger growth in cm and the change in resistance of the flex sensor for node IV. Node average growth rate with respect to flex sensor resistance
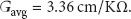
In this node an average flex sensor resistance with respect to finger growth has been calculated as 3.36 cm/KΩ. From Table 9, the turmeric finger has grown only in the last four months. Numbers of primary and secondary finger branches were 13 and 19, respectively. The maximum length of the finger was 11.17 cm and the minimum length was 2.1 cm and at last yield was 0.862 Kg after harvest. After steam and dry process, the polished turmeric yield was 0.162 Kg for sale. Node IV has been kept in the middle of the row, space between the crops was optimum [24], and so the yield was good. Naturally, there is no Rhizome rot disease attack in the node IV.
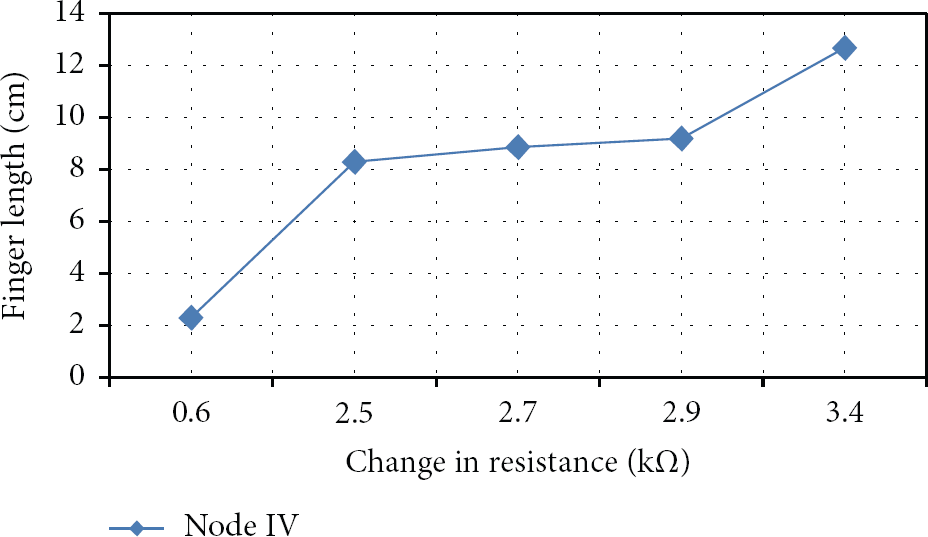
Graph for growth result—node IV.
7.3.9. Node V
Table 11 displays the flex sensor readings for node V taken periodically at regular intervals to monitor the periodic growth characteristics of the turmeric finger.
Flex sensor readings—node V.
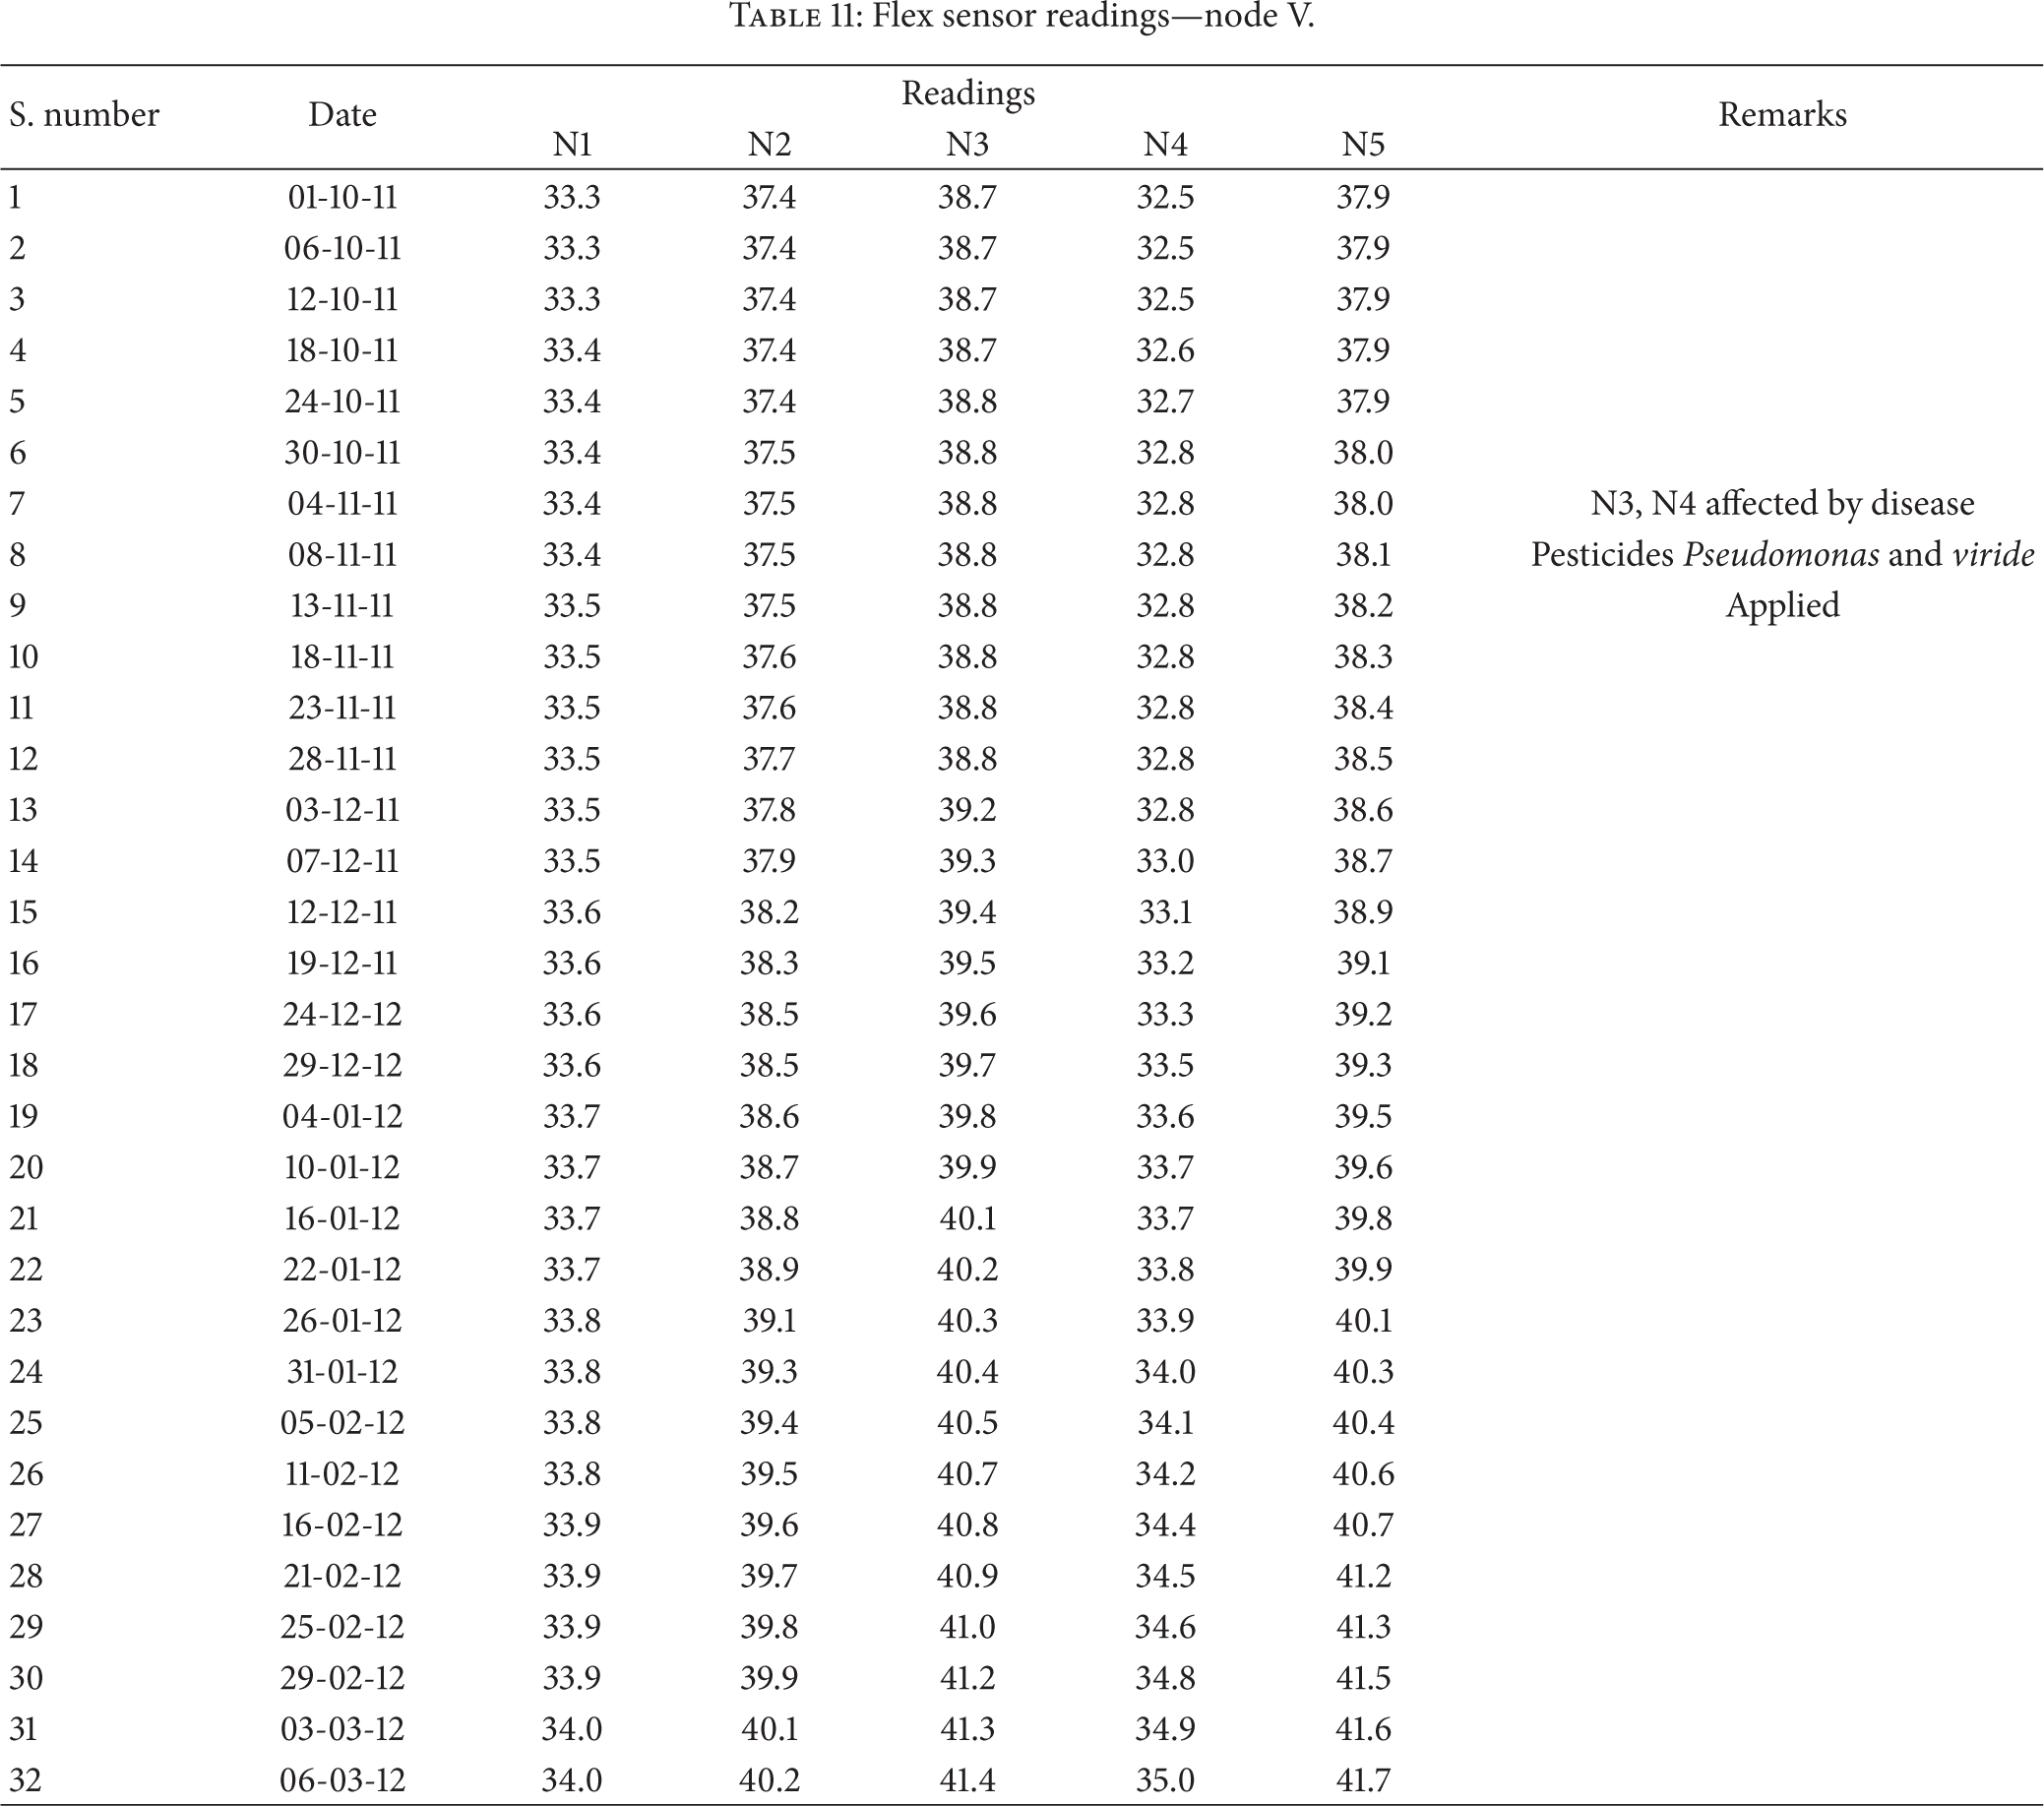
Figure 21 shows the growth rate of the turmeric finger at node V.

Graph for flex sensor—node V.
Figure 22 shows the output image of the turmeric finger at node V.

Output image—node V
7.3.10. Growth Result
Table 12 displays the growth rate of the turmeric finger in cm according to the change in resistance of the flex sensor for node V.
Growth result—node V.

Figure 23 graph shows the relationship between the turmeric finger growths in cm and the change in the resistance of the flex sensor for Node V. Node average growth rate with respect to flex sensor resistance

In this node an average flex sensor resistance with respect to finger growth has been calculated as 3.31 cm/KΩ. From Table 11, the turmeric finger has grown only in the last four months. Numbers of primary and secondary finger branches were 15 and 21, respectively. The maximum length of the finger was 12.7 cm and the minimum length was 2.3 cm and at last yield was 1.175 Kg after harvest. After steam and dry process, the polished turmeric yield was 0.237 Kg for sale. Node V has been kept nearby the bund, space between the crops was optimum [24], and an artificial method of turmeric finger Rhizome rot disease was induced by stacking water for more than two days. The natural pesticides like Pseudomonas and viride were applied on the affected turmeric crop (node V) for testing the Rhizome rot disease. Initially, it was found that there was growth in all nodes (N1, N2, N3, N4, and N5 of node 5) and at the middle (readings 6 to 12 of nodes III and IV) there were no improvements in the growth. Thereby, it was identified that the aforementioned nodes were attacked by Rhizome rot disease whereas after identifying the Rhizome rot disease and applying natural pesticides (Pseudomonas and viride) an improvement on those nodes resulted. The yield was more as compared to that of the node II which was affected and not treated for Rhizome rot disease.

Graph for growth result—node V.
Application of nitrogen (N) and potash (K2O), along with micronutrients such as boron (B) and Zinc (Zn) plays prevital role in growth and yield [25]. Thereby monitoring the finger growth and applying the fertilizer periodically, farmers can get high yield in terms of weight and quality of the turmeric with high density which gets a hold of higher market price.
8. Conclusion
Today technology occupies an integral position in the agricultural field. Agriculture is considered as the backbone of India which enhances the country's economy by increasing the yield. So the integration of computer technology with agricultural sector is the need of the hour. Here, to monitor the turmeric finger growth characteristics using embedded system, a sensor array module with array of sensors such as flex sensor, temperature sensor, and pH sensor was used. ZigBee module has been used for transmitting data wirelessly and the overall growth rate has been easily estimated by monitoring the graph plotted on the daily analysis.
The experimental work had been carried out with five different nodes and the average flex sensor resistance changes in five nodes were calculated. An average of 3.5 cm/KΩ had been obtained. Among the five nodes, nodes II and V were diseased. Purposely node II was left as such and node V was treated with pseudomonas and viride to restrict the Rhizome rot disease attack. As a result, after cultivation, it was found that the Rhizome rot disease attack on node V was comparatively lesser than node II. The greatest advantage of this method is that it helps in the early detection of the Rhizome rot disease and monitoring the growth of the turmeric fingers when it is under the earth. Implementing this concept can considerably help farmers to estimate the final outcome by screening the growth rate and taking preventive measures at the early stage.
Footnotes
Conflict of Interests
The authors declare that there is no conflict of interests regarding the publication of this paper.