
Abstract
Background. Single ventricle disease is treated by Glenn surgery. It is generally accompanied by stenosis on a pulmonary artery or its branches, which has great effect on hemodynamics. This study investigated the hemodynamic influence of different pulmonary stenosis degree in Glenn procedure. Materials. Four three-dimensional Glenn models with different left pulmonary artery stenosis rates as, respectively, 0% (model 1), 25% (model 2), 50% (model 3), and 75% (model 4) by the diameter were generated. Method. Geometric multiscale analysis method was used in the numerical simulations by coupling the lumped parameter model (LPM) and three-dimensional model. Results. During one cardiac cycle, the flow ratio between left pulmonary artery and superior vena cava was about 0.49 for models 1, 2, and 3, while the ratio decreased to 0.34 for model 4. On the other hand, hemodynamics parameters like power loss and oscillation shear index show complications of the stenosis to the postoperative development. Conclusion. When the stenosis rate is above 75%, it is suggested to treat stenosis before Glenn procedure, while when the stenosis rate is below 50%, there is no necessity to pay attention to it due to the little effect it makes.
1. Introduction
Hypoplastic left heart syndrome (HLHS) is a kind of complex cyanotic congenital heart defect, which is characterized by hypoplasia of left ventricle, the ascending aorta, or aortic arch and is combined with aortic or mitral stenosis or atresia. Of all congenital heart diseases, HLHS accounts for 4% to 9%, and it occurs in one of 4344 live births or an estimated total of 960 live births every year in the United States [1]. The palliative surgery for HLHS can be conducted as three procedures: Norwood procedure, Glenn procedure, and Fontan procedure. In fact, patients with HLHS are always accompanied with other congenital cardiovascular defects; among which, pulmonary artery stenosis is the most common that makes it difficult for blood to reach the lungs to pick up oxygen, and it can worsen the conditions of patients with HLHS. For patients with stenosis of unilateral pulmonary artery before Glenn procedure, many factors should be considered, such as high risk complications and long term effectiveness.
The Glenn procedure is the foundation to conduct the total cava-pulmonary connection (TCPC) procedure [2, 3]. It is performed at three to six months of age. It connects the superior vena cava to the right pulmonary artery [4]. In the Glenn operation, the superior vena cava is ligated from the heart and connected to the pulmonary artery. Then, the venous blood from the upper half of the body flows directly into the pulmonary circulation without mixing with oxygenated blood. Meanwhile, the Blalock-Taussig or Sano shunt made in the Norwood procedure is taken down. In the right ventricle, there is still venous blood mixing from the lower half of the body, leading to some degree of oxygen desaturation.
For patients with HLHS accompanied with pulmonary stenosis, the influence of the stenosis on blood flow is very significant. It can cause unbalance of lung perfusion and lead to hypoplasia of pulmonary artery. Some hemodynamic parameters such as wall shear stress (WSS), power loss, and oscillation shear index (OSI) can be obtained via numerical simulation, which are related to certain vascular disease.
Recent advances in medical imaging, computerized image processing, and computational fluid dynamics (CFD) now make it possible to computationally reconstruct the time-varying, three-dimensional (3D) blood flow patterns in anatomically realistic models. This method has been widely used in analyzing blood flow in vessels [5–8]. While the hemodynamics simulations of single 3D model process without approximate physical boundary conditions and without considering the entire blood circulation system, the implementation of elaborate closed-loop lumped parameter model (LPM) of the entire circulatory system as boundary conditions for CFD simulations can provide valuable global dynamic information. The vessels not included in the 3D domain are modeled as a linear passive model of the human systemic arterial tree including resistor, capacitor, inductor, and diode elements [9]. Geometric multiscale method has been applied to analyze human hemodynamics [10–12].
This study focused on the patients with HLHS and unilateral pulmonary artery stenosis after Glenn procedure to study the influence of the stenosis rate on hemodynamics using geometric multiscale analysis method. With near-physiological conditions generated by LPM, the hemodynamics simulations of different left pulmonary artery stenosis in Glenn surgery were made to anticipate and evaluate the postoperative results so as to provide some suggestions of clinical surgery planning. This study talked about complications of different pulmonary stenosis rate to patients after Glenn procedure.
2. Methods
2.1. 3D Models and Grids
In this study, a series of MRI images obtained from a patient with 50% stenosis by diameter at the left pulmonary artery branch was utilized to establish a geometrical model for CFD. According to the original 3D model, other three models were generated with the FreeForm Modeling Plus by expanding or narrowing the stenosis section at the same location with rates of 0, 25%, and 75% by the diameter, respectively (Figure 1). The area of the superior vena cava section was approximately 2.24 cm2 for each model.

A series of 3D modified models with different stenosis rate at the left pulmonary (model 1: no stenosis, model 2: stenosis rate 25%, model 3: stenosis rate 50%, and model 4: stenosis rate 75%). The PA is approximated by uniform circular segmentations and the branches of the pulmonary were cut off at the sections of the roots.
A high-quality grid is a significant factor determining the quality of the results as well as the computation time. In order to optimize the quality of mesh, fine grids were generated on the inlet and outlet boundaries and the bi- and trifurcation [13]. The mesh sensitivity analysis for model 1 was performed, as shown in Table 1. Four tests were carried out and WSS on inlet was calculated. It can be seen that percentage difference between Test 3 and Test 4 reduced to 0.1568% compared to that of other adjacent tests. Based on the principle of the acceptable error less than 1%, the numbers of grids generated for computation were 308340, 311572, 307237, and 297237 for the four models, respectively.
Mesh sensitivity analysis of model 1.

2.2. Lumped Parameters Model
In this study, a multiscale model consists of a 3D model and a LPM, except for the 3D anatomical model on which the hemodynamic parameters were obtained; other sections of the circulation system can be described as LPM, as Figure 2 shows. Thus, a hydraulic network that mathematically describes an entire circulatory system was used to predict local dynamics within the Glenn circulation. Global variables including total pressure and average flow at SVC, pulmonary vein, ascending aorta, and descending aorta can be computed [14]. The four 3D meshed models were coupled in the multiscale model and calculated without changing the LPM section. For the complex entire blood circulation system, it can be divided into a few blocks to describe human anatomical module. The LPM of the circulation was made of six blocks in this study, the left and right lung, the single ventricle heart, the ascending aorta, the lower limb vein, and the upper limb vein.
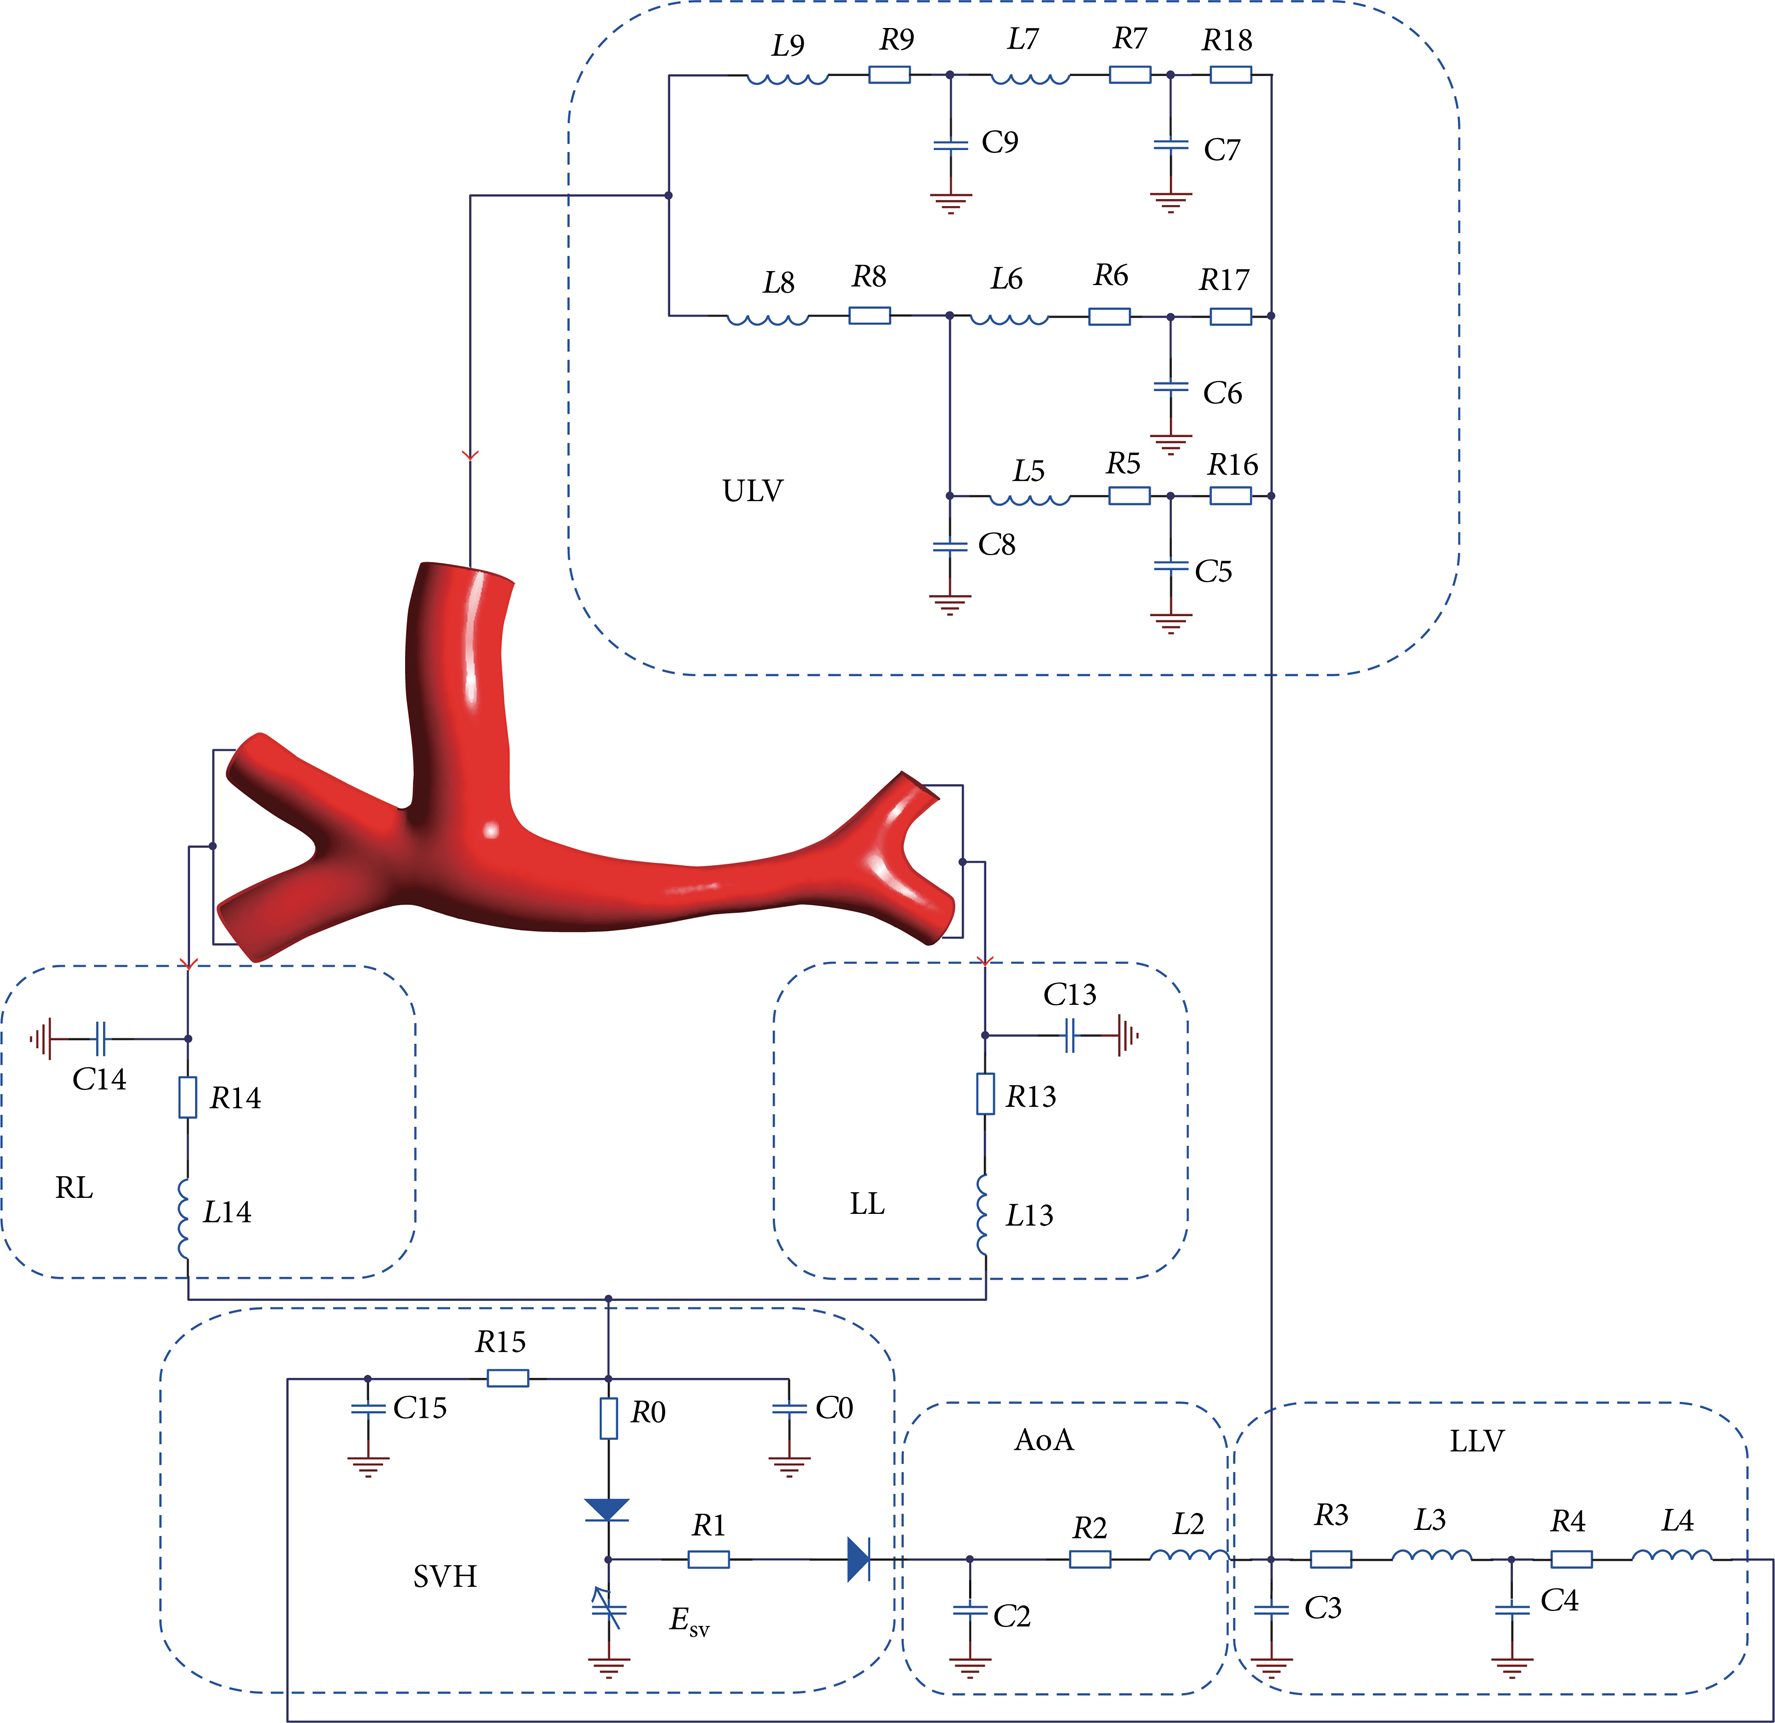
LPM coupled with the Glenn anatomy. This multiscale model contains blocks for the left lung (LL), right lung (RL), single ventricle heart (SVH), the ascending aorta (AoA), lower limb vein (LLV), and upper limb vein (ULV), as shown in the picture. The SVH block consists of left atrium (LA), right atrium (RA), and single ventricle (SV). Esv represents elastance of single ventricle.
The LPM was described with several Windkessel models consisting of resistors, inductors, and capacitors, which represent the viscous, inertia, and the compliance of the vessel [15, 16]. The diodes in the circuit were used to simulate the cardiac valves. Mass and momentum conservation laws for each compartment were expressed as
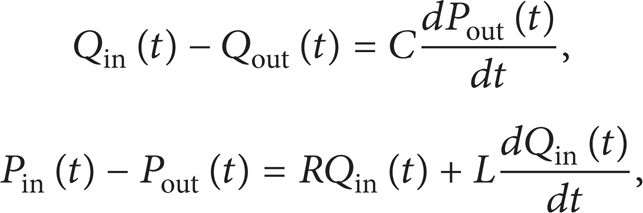
where Qin(t), Pin(t) and Qout(t), Pout(t) indicate the instantaneous volumetric flow rate and pressure at the compartment inlet and outlet sections, respectively [12].
The solutions of the pressure and flow of the vessel in regions of interest (ROI) turned into solving the differential equations with state variables as follows:

where
In the block of single ventricle, in order to represent the rhythmic contraction of the single ventricle, the relation function between pressure and volume was described as

where E(t) [17–19] meant elastance function changing by time, with units mmHg/mL. SvP(t), and SvV(t) representing ventricle pressure and volume of the ventricle, respectively. V0 was the reference volume. To compute elastance E(t), the following function was used:

where E max and E min were related with ventricle pressure and volume in end systole and diastasis, respectively. In this study, E max = 2.5118 and E min = 0.0458. These values were kept constant during the subsequent calculations. E n (t n ) [20] was the elastance varying with time. Consider

where
Based on our previous study [22], the values of the parameters of the LPM were determined and were shown in Table 2.
Values of parameters in LPM.

2.3. Multiscale Models and Calculations
The coupling of 0D model and 3D model was realized by applying boundary conditions to each other. Fortran routines were used in LPM calculation based on ANSYS-CFX junction box, while 3D section was calculated by ANSYS-CFX.
Initial conditions of flow rates at the inlets and average pressure at the outlets were imposed to the 3D model. Average pressure and flow rates received from the 3D model performed at each time step were in turn imposed to 0D model to calculate the following (6) as forcing terms at the interface:

The condition of convergence used in the study is

where T k is the number of steps in one cardiac cycle interval and k is the current time step.
Fluid in this study was assumed to be of Newtonian constitutive behavior [23], with viscosity of blood set as 0.0035 Pa·s and density set to be 1.05 g/cm3. Five cardiac cycles were simulated for each multiscale model to guarantee a convergent solution and the last one is for the result illustration. Convergence of the simulations was based on the residual mean square (RMS) and the residual target was set as 0.0001. The conservation target was set as 0.0001. A fixed time step of 0.0025's was used. Hemodynamic parameters such as flow rate, WSS, total pressure, and OSI were recorded every 10 time steps. In total, 200 series of data in the fifth cardiac cycle of 0.5's were recorded for analysis in each multiscale model.
3. Results
3.1. Boundary Conditions for 3D Models
Flow rates through the superior vena cava and pressure on pulmonary artery distal branches were set as boundary conditions of the 3D models, and profile lines extracted from the LPM were shown in Figure 3.

Boundary conditions for four 3D models (model 1, model 2, model 3, and model 4) extracted from LPM during the fifth cardiac cycle (0.5's). The dashed lines are superior vena cava flow rate (SVC), which are plotted in mL/s; left pulmonary artery pressure (LPA) and right pulmonary artery pressure (RPA) are plotted in mmHg in solid lines. The pressure for each branch on the same side is taken to be equal to each other.
Based on our previous research [22], boundary conditions from LPM for 3D models are available for the simulation.
3.2. Flow Rate of LPA and RPA
Velocity streamlines at 0.14's when flow rate of SVC reached its peak value were shown in Figure 4. The simulation results showed imbalanced pulmonary perfusion in model 2, model 3, and model 4 due to the stenosis compared with model 1. The flow rate gap between left and right pulmonary arteries is extremely big in model 4, which can be seen in Figure 5 and Table 3, while there is no significant difference in the other three models. In particular, the total flow rate of SVC is approximately equal to that of the outlets (total mass flow in LPA and RPA).
Average flow rate on SVC and RLPA/SVC in each model.

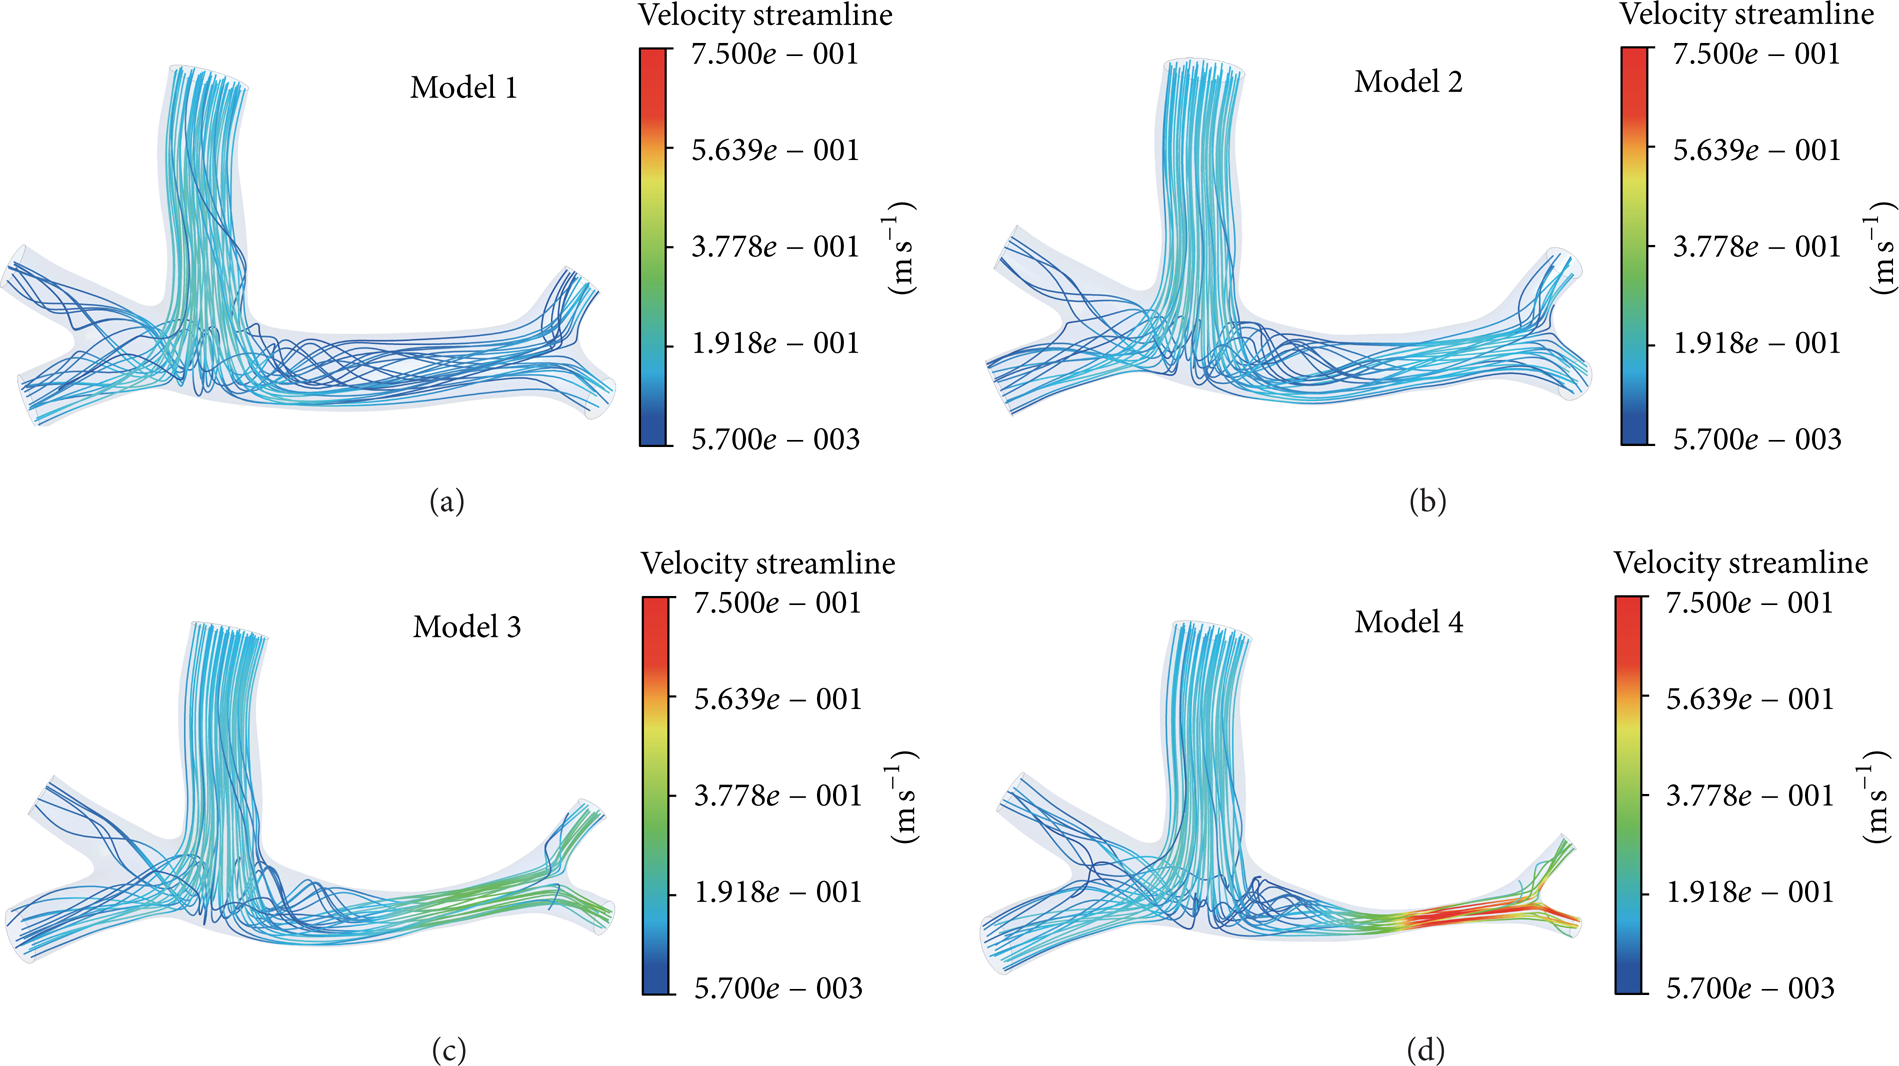
Velocity streamline at 0.14's.
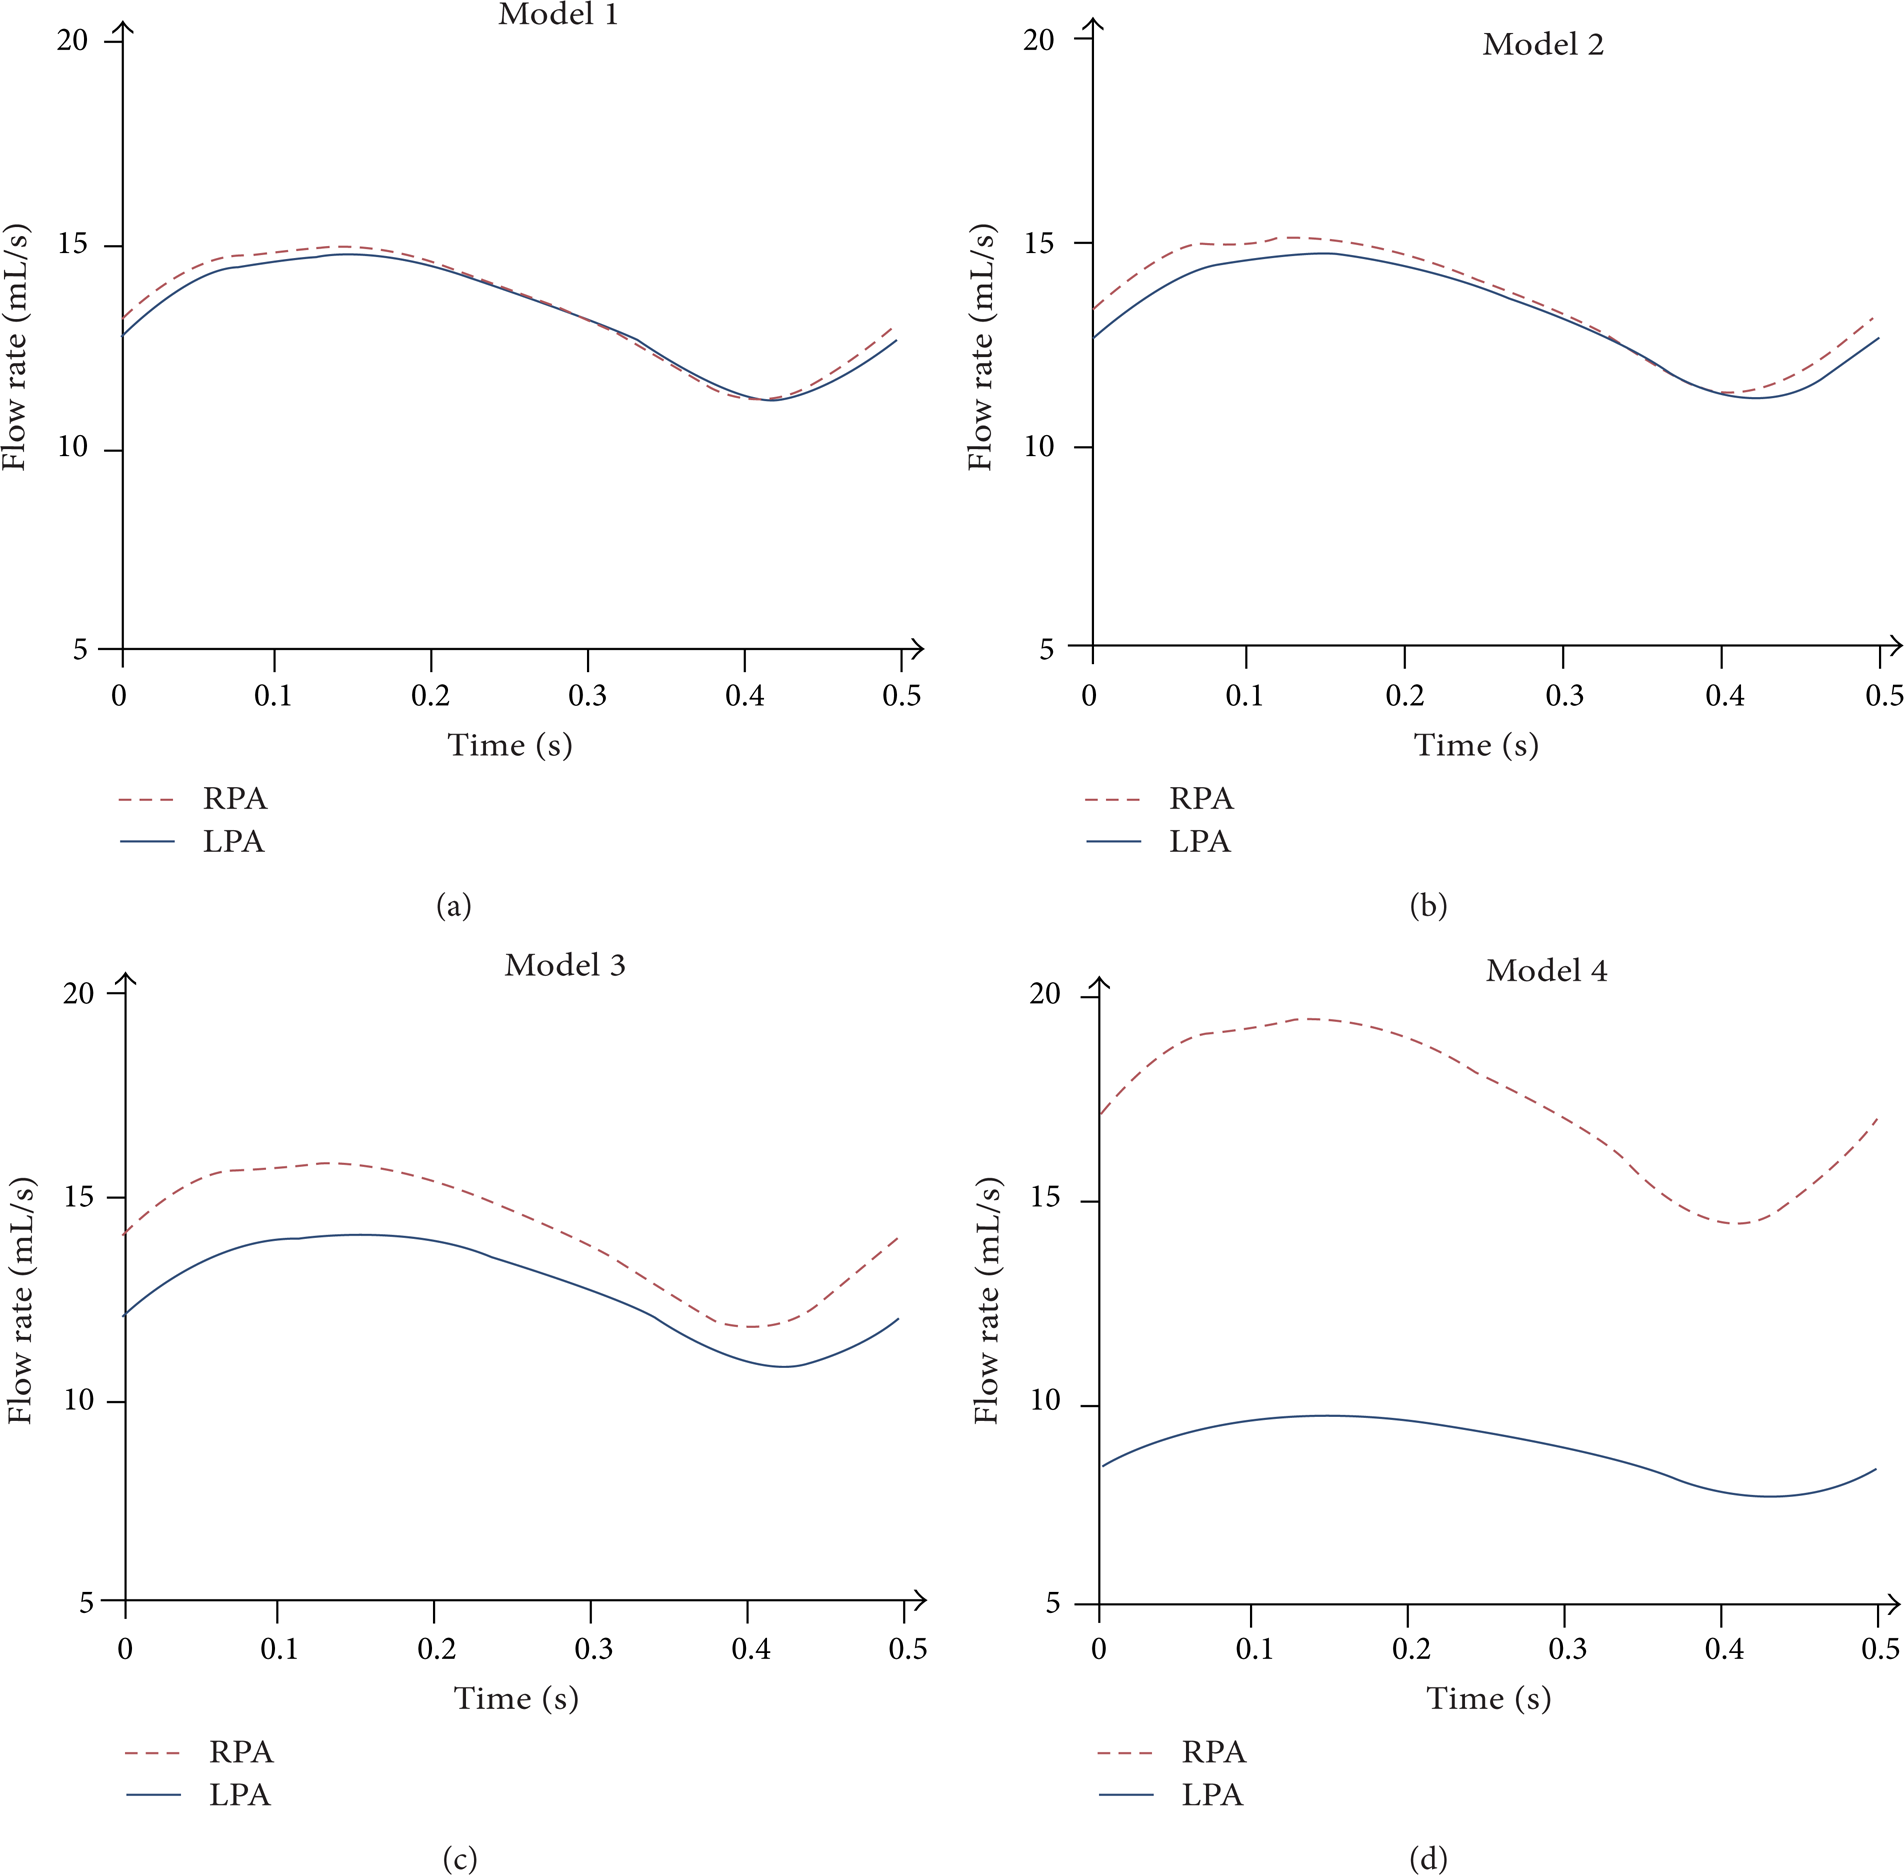
Instantaneous flow rates of RPA and LPA in the four models.
3.3. Static Pressures of SVC, LPA, and RPA
The maximum, minimum, and mean pressure and the amplitude of it on SVC, LPA, and RPA in the four models were shown in Table 4. Different values of pressure on the transverse cross sections were shown in Table 4. Due to the various 3D models in the multiscale model, the boundary conditions for 3D models were demonstrated to be different.
Pressure on LPA, RPA, and SVC of four models.

3.4. Power Loss
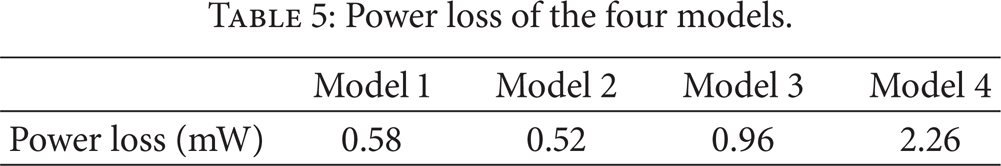
The power loss across the connection was computed by using an integrated control volume energy balance [24] as

The power loss of the four models in one cardiac cycle was shown in Table 5.
Power loss of the four models.
3.5. WSS
The WSS is among the first mechanisms proposed to relate the blood flow to the localization of atherosclerosis [25] and the plaque rupture [26, 27]. WSS contours at 0.14's were shown in Figure 6. Values of WSS vary from 0.00098 Pa to 3.96 Pa in the four models. In general, values of WSS in model 1 are generally lower compared to the other three models and the region of high WSS (>3 Pa) becomes wider as the rate of stenosis becomes higher. Surface areas of low WSS (<0.4 Pa) at 0.14's in the four models were 52.27, 50.21, 41.31, and 26.68 cm2, respectively.

WSS of the four models at 0.14's.
3.6. OSI
The OSI is a known predictor of formation of atherosclerosis and vulnerability for plaque in coronary arteries. The OSI for the pulsatile flow simulation is calculated as [28]

where
Surface area of OSI counters.


OSI counters of the four models.
4. Discussion
Effect of stenosis of unilateral pulmonary analysis was performed using a fully coupled multidomain approach, which can provide physiologically accurate boundary conditions to the CFD simulation. In this research, influence of unilateral pulmonary artery stenosis on Glenn postoperative recovery in aspect of hemodynamic environment is studied. We considered the extremely serious condition when 75% of the artery is blocked to estimate what the effect of the stenosis is on the flow. The flow dynamic motion in the pulmonary artery was contained in our simulation and the investigated parameters including the flow perfusion to each artery, the pressure, the power loss, the WSS, and the OSI.
It is not possible to explain all the clinical issues relating to this kind of symptoms and give definite suggestions to surgeons by this numerical study, but it does enable better understanding of the influence of unilateral pulmonary stenosis on the flow features in the regions of anastomosis and stenosis. The venous blood from SVC flowed directly into pulmonary artery to lungs to make exchange of oxygen, which can increase the content of oxygen in the blood.
In this simulation, when the stenosis degree was above 75%, RLPA/SVC decreased abruptly compared to the other three models. This was due to the cross-sectional area when stenosis is 75%, which is 0.0625 times of no stenosis. This leads to abrupt pressure difference between proximal and distal stenosis. Unbalanced lung perfusion may have complications on the development of the PA tree [29]. This result of RLPA/SVC reminds us that if the stenosis accompanied with the unilateral pulmonary artery is very serious, it may have the potential to exaggerate the distribution of unbalanced blood flow to the lungs. Surgeons should therefore take into account the influence of stenosis on the vessel walls such as anastomosis and the stenosed sections. Power loss is a significant hemodynamic parameter in judging the long term effectiveness of the surgery. Results show that power loss reaches to 2.62 mW in model 4. High OSI has been widely used as indicators of atherosclerosis because the regions with high OSI are likely to experience stagnation or backflow [30–32]. Results in this study show high OSI around anastomotic section in the model with stenosis degree above 75%. Taking the complication of the stenosis on OSI into account, the stenosis of pulmonary artery should be treated before Glenn surgery.
Hemodynamic parameters such as RLPA/SVC, power loss, and OSI of models with mild stenosis show little influence on patients recovery after Glenn operation. Considering the tiny effect and patients are infants, there is no necessity to pay attention to it.
The limitation of this study is that the wall of 3D models was set as rigid. In addition, fluid-structure interaction (FSI) models were not considered due to the complexity and long cost of calculation time.
5. Conclusion
Four postoperative Glenn models coupling with LPM were calculated by CFD simulation. Generally speaking, high rate of unilateral pulmonary artery stenosis was demonstrated hemodynamically unfavorable to the development of postoperative recovery. The stenosis rate above 75% may cause severe unbalanced blood perfusion into each lung and huge power loss, in which condition is suggested to be treated before Glenn surgery in favor of well development of patients. Furthermore, the results indicate that the anastomosis regions are subjected to disturbed and nonphysiologic blood flow resulting in extraordinary degree of WSS and OSI in models with severe stenosis.
Conflict of Interests
The authors declare that there is no conflict of interests regarding the publication of this paper.
Footnotes
Acknowledgments
This research is supported by National Science Foundation of China (11172016), the Natural Science Foundation of Beijing, China (KZ201210005006), and the Specialized Research Fund for the Doctoral Program of Higher Education of China (20111103110012).