
Abstract
The micromachining process has been applied to the free form and micromolds markets. This has occurred due to the growth in demand for microcomponents. However, micromachining of hardened steels is a challenge due to the reduction in tool life and the increase of the surface roughness when compared with the macromachining process. This paper focused on the analysis of micromilling forces on hardened AISI H13 steel with different grain sizes. Experimental tests were carried out on workpieces with different austenitic grain sizes and a hardness of 46 HRC. Micro-end-mill cutters with a diameter of 0.5 mm and (TiAl)N coatings were applied in the milling of workpieces of 11 × 11 mm. The input parameters were two radial depths of cut, two cutting speeds, and two feed rates. The influence of the input parameters on the response cutting force was analyzed using the Taguchi method. Finally, considering the large grain size, the cutting forces in the x-, y-, and z-axes direction were small.
1. Introduction
In the last years, arising interest in higher precision and miniaturization of industrial components for a wide range of manufacturing processes, such as turning, milling, and drilling, can be observed. According to Davim et al. [1] this increase in interest has led to new requirements in machining, especially in micromachining. The domain of the micromachining process is in need of several studies to fill the gaps and to bolster our understanding of cutting on the microscale. Miniaturized components need high accuracy due to the requirements of the aerospace, biomedical, communications, automotive, and electronics industries. According to Chae et al. [2] this miniaturization will provide microsystems that carry the promise of improving health care, quality of life, and economic growth in several modern applications. Nowadays, the application of microcomponents in biomedicine is restricted to heart stents. Osseous implants need microscrews of less than 2 mm in diameter, however, and the manufacturing of this product is very challenging due to its scale and the use of new materials.
The miniaturization of components depends on their physical and mechanical properties because these will influence the cutting mechanism and the geometric parameters for tooling. The cutting mechanism in both micromachining and traditional cutting varies according to the material to be machined. Ferrous and nonferrous materials have different structures, and the geometry of the tool is one of the parameters that has the greatest influence on machining. Thus, the main difference between micro- and traditional machining is the cutting mechanism, which corresponds to a knowledge gap to be explored. Dornfeld et al. [3] affirm that micromachining relies on more complicated mechanisms depending on the degree of the size effect. According to the authors, this occurs due to the shearing of the material milled in front of the cutting edge generating the chips. Based on this, the grain size will greatly influence the cutting mechanism because in the cutting of some materials, the grain size could have the same diameter size as the cutting tool.
Some authors suggest that microscale machining should be considered when the undeformed chip thickness is less than the average grain size of the workpiece material [4]. Ng and Aspinwall [5] carried out micromilling tests on aluminum 7075-T6, and they defined that the micro- and nanoscale machining with material removal occur when the undeformed chip thickness falls within a range of a few nanometers to a few microns. However, the machining of hard materials applied in molds and dies, as in the example, took into account only the hardness of the steel but dismissed the metallographic structure and the grain size of the material [6]. It is well known that the flow stress of steel changes with the hardness variation of the material.
Simoneau et al. [4] studied the influence of grain size and orientation during the microcutting of AISI 1045 steel. According to the authors, the orientation can affect the plume formation at the chip-free surface and increase the surface defects. The authors also observed the formation of surface dimples, and they support that this defect is linked to the dual phase. Bissaco et al. [7] affirm that two variables are more important: the cutting edge radius and chip thickness, and they can be observed at the tool/material interaction on the microscale. The authors stated that the first one is strictly related to the geometry of the tool and generates accumulation of plastically deformed material. The second effect consists of the smearing of material behind the tool, forming small waves in the feed rate direction.
According to Miao et al. [8] the inherent complexity of the micro-end-milling process makes it difficult to be monitored, especially when tool wear and vibrations are considered. In the micro-end-milling process, various factors can affect the dynamic cutting force and vibrations in microcutting. The authors support the fact that a multiphase microstructure can induce high frequency in cutting forces, generating a fluctuation. Moreover, the size effect can also enhance the cutting force, and the minimum chip thickness probably produces discontinuous chip formation.
Generally, the stiffness of machine tools interferes greatly with the micromilling process. The level of vibrations, for example, that occurs in the micromachining process is greater and more noticeable than in macromilling. Furthermore, there is still little understanding of the relationship between stability and the cutting parameters. However, the monitoring of cutting forces is very important to improve our knowledge about chip formation. The mechanism of chip formation is more complex in micromilling than in macromilling. Kim et al. [9] developed a model for chip formation in micromilling that is capable of describing the intermittency period of chip formation. According to the authors, the proposed method can estimate the minimum chip thickness using cutting force periodicity.
Sooraj and Mathew [10] support that the feed rate and the interaction between cutting speed and chip load are decisive factors in microscale end-milling. Furthermore, the variation of cutting forces can occur at lower feed rates and this condition indicates the effect of minimum chip thickness on the microscale.
According to Yan et al. [11], AISI H13 steel has been applied widely to produce several kinds of dies for hot work, such as forging dies, extrusion dies, and casting dies. However, the grain size of these dies is maintained on a standard scale that is independent of the hardness variation. According to Afazov et al. [12], some steels are annealed and have low hardness when supplied, and a typical example is the AISI H13 steel. This special steel grade, generally used to manufacture molds and dies, requires further heat treatment to achieve the required hardness for the corresponding applications.
AISI H13 steel is widely used in manufacturing, with applications in hot work (44–48 HRC), blanking tools and bending tools (50–52 HRC), swaging dies (53–55 HRC), forging and extrusion dies (46–49 HRC), die casting (52–54 HRC), injection molds, and other applications on the macro- and microscale [12]. The application of AISI H13 in molds and dies is related not only to the resistance to abrasion but also to the excellent surface finish provided by these steels. According to Nicola et al. [13], the finishing of molds and dies manufactured with AISI H13 steel is excellent, showing less surface roughness and surface defects. However, the material behaves differently at different hardness and can influence the cutting forces at the microscale. Aramcharoen and Mativenga [14] studied how the uncut chip thickness and cutting edge radius affect the specific cutting force in the machining of AISI H13. According to the authors, the knowledge about cutting forces provides a valuable insight into optimum microscale machining conditions for obtaining the best surface finish and minimizing burr size.
Thus, considering the widespread application of AISI H13 in the manufacturing of molds and dies and its versatility that allows it also to be used in micro-end-milling, this paper studies the cutting forces based on the variation of the grain size. The cutting forces produced in the milling of AISI H13 steel with different grain sizes were monitored using a piezoelectric dynamometer in order to understand the effect of grain size on forces.
2. Methodology
A high-speed machining head, model Nakanishi HES510, with 50,000 rpm and 300 W of main power was coupled to a Discovery 560 Romi machining center. The use of the high-speed machining head provided an increase in spindle speed and, consequently, generated high cutting speeds. The displacement of the tool was achieved by movement over the x-, y-, and z-axes of the machine center. Workpieces of hardened AISI H13 steel with dimensions of 11 × 11 × 11 millimeters were used in the tests. The grinding process was applied previously in the manufacturing of the workpieces to ensure the accuracy and a perfect assembly on the fixture device. The chemical composition of the workpieces is 0.40% C, 1.00% Si, 0.35% Mn, 5.20% Cr, 1.50% Mo, 0.90% V, and Fe in balance. The workpieces were submitted to different heat treatments to produce two grain sizes. Figure 1 shows a layout of the experimental tests.

Layout of experimental tests.
Table 1 shows the two grain sizes that were obtained after heat treatment, where the austenite grain size was measured in micrometers according to the ASTM standard. Figures 2 and 3 show the micrography of the workpieces. It can be noted, in Figures 2 and 3, that the microstructure is constituted of a ferrite matrix with homogeneously dispersed carbide. Furthermore, the structure is also composed of a martensitic structure with coarse carbide.
Properties of grains after heat treatment.


Micrography of the workpieces (grain size of 40 micrometers).
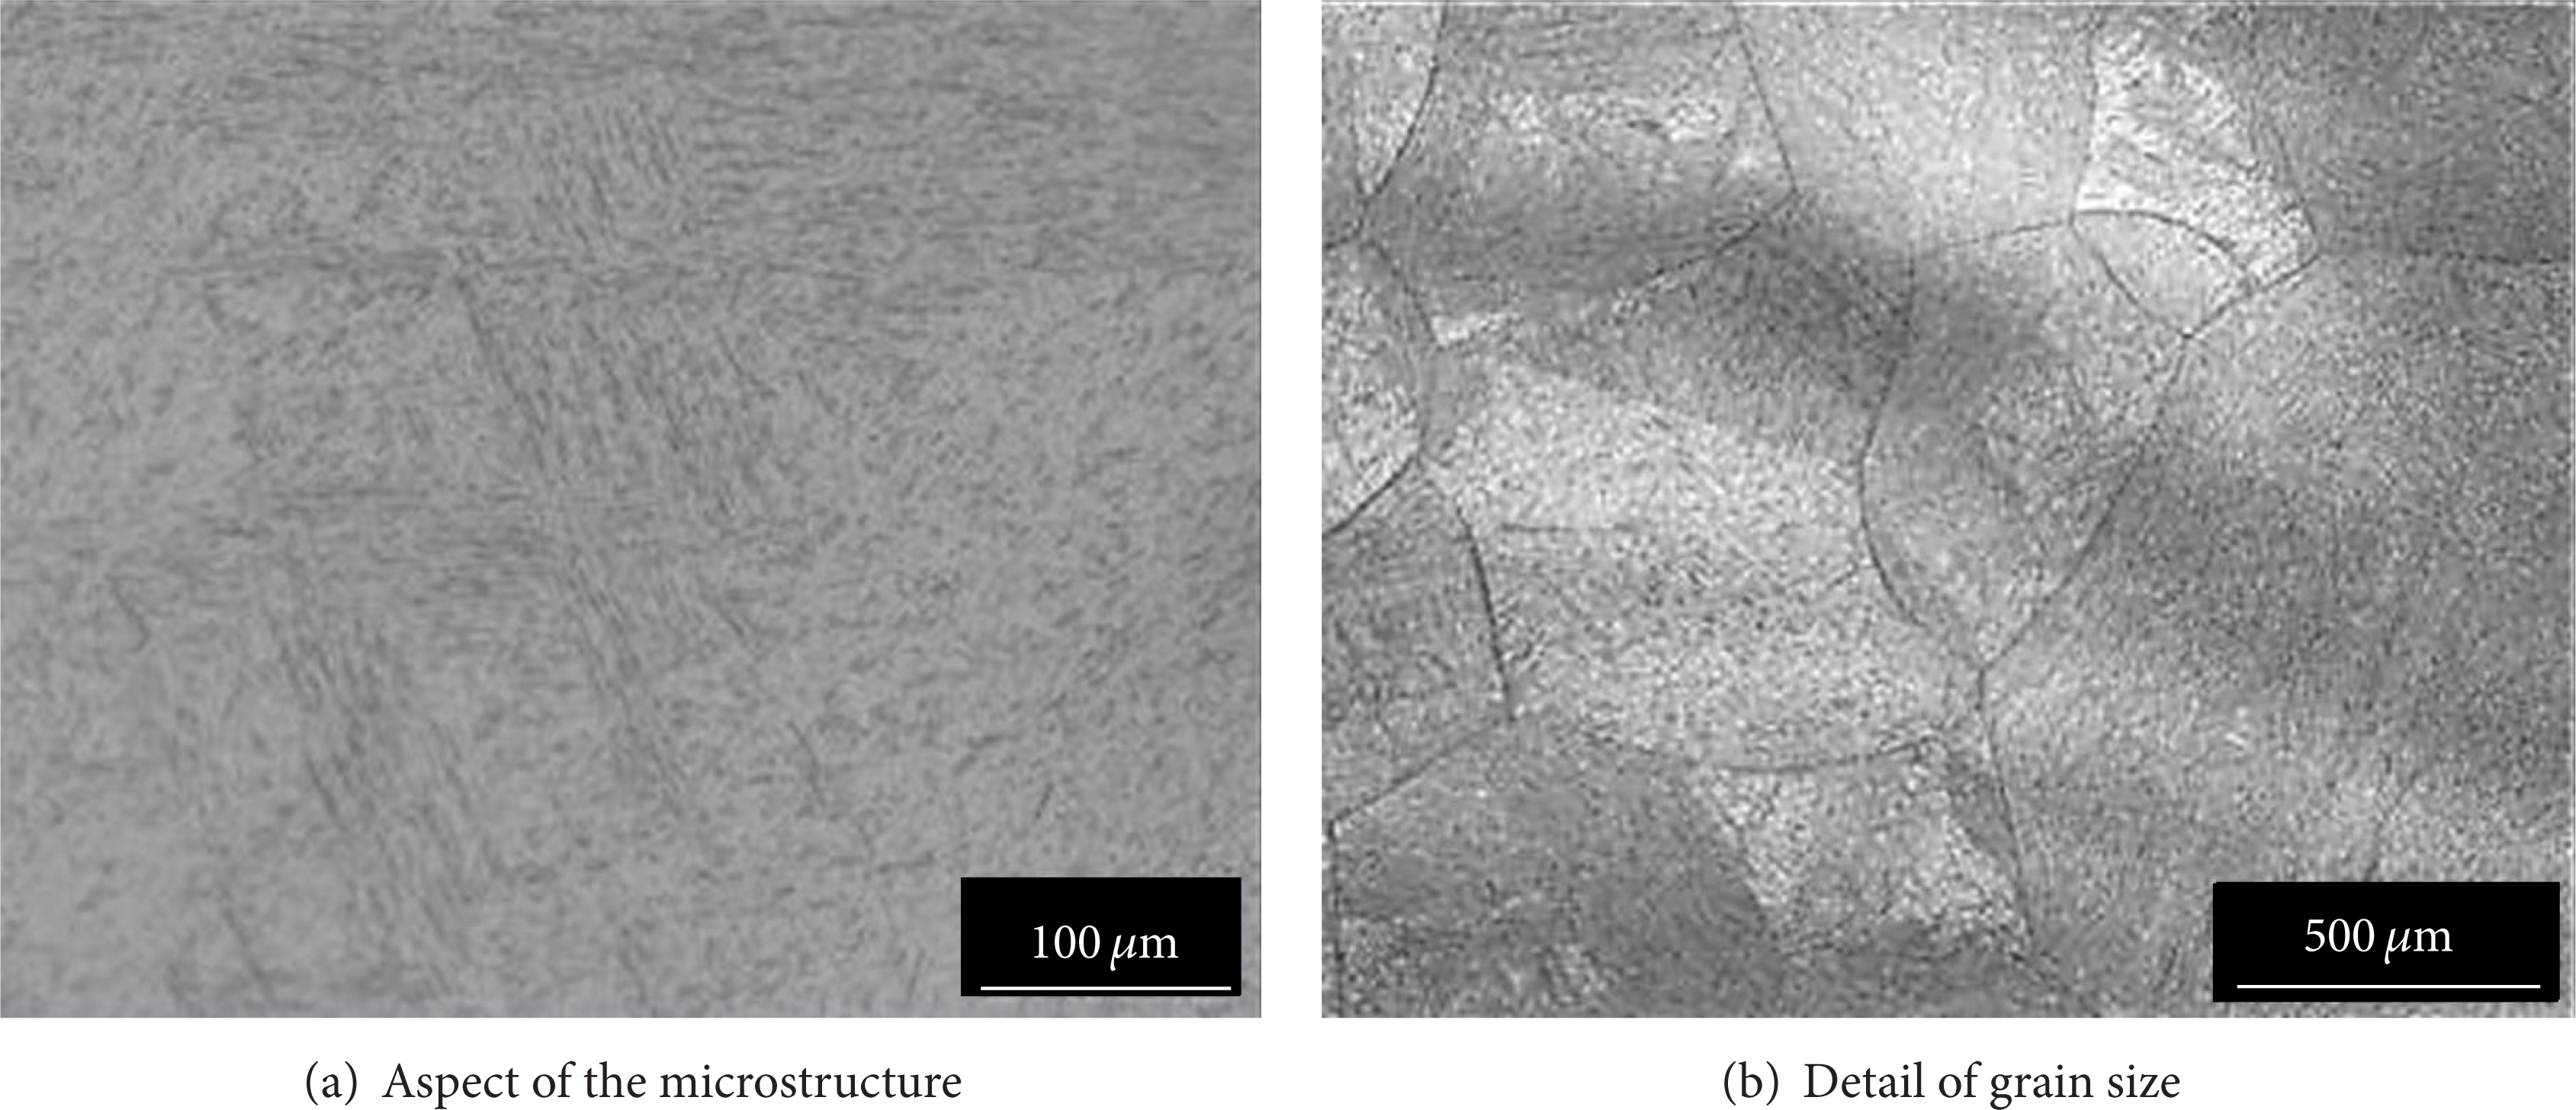
Micrography of the workpieces (grain size of 497 micrometers).
Table 2 shows the input parameters used in the experimental tests. The values for cutting speed, feed rate, axial depth of cut, and radial depth of cut were defined according to the manufacturer of the tools.
Input parameters for experimental tests.

The dynamometer used in the test was a Kistler model 9272 with capability of measuring cutting forces on the three axes, F x , F y , F z , and M z torque. The dynamometer was set up with the sensibility of 26 pC/N for micromilling experiments, according to Afazov et al. [12]. The frequency was 6.5 kHz, because it should be at least four times as large as the natural frequency of the dynamometer, according to Shaw [15].
3. Analysis of Results
3.1. Experimental Tests
Figure 4(a) shows typical graphs of force F x and torque for the experimental tests. The cutting mechanism in micromilling is similar to macromilling, because the micromilling process undergoes both ploughing and shearing mechanisms [16]. According to Simoneau et al. [4], different chip morphologies can occur depending on the cutting scale. The transition between cuttings on the macro-meso-micro-scale can generate a smaller thickness of uncut chips when compared to orthogonal cutting. Generally, chips formed in the refined microstructure and greater than 20 μm provide continuous chips; for the microstructure with grain size between 8 and 20 μm, the chips are considered of transition, and for the microstructure lesser than 8 μm the chips are considered quasi-shear extrusion [4].
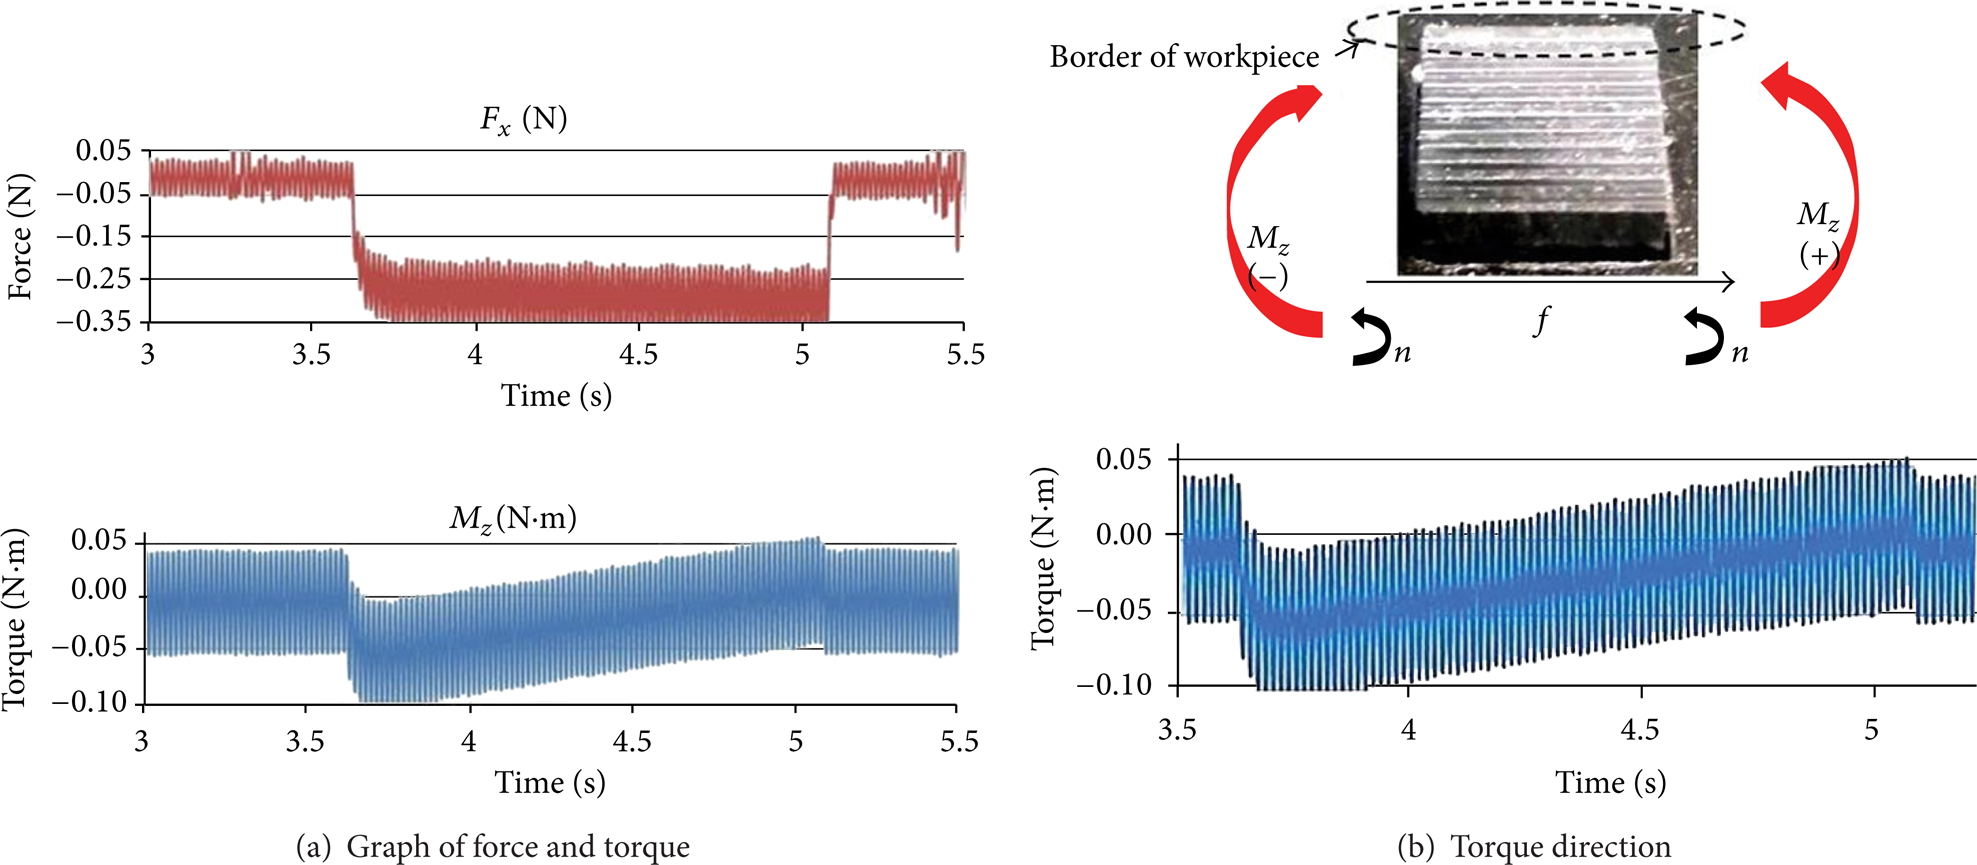
Experimental tests (V c = 77 m/min e f = 5 μm) at the border of workpiece.
The F x cutting force was negative due to the measurement orientation of the dynamometer. Therefore, the behavior of the torque was different at the border and at the center of the workpieces. The experiments carried out at the border of the workpieces generated torque values varying from negative to positive due to the upward cutting used in the experiments. The upward cutting had an opposite direction considering the dynamometer's center line at the beginning of experiments and the same direction at the end of the experiments, as can be seen in Figure 4(b).
In the opposite situation, not only the experiments carried out exactly at the center of the workpieces showed low values of torque but also these torque values were practically constant, according to Figure 5. All tests were implemented using statistical software that provides the randomization of the experimental design in order to avoid the influence of the tests carried out at the border or center of the workpiece. Each experimental condition was repeated three times and 2 replicates were set in the experiment.

Graph of force and torque for experimental tests (V c = 77 m/min e f = 5 μm) at the center of workpiece.
3.2. The Experimental Design Using the Taguchi Method
The Taguchi method enables the drastic reduction of the number of tests. The technique is based on the orthogonal array and also minimizes the effects of the factors out of control that can have an influence on the tests. The most important stage of the test design lies in the selection of control factors [17]. According to Park [18], as many factors as possible should be included to identify nonimportant variables at the earliest opportunity. Rascalha et al. [19] support that the Taguchi method can be applied in complex processes, such as through-feed centerless grinding, to monitor the dressing operation and to provide information about form errors, such as roundness, surface roughness, and circularity.
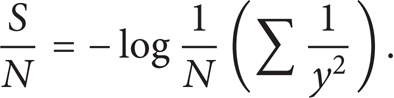
In the Taguchi method the signal-to-noise (S/N) ratio is applied as the quality characteristic to determine the correct choice. The S/N ratio is used as a measurable value instead of standard deviation because as the mean decreases, the standard deviation also decreases, and the opposite can also occur. According to Kim et al. [20], the use of the Taguchi method implies that the engineering systems have production factors that can be manipulated, and these can be divided into three categories.
The first category corresponds to the control factors, which affect the process variability that can be measured by the S/N ratio. The second is the signal factors, which do not influence the S/N ratio or process mean. Finally, there are the factors that do not affect the S/N ratio or process mean. When the practical data is considered, the mean value considered as a target may change dramatically during the process development. There are, therefore, two applications nowadays in which the concepts of S/N ratio are useful: the improvement of product quality through variability reduction and the improvement of measurements and control. Shetty et al. [21] affirm that the signal-to-noise ratio characteristics can be divided into three categories given by (1), (2), and (3) below.
When the nominal value is the best characteristic,

When the smaller value is the best characteristic,

When the larger value is the best characteristic,
Based on this, the engineering systems can manipulate production factors that can be divided into three categories, where
Accordingly, the optimum microcutting conditions were defined for the minimum forces to avoid the breaking of the microcutter. For this the S/N ratios and level values were calculated by using (2), which corresponds to “the smaller is the best” scenario. The use of “smaller is the best scenario” is related to the cutting forces of the microcutter. The use of incorrect input parameters during micromilling can provoke an abrupt breaking of the tool due to the increase in cutting force. Thus, the Taguchi method and L8 orthogonal array were used to reduce the number of experimental tests. The results of the experiments for cutting force and torque are shown in Tables 3 and 4. The experiments were carried out with three replicates.
The results of experiments for M z torque and F z cutting force.

The results of experiments for cutting force F x and F y .

The responses analyzed in Table 3 were the torque and F z force. The F z force corresponds to the force in the axial direction of the tool. In Table 4, the responses were tangential cutting force in the X and Y directions. The M z torque ranged from 0.005 to 0.044 N·m and the F z force ranged from 0.031 to 0.552 N. The F x cutting force corresponds to the force in the feed rate direction and the F y force corresponds to the force in the radial direction of the microcutter. It can be observed in Table 3 that the values of the F x force ranged from 0.152 to 0.371 N and that the F y force ranged from 0.151 to 0.397 N.
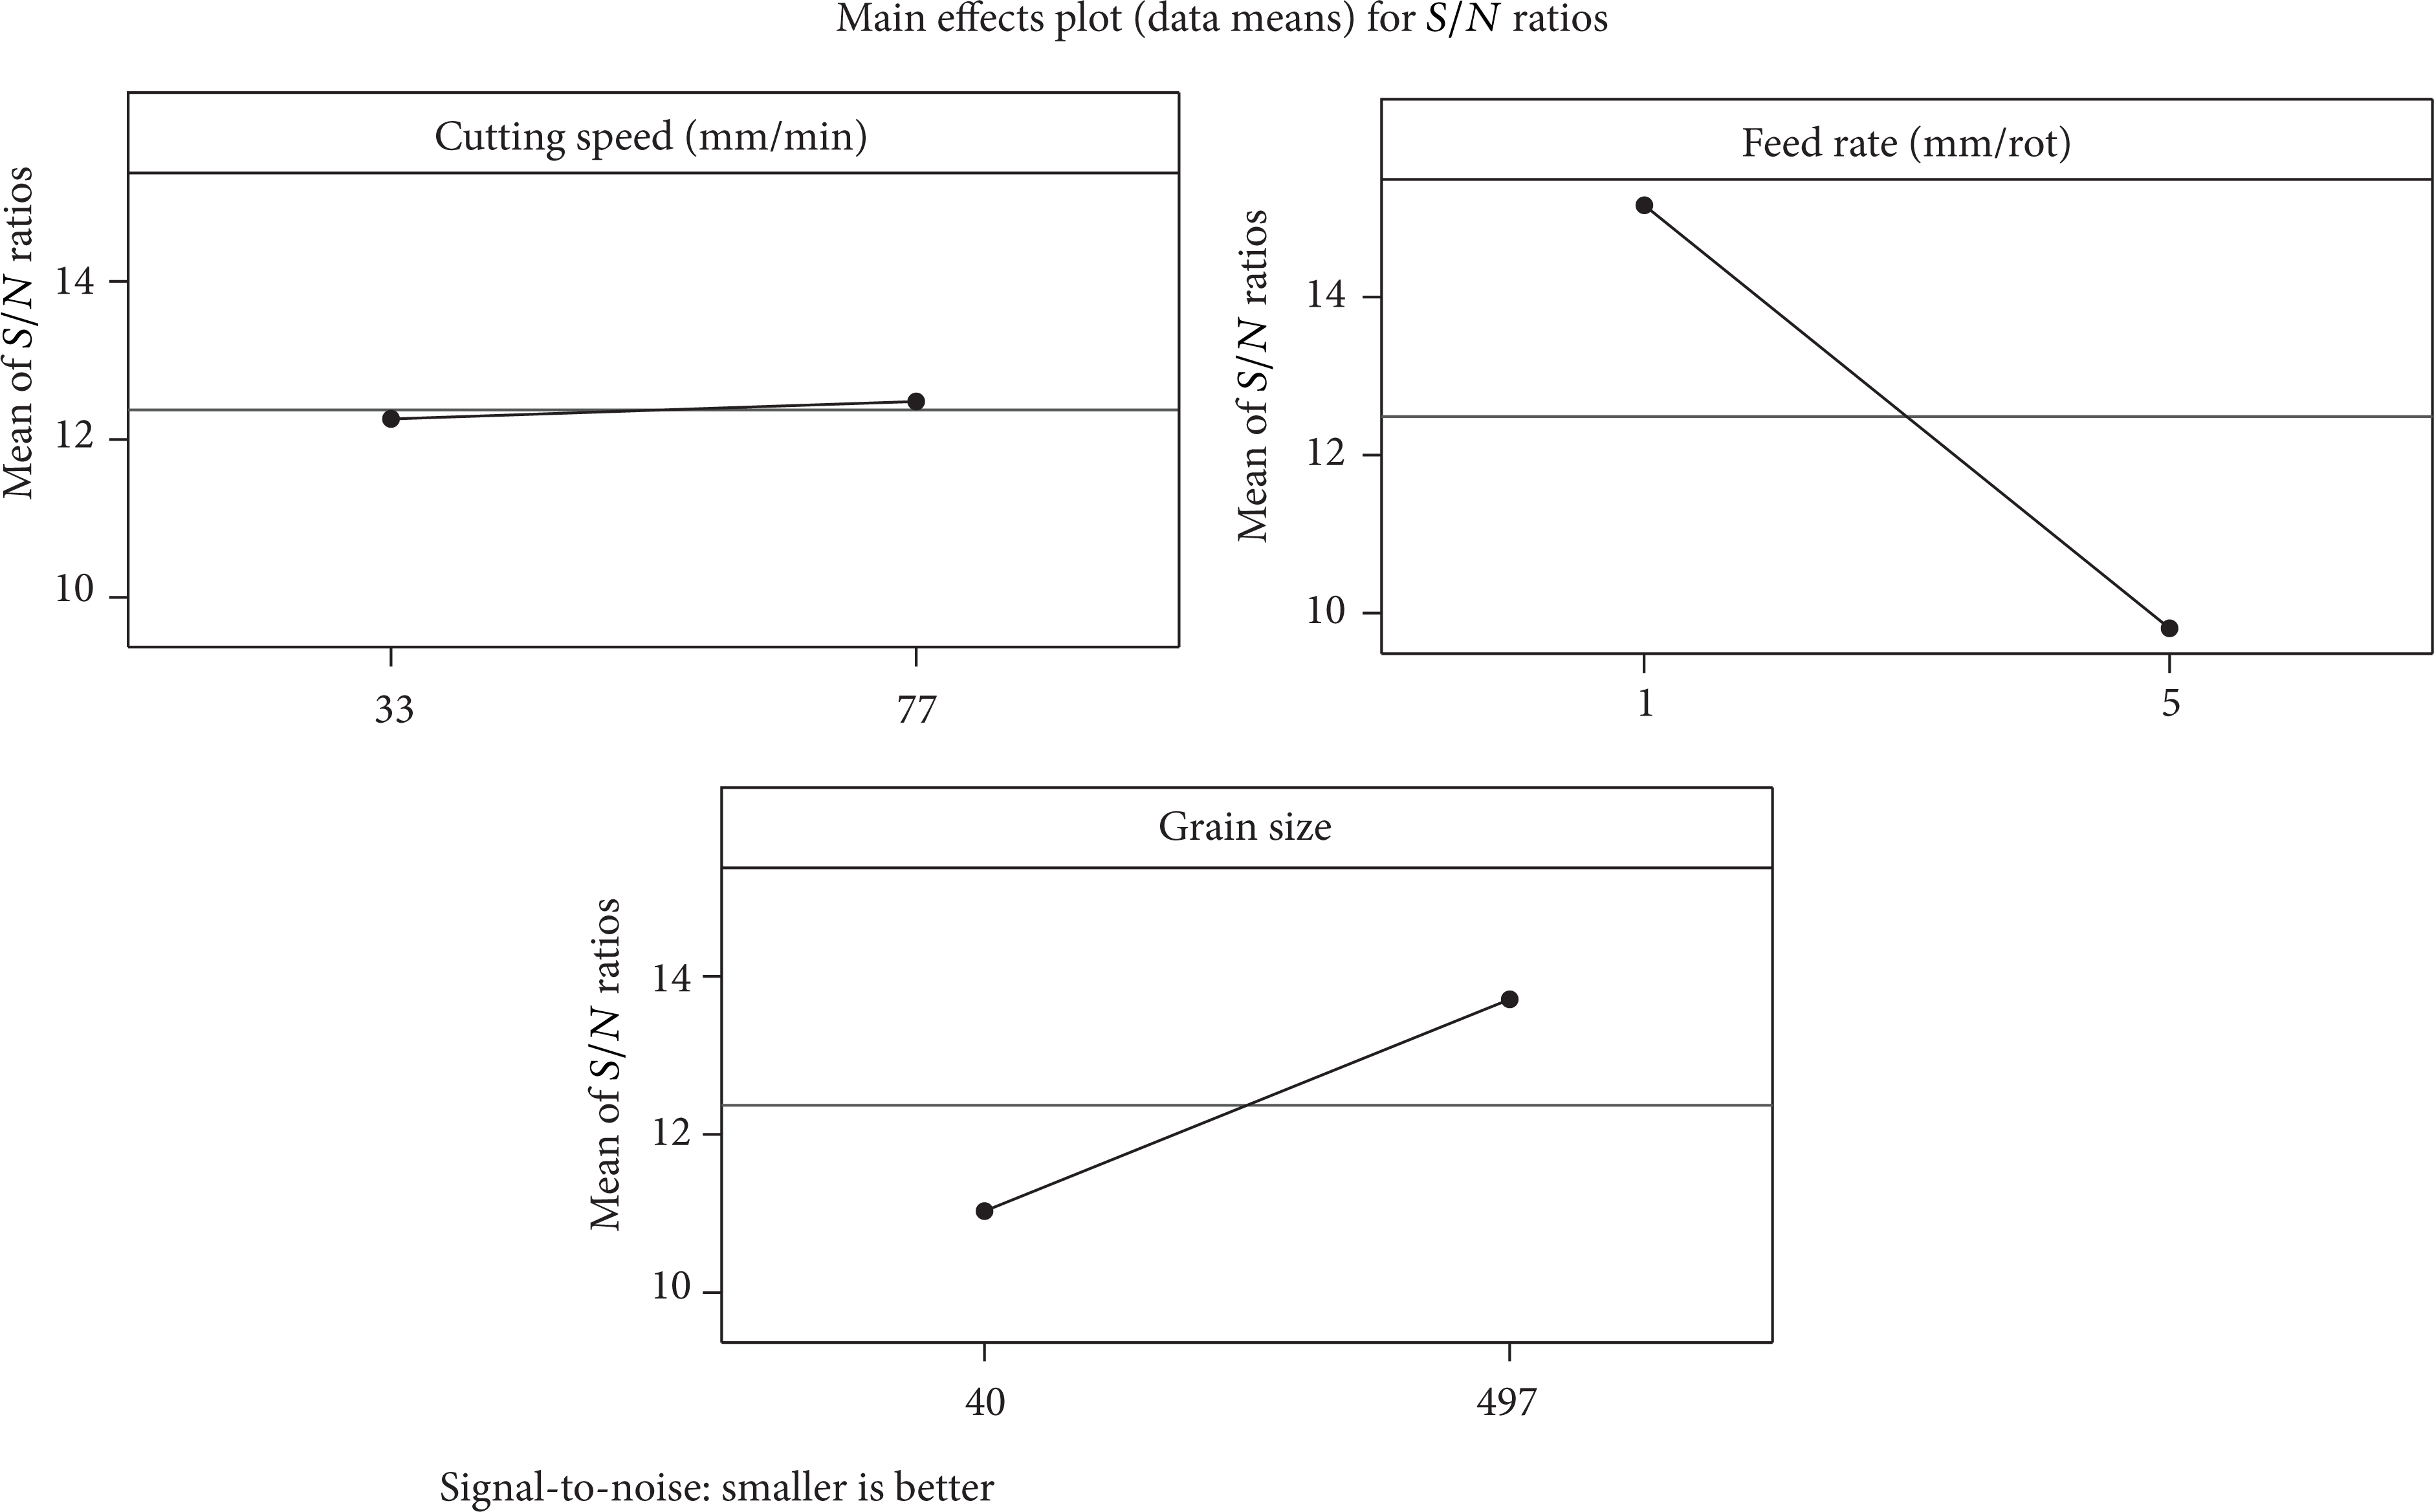
Table 3 shows that the lowest values for M z torque occurred with the cutting speed of 33 m/min, feed rate of 5 μm, and grain size of 497 μm. The use of low cutting speeds generates low torque because M z torque depends on the force of the tools tip. According to Reed-Hill et al. [22], the formation of pearlite in the coarse-grain steel is slower than in fine-grain steel. This situation has great influence on the hardenability of the material, and it can affect the cutting mechanism mainly in micromilling.
However, according to Figure 6, the main input parameter for the S/N ratios, when M z torque is considered, was the feed rate that had a variation of 40%. This behavior can be explained by the significant change in the feed rate from 1 to 5 μm in the radial direction, generating an increase of the cutting section, and, consequently, the rise of the cutting force. The variation of the main effects for S/N ratios considering the cutting speed and grain size was 4% and 8%, respectively.

Main effects for S/N ratios considering the M z torque.
The lowest F z cutting force also occurred with the grain size of 497 μm, despite the fact that the axial depth of cutting was kept constant. Thus, although the depth of cutting did not vary, a range of values was observed due to the cutting speed and feed rate variation. The smallest values for the F z force were observed when low cutting speeds were used. Figure 7 shows a variation of the S/N ratio of 117% for the cutting speed, 15.4% for the grain size, and 2% for the feed rate. The great variation of the S/N ratios considering the cutting speed can be explained by the instantaneous cutting section that is influenced simultaneously by the radial and axial forces on the microcutter.

Main effects for S/N ratios considering the F z cutting force.
Table 4 shows the variation of cutting force for the F x and F y directions. It can be noted that the lowest cutting force occurred when a low cutting speed was used. When grain size was considered, low cutting efforts occurred simultaneously for the two grain sizes, unlike what happened with M z torque. One can therefore verify in Figure 3 that the grain format is random. Based on this, the milling process may have provoked simultaneously the cut of one grain or several grains. This milling condition may have occurred in both F x and F y direction.
This condition confirms the analysis of M z torque, where the grain-boundary area of a fine-grain structure is several times larger than that of coarse-grain steel, increasing the cutting force. Figures 8 and 9 show the S/N ratio considering the F x and F y cutting force. Based on this, considering that the displacement of cutter in x-axis was the feed rate direction, the influence of the feed rate on response force F x was expected. Moreover, the variation of the S/N ratio was of 55% and 37% for F x and F y , respectively.
Main effects for S/N ratios considering the F x cutting force.
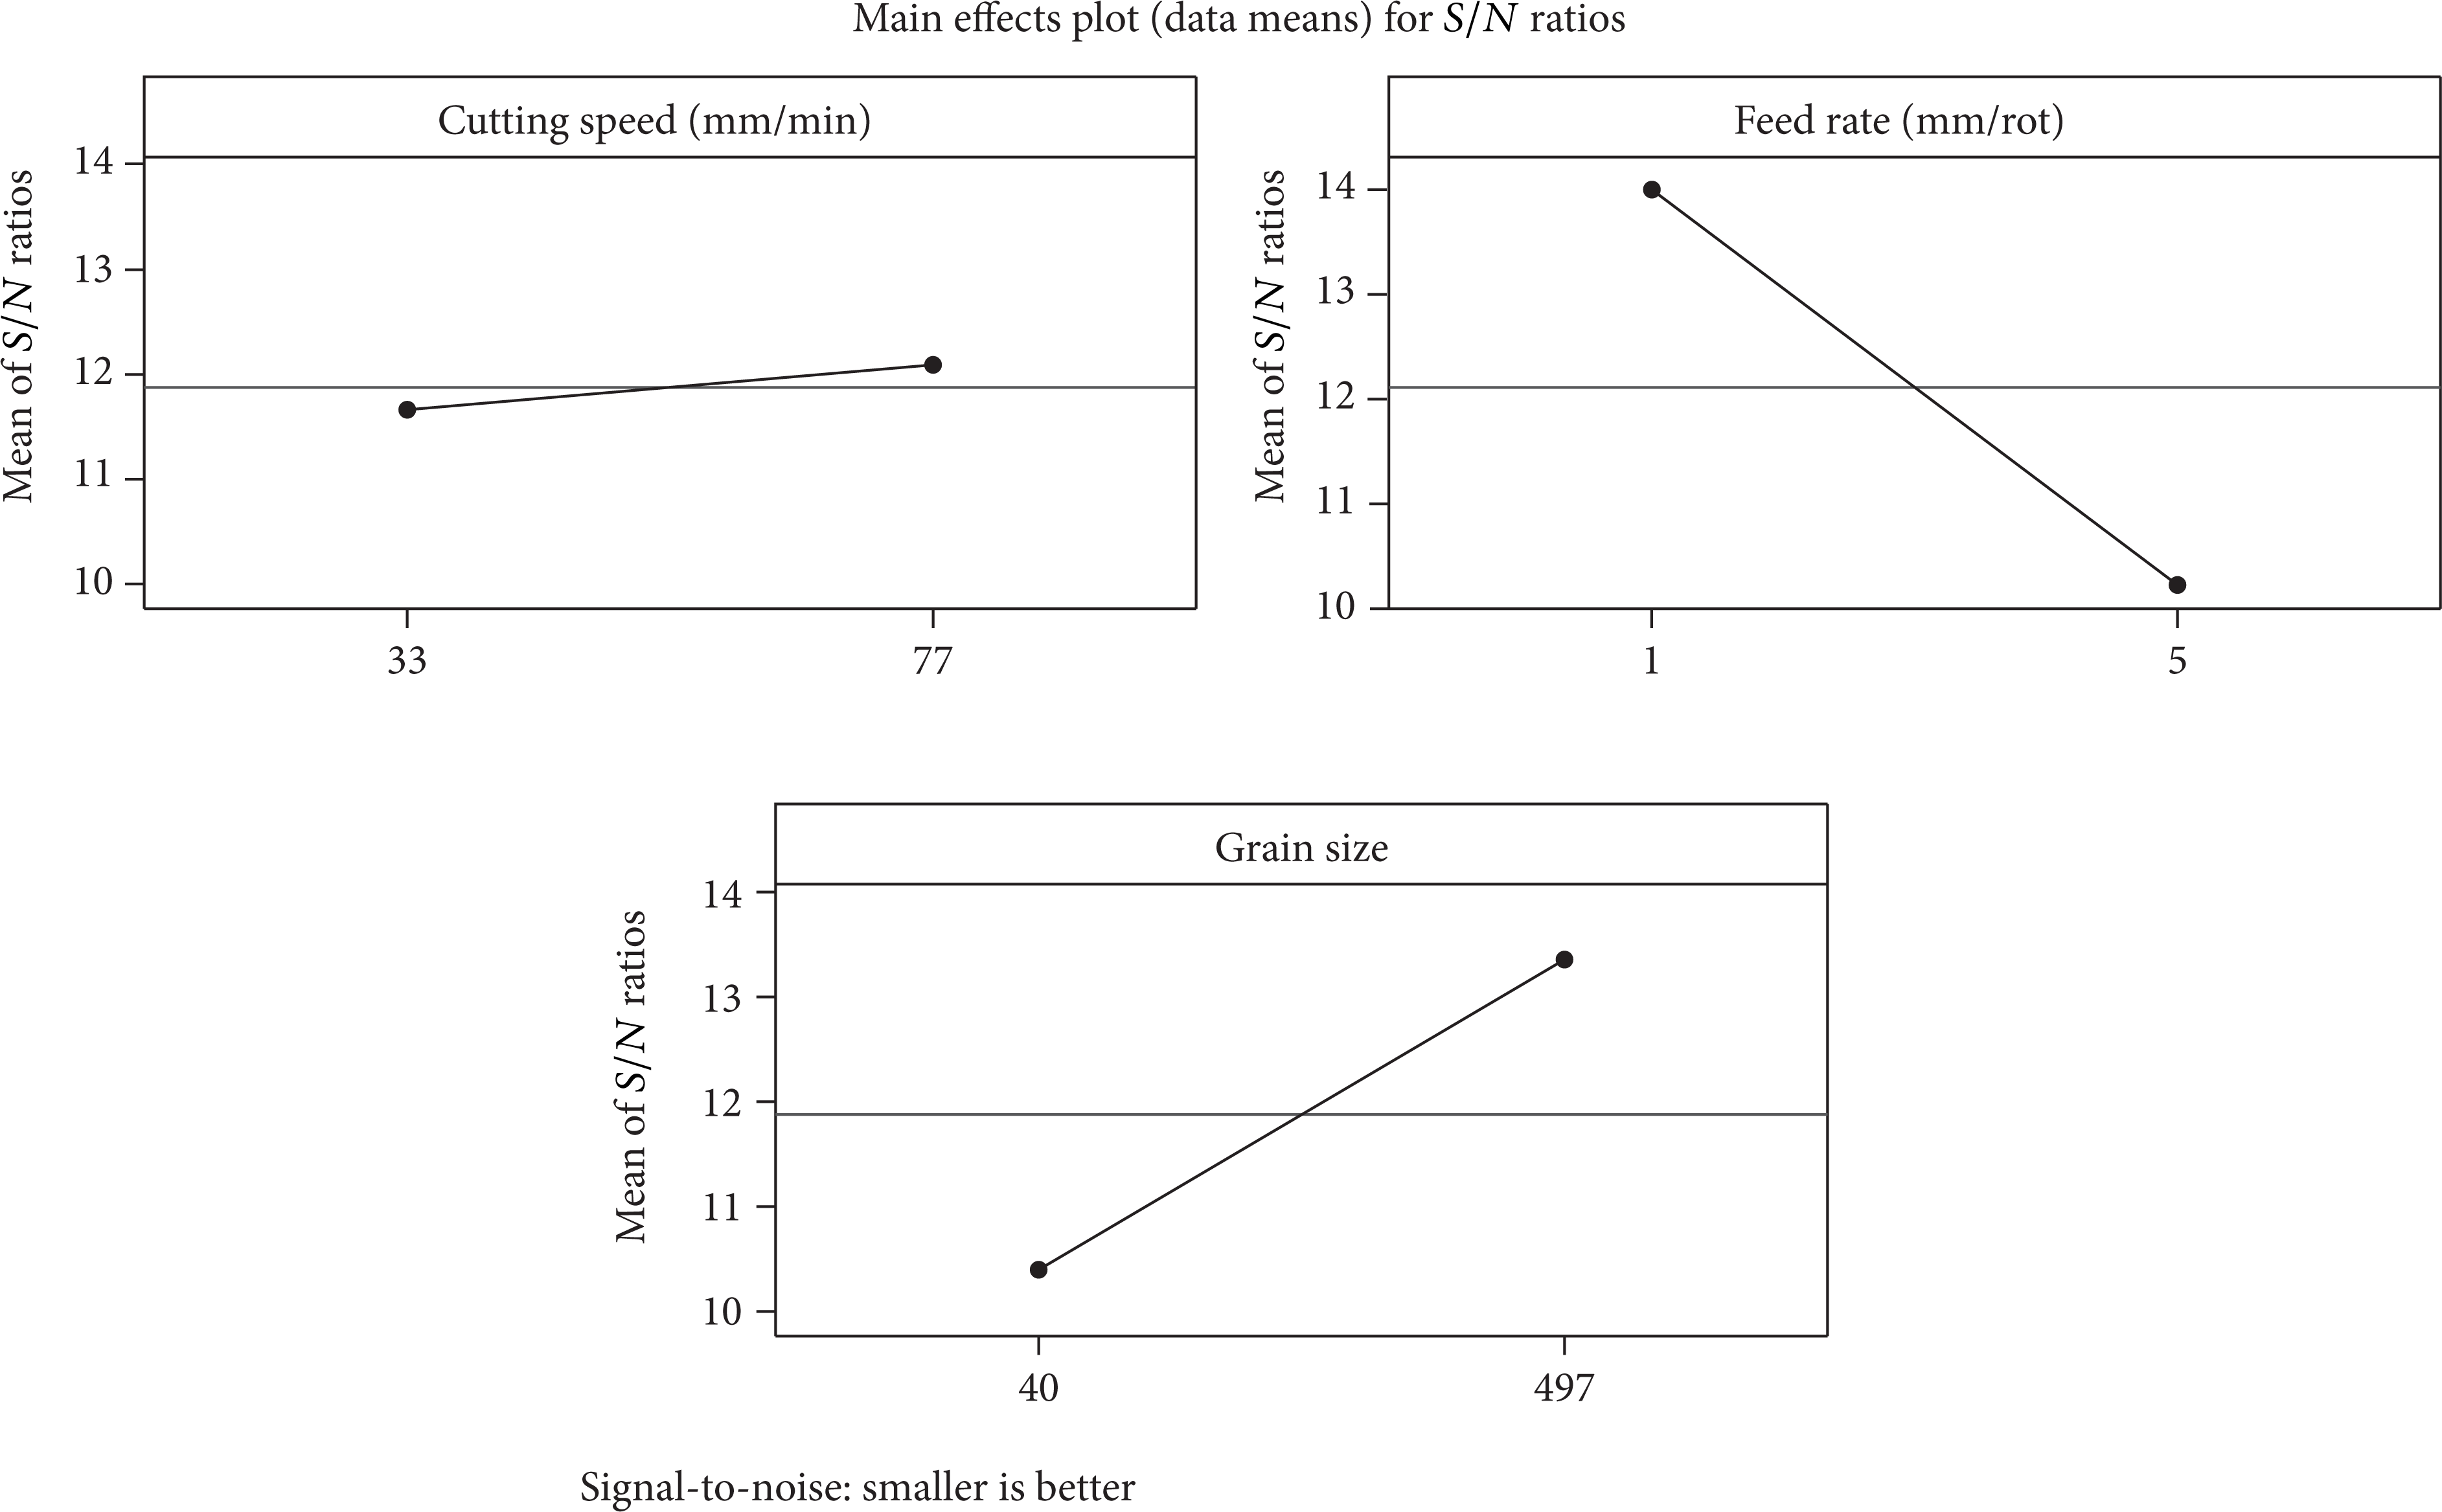
Main effects for S/N ratios considering the F y cutting force.
Moreover, the grain size also supplies a variation of 28% and 24%, respectively. The feed rate was therefore of great influence on the response force in both micromilling and macromilling processes. The most important factor that should be considered is the significant influence that the grain size has on cutting forces. Thus, depending on the grain size generated during the heat treatment, the cutting efforts can vary significantly and the structure and the grain size should be taken into account during the selection of input parameters in the micromilling process.
Table 5 exhibits the P values of the analysis of variance (ANOVA) for the mean of the responses. The P values indicate which of the effects in the system are statistically significant. If the P value is less than or equal to 0.05, the effect is considered significant. An α-level of 0.05 is the level of significance which implies that there is a 95% probability of the effect being significant. The value of “R2 adjust” shown in the ANOVA analysis indicates how well the model predicts responses for new observations. Larger values of the adjusted R2 suggest models of greater predictive ability [23, 24].
Analysis of variance for F x , F y , F z cutting force, and M z torque.
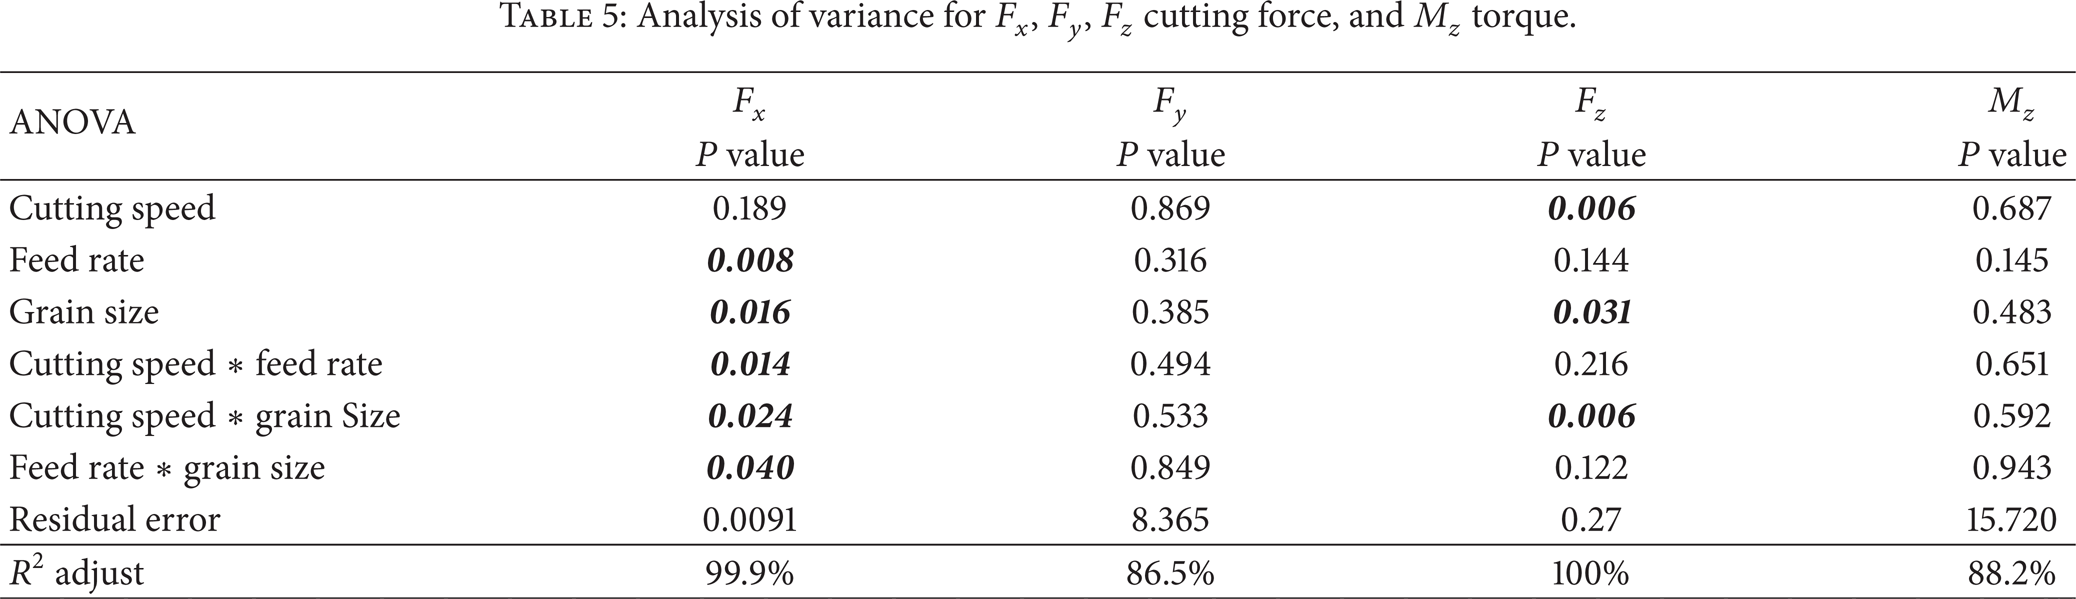
According to Table 5, the input parameters do not influence the F y and M z responses despite the fact that the depth of cutting has been maintained constant. However, the cutting speed, grain size, and the interaction of cutting speed and grain size is of influence on the F z force. It can be supported that when one or more interaction effects are significant, the factors that interact must be considered jointly. Thus, the variation of the cutting speed influences the F z force due to the decomposition of the three cutting vectors and it is more significant in the direction of the z-axis. As mentioned before, the grain size influences the responses because of the grain-boundary area that can vary according to coarse or fine-grain steel.
When the F x force that corresponds to the feed rate direction is considered, all input parameters have a significant effect on the response. As expected, the feed rate has more significance due to the smallest P value (0.8%). Thus, it can be supported that the feed rate variation is of great influence on cutting forces in the micromilling process, just as is the case in macromilling. However, with respect to grain size variation, generally fine-grains are used to provide a more resistant internal structure. The use of fine-grains generates an increase in stiffness, which may significantly increase the life of a metallic structure. Based on this, one should keep in mind that the use of fine-grains also causes an increase in the cutting force during micromilling.
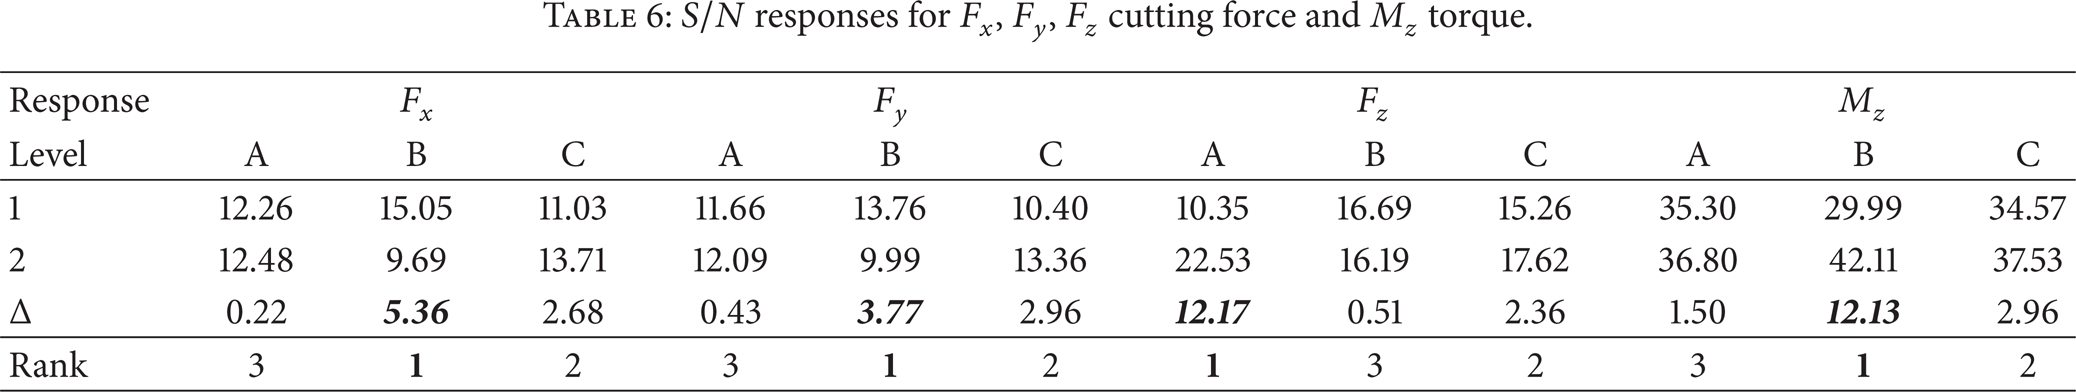
Table 6 shows the S/N response for F x , F y cutting force and M z torque, with the feed rate being the parameter with the highest variance when the different S/N ratios between maximum and minimum are considered. As depicted in Table 6, the F z force response with different S/N ratios occurred with cutting speed variation due to the highest Δ value. It is noteworthy that, when the grain size variation is considered, the use of fine-grains is the second most important input parameter to reduce the cutting force.
S/N responses for F x , F y , F z cutting force and M z torque.
4. Conclusions
In this study, the Taguchi method was used to obtain optimal milling parameters in micromilling of AISI H13 steel with different grain sizes under dry cutting conditions. The results can be summarized as follows.
The optimum levels of the control factors to obtain lower cutting forces were a grain size of 497 μm, feed rate of 1 μm, and cutting speed of 33 m/min. Moreover, the input parameters do not influence the F y and M z responses.
As a result of experimental trials performed using the Taguchi method, it was found that the feed rate was the most significant factor affecting the cutting forces with a 55% and 37% contribution for F x and F y , respectively. When grain size was considered, it was the second most significant factor affecting F x and F y force, with a 28% and 24% contribution, respectively.
The test results showed that the values were within the calculated confidence interval with a significance level of 5% (or 95% confidence level).
Finally, the results showed that it is important to set the input parameters at the lowest values of the range recommended by the tool's supplier in order to minimize the cutting force and avoid breaking the cutter.
Conflict of Interests
The authors declare that there is no conflict of interests regarding the publication of this paper.
Footnotes
Acknowledgment
The authors would like to thank the SANDVIK Coromant for supplying the tools.