
Abstract
As the key node of public transportation system, subway station has many functions such as attracting and distributing passengers and guiding the transfer from various traffic modes to subway. However, the poor facility scale and layout around subway stations in practice usually cause the inconvenience of transfer and low transfer efficiency, which causes the declination of travel efficiency and even loose of subway passengers. Taking subway stations as the study objects, this paper has emphasis on the connection characters between various traffic modes and subway stations. Considering the attraction region, the total transfer time, transfer distance, and connection cost were selected to form the efficiency index of connection layout of subway stations. Data envelopment analysis (DEA) model is applied in the quantization of traffic resource consumption and output. At last, connection facility layout model of subway stations was established with the aim of improving the transfer efficiency. Meaningful results were obtained from the connection layout model of subway stations, which guide the planning and designing of the transfer facilities around subway stations.
1. Background
Along with the development of economy and technology, subway traffic has formed the framework of urban transportation. As the key node of subway networks, subway stations have many functions such as attracting and distributing passengers and guiding the transfer from various traffic modes to subway. Rationality of connection facility layout is directly related to the efficiency of subway station and even the whole traffic network. Efficient subway stations can provide passengers with convenient and effective transfer services, reduce the transfer time and walking distance, and optimize the configuration of service capacity, among others. Study about the transfer facility layout of subway stations is meaningful for improvement of transfer efficiency, optimization of city spatial structure, and fully utilization of traffic resources.
Scholars at home and abroad have achieved great progress in researches about subway layout, pedestrian characteristics, transfer efficiency, connection traffic modes, and so on.
Some researches focused on facility layout and design. Montreuil and Ratliff [1] proposed a methodology for characterizing and locating input/output stations within a facilities layout, with the objective of maximizing flow efficiency. Tsang and Ho [2] presented a simulation model development of passenger flow in a metro station, and an example was provided to demonstrate the application. Lee [3] proposed an integrated model that estimates the total walking time of a passenger by simulation and searches for a near optimal layout by ant colony optimization. Diego-Mas et al. [4] put forward a two-phase genetic algorithm that is able to solve facility layout problems strictly respecting the geometric constraints imposed on activities. Azadivar and Wang [5] presented a facility layout optimization technique that takes into consideration the dynamic characteristics and operational constraints of the system as a whole which overcame the limitations of traditional layout optimization methods and is capable of finding optimal or near optimal solutions. Dickins [6] paid attention to park and ride facilities on light rail transit systems and drew a conclusion about the most suitable types of location for facilities.
Some scholars paid more attention on the location of the subway station [7–10]. Vijayakumar et al. [11] point out that methods for estimating pedestrian access distance and number of boarding per transit stop can easily be transferred to estimating driving access distance and the number of hoardings per station in the park-and-ride context. The model for passenger hoardings by station can be used for estimating either demand for a planned station or the effect of service interventions on hoardings at existing stations. Optimization model was developed to address the problem of increasing the share of rail in intermodal transport through the use of hub-and-spoke type networks for freight rail [12], and two-stage analytical model about identifying feasible locations or rail transit stations was studied [13]. The relationship among urban transit, land development, and the local state was also analyzed [14].
Concerning the designing and construction of subway stations, Reinthaler and Zajicek [15] and Anagnostopoulos et al. [16] do some research on microsimulation model of pedestrian circulation in rail transit stations. Some scholars focused on the characteristics of various traffic modes and transfer behavior of passengers and potential improvements for optimizing connectivity and accessibility of subway stations were proposed [17–22]. Some success in public transport networks and the demand and supply of transport market were achieved [23–26]. DeMello et al. [27], Kim et al. [28], and Brierley and Drake [29] studied the service coverage characteristics of buses and subways and provided the basic data and techniques to be used for establishing the service coverage and gave some advices on design and construction of subway stations.
There has been great progress on theory and practice of subway stations. However, there are still some problems concerning the transfer facilities and the layout of subway stations. This paper describes a connection layout model based on the total transfer efficiency of all the passengers. The remainder of the paper is structured as follows. Section 2 discusses the attractive region of subway stations and forms an efficiency index for transfer connection layout. Section 3 discusses the efficiency evaluation method of connection layout of subway stations and presents the survey method for all the input and output indexes. Application of the proposed method to 6 subway stations in Beijing, China, was demonstrated and analysis results were also presented in Section 3, followed with the conclusions in Section 4.
2. Connection Facility Layout Model of Subway Stations
There are many advantages of subway traffic, such as large capacity of passengers, satisfactory speed, time reliability, less pollution, and energy consumption. However, due to the low density of subway traffic network in many cities, passengers rely on other traffic modes to realize the connection between origin or destination and the subway station. There are so many traffic modes that play the connection role in practice, such as bus, taxi, car, bicycle, and walking. No matter which mode is used, the final aim of passengers is to realize the transferring to subway traffic and complete their trip rapidly, safely, and conveniently. For example, passengers who utilize private car to subway station will be more satisfied if the distance from park to subway station passageway is shortened, while passengers from buses pay more attention to the reliability of buses and the distance from bus stop to the subway station. Therefore various connection modes compete around the limited land use around subway stations. For subway planning and management, the key problem is to provide reasonable connection facility layout, improve transfer efficiency, and help passengers transfer from other modes to subway conveniently.
2.1. Attractive Region of Subway Stations
Attractive region of subway stations is divided into direct attractive region and indirect attractive region. Direct attractive region is the distribution region where passengers can reach the subway station by walking. Direct attractive region is related to the attractiveness of subway stations. The more attractive the station is, the more extensive the attractive region is. Attractiveness of subway station is influenced by the area of the station, average transfer distance, average queuing time, number of buses connected, the location of the station, the capacity of park, and so forth. Restricted by economy and technology, the low density of subway traffic network makes the distance between each station exceed the direct attractive region of subway stations. Passengers who are not in the direct attractive region are inconvenient to use subway stations. In order to improve the utilization of subway and achieve a sustainable development of subway traffic, passengers from indirect region should also be attracted to subway stations. Indirect attractive region is the distribution region where passengers should reach the subway station by other traffic modes except walking, which is related to the attractiveness of subway stations as well as the accessibility and efficiency of connection traffic modes.
Taking characteristics of passengers in direct attractive region and connection traffic modes into account, this study analyzes the basic law of transfer volume and then forms a connection facility layout model.
2.2. Efficiency Index of Connection Facility Layout of Subway Stations
In order to make clear the passenger characteristics when transferring at subway stations as well as the attention degree of various factors, investigation at 15 typical subway stations in 5 metro lines was carried out in September, 2012. Passengers were asked to select the most important factor among walking distance, transferring time, the connection cost, comfort degree, and reliability. 1531 valid samples were got. The results show that passengers pay more attention to walking distance, transferring time, and the connection cost. Ratio of various factors selected to be the most important factor is shown in Table 1.
Ratio of various factors selected to be the most important factor.

Walking distance, transfer time, and connection cost were selected to form the efficiency index of connection facility layout of subway stations as follows:
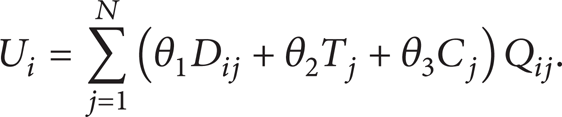
U i is efficiency index of connection facility layout of subway station i; N is the number of traffic modes that connect with subway station i; D ij is the walking distance from connection mode j to subway station i, meter; Q ij is the transfer passenger volume between connection mode j and subway station i, person/min; T j is the average time of connection mode j, min; C j is the average cost of connection mode j, yuan; and θ1 ∼ θ3 are coefficients that are corresponding to variables D ij , T j , and C j .
D ij can be easily got by measuring the real distance between the point that passengers got off traffic mode j and the entrance of subway station i. Q ij , which has been discussed by many researchers in the past decades [30], should be calculated or forecasted by dependent factors, such as population, area, and economy.
In the following, we emphasize the calculation of T j and C j .
2.2.1. Connection Time T ij
For different connection modes, connection time T ij (min) is probably constituted by waiting time Tij1, traveling time Tij2, and parking time Tij3, as shown in Table 2.
Constitution of connection modes.

Walking, bicycle, and car can provide door to door service; Tij1 for these three modes equals zero. Concerning about taxi, according to investigation results in September, 2012, when waiting time exceeds 5 min, passengers will give up taxi and transfer to other traffic modes. Tij1 equals 5 min for taxi in this study. So the average waiting time of passengers who reach subway stations by bus should be discussed as follows:

K is the total number of bus lines in the indirect attractive region of subway station i and t kij is the average departing time interval of bus line k.
Tij2 can be calculated by the ratio of attractive region radius of subway station i and the average speed of connection mode j as the following formula:
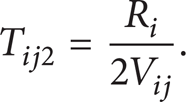
R i is the radius of direct attractive region for walking and the indirect attractive region for other connection traffic modes.
V ij is the average speed of the connection mode j in attractive region of subway station i.
According to investigation results in September, 2012, Tij3 is 0.5 min for passengers by bicycle and 1 min for passengers by car.
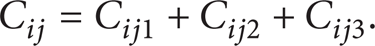
2.2.2. Connection Cost C ij
For different connection modes, connection cost C ij (yuan) is probably constituted by ticket Cij1, fuel cost Cij2, and parking cost Cij3, as shown in Table 3:
Cost constitution of connection modes.

Cij1 for taxi can be calculated by the product of attractive region radius of subway station i and the average cost rate as the following formula:

CR j is the cost rate of model j.
3. Evaluation Model of Connection Facility Layout of Subway Stations
3.1. Basic Method
Data envelopment analysis (DEA) is a methodology, developed by Charnes, Cooper, and Rhodes (1978), for measuring the relative efficiency of peer decision making units (DMUs) that have multiple inputs and outputs.
Suppose that there is a set of n decision making units (DMU) denoted by U k (k = 1, 2, …, n) to be analyzed and each of which employs a variable amount of m different inputs to produce s different outputs and, specifically, consumes amount x ik of input i and produces y rk of output r. Then we can denote the inputs and outputs by X k = (x1k, x2k, …, x ik , …, x mk ) T and Y k = (y1k, y2k, …, y rk , …, y sk ) T separately. x ik denotes the wastage of decision making unit k to resource i, and y rk denotes the sendout of decision making unit k to output r:

DEA optimization treats the observed vectors of inputs X k and outputs Y k as given and chooses values of input and output weights for particular u r and v i with respect to the following inputs minimizing optimization problem:
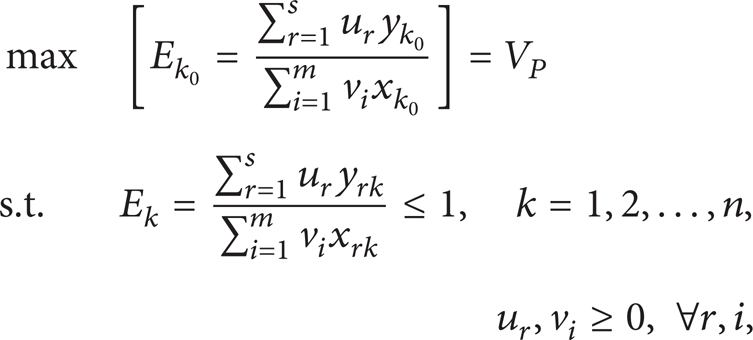
where u r is the weight for output r and v i is the weight for input i.
Problem (7) can be converted into a linear form, by replacing the nonnegativity constraints for the weights in (7) by v i ≥ ∊ and u i ≥ ∊, where ∊ is an infinitesimal constant:

where λ k are the weights on DMU j , s− are the input slacks, and s+ are the output slacks. A DMU is efficient when the optimum θ equal one and all slack variables s− and s+ equal zero; otherwise it is inefficient. In other sides, 1 − θ shows the necessary proportional reduction of all inputs of the DMU being evaluated in order to achieve the efficient frontier.
3.2. Example for Connection Facility Layout Evaluation Model of Subway Station
3.2.1. Evaluation Index System of Connection Facility Layout
Evaluating the efficiency of connection facility layout of subway stations can help analyzing stations’ relative transferring efficiency and the utilization of transfer facilities. According to principle of input and output indexes and taking into account conveniences of quantifying, evaluation index system of connection facility layout is determined as shown in Figure 1.
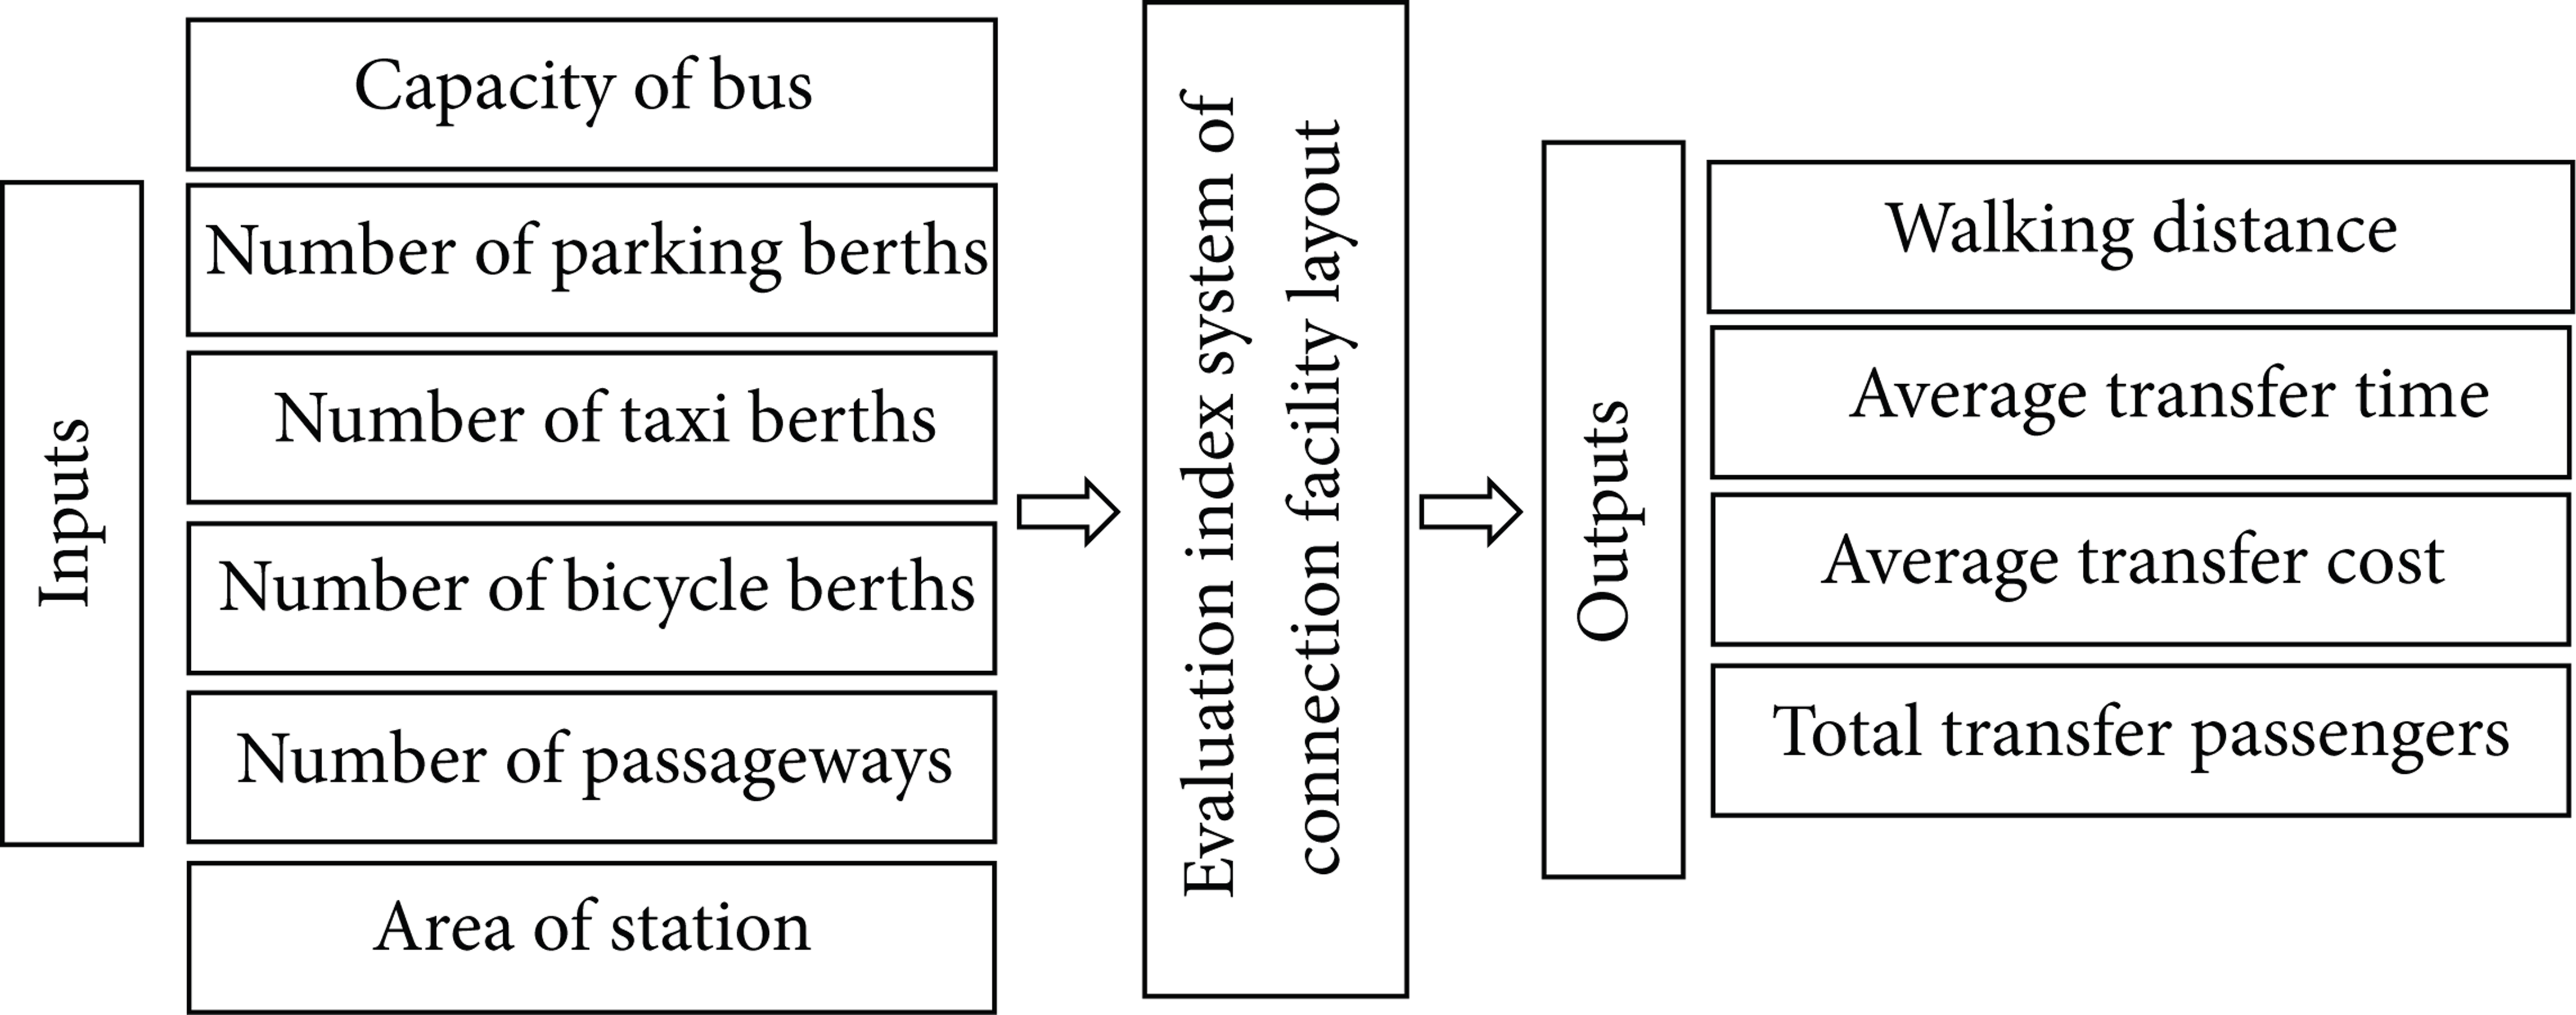
Evaluation index system of connection facility layout.
3.2.2. Calculation of Evaluation Indexes
Capacity of Bus C i . Capacity of bus refers to the total capacity of all the buses near subway station, which can be calculated by the product of number of buses which reach station i in unit time and the capacity of each bus.
Walking Distance D i . Walking distance is the average walking distance of all the connection modes in subway station i. For example, walking distance of bus is the distance from bus stop and the passageway of subway station and walking distance of car or bicycle is the distance from passageway of park and subway station:

where Q i is the total transfer passenger volume of subway station i.
It is worth mentioning that subway station is more effective with lower input and greater output. Walking distance, average transfer time, and average transfer cost are unexpected indicators in the efficiency evaluation model. Therefore, further calculation should be done.
3.3. Data and Results
Six typical subway stations were selected to explain the methods above. The raw data of the six stations, which was calculated based on investigation during morning peak hours in September, 2012, is shown in Table 4.
Raw data of the 6 subway stations.

Based on the raw data in Table 4, the efficiency score and ordering results of the 6 subway stations are obtained, as shown in Table 5.
Efficiency results of the 6 subway stations.
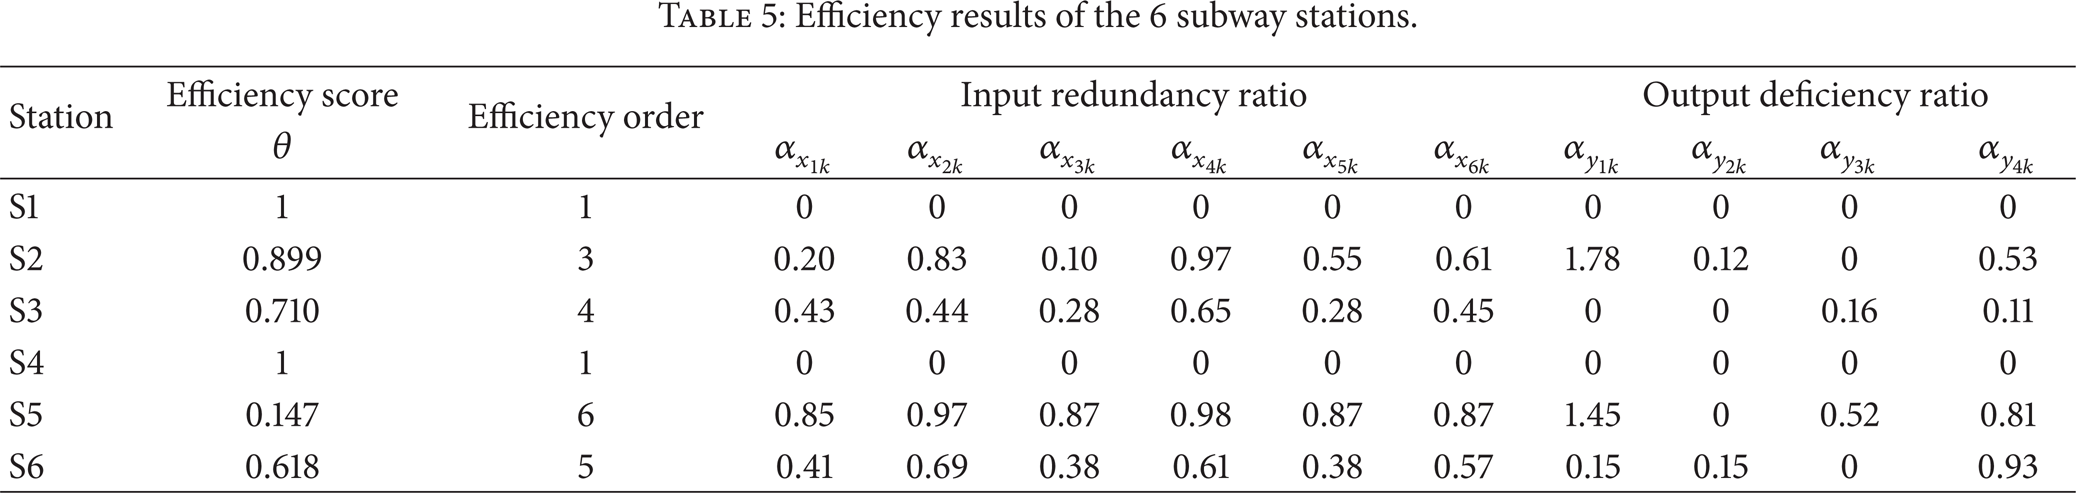
From Table 5, it can be seen that the efficiency score of Station 1 and Station 4 is 100% and these two stations are effective stations. The inefficient stations are Stations 2, 3, 5, and 6, among which Station 5 is the most inefficient one.
In order to improve the efficiency of inefficient subway stations, analyze the key reasons that influence the total efficiency and calculate the potential improvements of the efficiency indicators for each inefficient subway station. Input redundancy ratio and output deficiency ratio indicate the necessary decrease of input indexes or necessary increase of output indexes.
4. Conclusions
Facility scale and layout around subway stations have great influence on the inconvenience and transfer efficiency of subway stations. Taking the total transfer efficiency of all the passengers transferring at subway station as the target function, this paper describes a connection facility layout model based on the attractive region of subway stations. Furthermore, the efficiency evaluation method of connection layout of subway stations was discussed, and the survey method for all the input and output indexes was explained. From the results, the inefficient subway stations could be distinguished, and the potential improvements of the efficiency indicators were analyzed. In further research, more stations should be studied and classified, which need to consider using two-stage EDA model.
Conflict of Interests
The authors declare that there is no conflict of interests regarding the publication of this paper.
Footnotes
Acknowledgments
This research was supported by National Nature Science Foundation of China (no. 51108028 and no. 51308017), Beijing Higher Education Young Elite Teacher Project (YETP1216), Programme of Introducing Talents of Discipline to Universities (no. B12022), and Beijing Nova Program (Grant no. Z141106001814110).