
Abstract
We suggest a method of effectively detecting and classifying network traffic attacks by visualizing their IP (Internet protocol) addresses and ports and clustering the visualized ports based on their variance. The proposed approach first visualizes the IP addresses and ports of the senders and receivers into two-dimensional images. The method then analyzes the visualized images and extracts linear and/or high brightness patterns, which represent traffic attacks. Subsequently, it groups the ports using an improved clustering algorithm, allowing an artificial neural network to learn the extracted features and to automatically detect and classify normal traffic data, DDoS attacks, DoS attacks, or Internet Worms. The experiments conducted in this work prove that our suggested clustering-based algorithm effectively detects various traffic attacks.
1. Introduction
The Internet serves users in good and bad ways: it delivers useful information and can be used for traffic attacks. Network attacks can threaten the stability of the Internet, causing a great deal of damage. Therefore, it has become necessary to develop the technology for detecting traffic attacks automatically [1–4].
There are many techniques to detect network traffic attacks. Among them, the technique of visualizing security events has recently drawn much attention [5–8]. The technique is used to extract specific information from massive events occurring on the network and then to visualize event details on a 2D or 3D format. Accordingly, it provides a way of analyzing network security circumstances quickly and effectively. In particular, because it is to its advantage to present the patterns of different network attacks clearly, the approach helps users recognize network attacks intuitively.
Therefore, this paper suggests a method of effectively detecting and classifying network traffic attacks by visualizing their IP addresses and ports into two-dimensional images and clustering the visualized ports based on their variance.
The method suggested in this paper is to automatically detect and classify three major network traffic attacks: Distributed Denial of Service (DDos), Denial of Service (DoS), and Internet Worm. Each of the network traffic attacks is briefly described as follows.
A DDoS attack is an attempt to make multiple infected hosts send meaningless packets to target hosts, thereby causing an imbalance of resources between target hosts and the Internet [9, 10]. In other words, it distributes multiple attackers and makes them carry out their operations at the same time in order to attack a specific site. During the attempt, multiple floating sender IP addresses attack one receiver IP address simultaneously so that the sender IP address and the receiver IP address have the relationship of
A DoS attack is an attempt to block target hosts from giving or taking services in a normal way [11, 12]. It aims to attack target systems maliciously and thereby make their resources unavailable. Examples of the attack would be making multiple attempts to access to a specific server to block user access and completely consuming TCP (transmission control protocol) connections of a specific server. Under the DoS attack, one sender computer has access to one receiver computer through different ports so that the sender IP address and the receiver IP address have the relationship of 1 : 1, and the sender port and the receiver port have the relationship of
An Internet Worm is a type of malicious software that self-replicates, being similar to a computer virus program [13, 14]. Whereas virus programs are parasitic on other execution programs, Internet Worms run independently of other execution programs. Usually, an Internet Worm damages networks and consumes network bandwidth. Unlike DDoS, an Internet Worm forces a single computer to access multiple computers for infection; in other words, one sender IP address is used against multiple receiver IP addresses. Accordingly, the sender IP address and the receiver IP address have the relationship of
Aside from these attacks mentioned above, we can find other network traffic attacks, such as Port Scan, in the related literature [10, 14].
Figure 1 illustrates the overall flow of the proposed method of detecting network traffic attacks. As shown in Figure 1, the method proposed in this work first receives the IP addresses and ports of traffic data, visualizes them into two-dimensional images, and extracts the patterns with high brightness values and linear patterns. It then clusters the visualized ports and allows an artificial neural network to learn the extracted features to automatically detect normal traffic data, DDoS attacks, DoS attacks, or Internet Worms.
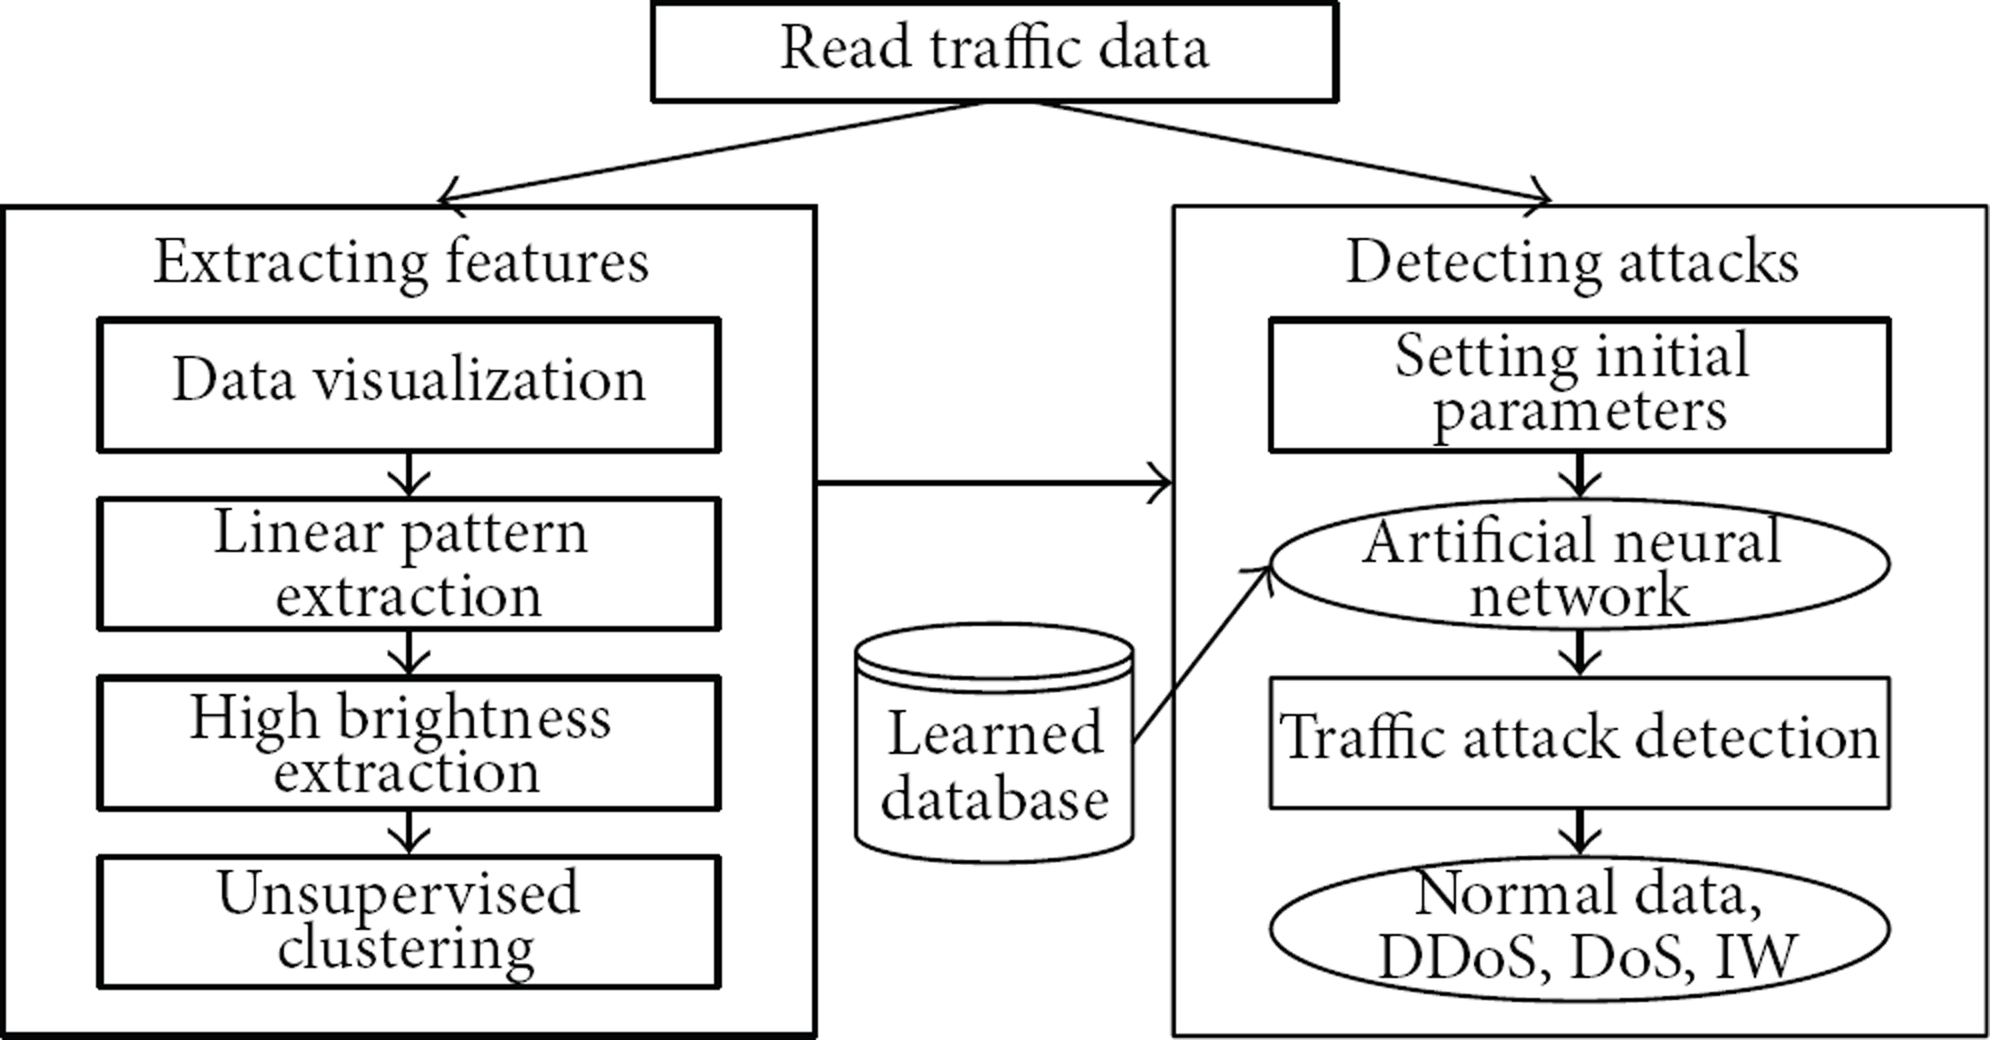
Overall flow of traffic attack detection.
In Section 2, related studies are described, and the method of visualizing traffic data and extracting their features is explained in Section 3. In Section 4, a method of clustering ports by an improved clustering algorithm and a method of detecting abnormality in network traffic data through an artificial neural network are described. In Section 5, experimental results are presented. In Section 6, conclusions of this work and a direction for future research are presented.
2. Related Work
There is much literature related to methods of detecting network traffic attacks. To judge network traffic attacks, a network administrator analyzes the variance of the sender IP addresses of traffic data, the concentration of traffic data by IP address, the variance of the receiver IP addresses and their traffic concentration, and the traffic concentration and variance by port number of each sender or receiver. However, such a process is not systemized and often performed manually. Furthermore, given a constant increase in network traffic, it is difficult for a network administrator to analyze the status of network security with the use of conventional methods.
In these circumstances, the technique of visualizing security events has recently drawn much attention. It is used to visualize massive events occurring on networks in real time. One of its advantages is the capability of quickly, easily, and accurately conveying a great deal of security information to a network administrator. As such, there are methods of visualizing network traffic information and detecting traffic attacks on the network [5–8].
For visualization of traffic information, Jeong et al. use an IP grid to present an IP address through extraction of the 5-tuple information of an event (sender IP address, sender port, protocol, receiver IP address, and receiver port) and a protocol cube to present the protocol and frequency of each port number. Their method helps a network administrator intuitively recognize and analyze network abnormality and quickly and accurately judge network security circumstances [5]. However, because the method uses lines to visualize security event information on a three-dimensional image, it is limited by the number of events to be processed every second, which should be improved.
The method proposed by Yin et al. consists of an external view which displays the information on the connection between internal and external Internet domains, a domain view which displays the information on the connection between the chosen domains and internal domains, and an internal view which displays the information on the connection between hosts of an internal domain [6]. A connection line which presents traffic flow becomes darker as traffic becomes heavier. The color of a connection line represents a previously defined domain. Because the method focuses on connection information, it fails to visualize the amount of use by port, continuity of each port, and other types of relevant information. In addition, it presents hosts and domains in one parallel line so that it is difficult to recognize them intuitively.
The method proposed by McPherson et al. presents port information according to the lapse of time, visualizing each port's traffic data used at a specific time [7]. In addition, it serves the function of presenting the traffic data statistics of a specific port at a specific point in time. Therefore, it is easy to detect network abnormality. However, because it visualizes port information with the use of statistics alone, it fails to show traffic flow, and it is hard to recognize source and destination addresses. Therefore, for more detailed analysis of network abnormality, the access to the original data of security events is required.
Aside from those previously mentioned, many different methods of visualizing security events have been repeatedly introduced [8].
3. Visualization of IP Addresses and Ports
In this paper, the IP addresses and ports of network traffic data are visualized into two-dimensional images. With the assumption that an IP address consists of a.b.c.d, one point is created in a proper location in Figure 2(a) presenting a and b, and the other point is created in a proper location in Figure 2(b) presenting c and d. When points are repeatedly generated in the same location, their brightness values increase by one. Finally, each point's brightness value, which is a number between 0 and 1, is saved after being normalized.

Example of IP visualization.
In the case of port visualization, sender and receiver ports are normalized to a number between 0 and 255 and then visualized into a two-dimensional image, as shown in Figure 3.

Example of port visualization.
In this paper, visualized IP addresses and port images are analyzed in terms of linear patterns and brightness to detect the types of traffic attacks. As for traffic images of DDoS attacks, in the IP_ab and IP_cd images of sender IP, a great number of senders concentrate on one receiver in the IP_ab and IP_cd images of receiver IP. Accordingly, by verifying whether there are any linear patterns in the images of sender IP or whether there are any patterns with high brightness values, it is possible to judge if DDoS attacks occur.
In each traffic IP image of DoS attacks, no linear pattern is found. However, it is possible to extract IP addresses with remarkably high brightness values. A sender IP address and a receiver IP address with high brightness values are an attacker and a victim, respectively. Because a sender transmits excessively massive data to a receiver, regions containing remarkably high brightness values appear in each image. Such a feature is used to detect DoS attacks.
Generally, an Internet Worm damages networks and consumes bandwidth. Unlike a DDoS attack, an Internet Worm makes one computer access multiple computers for infection, as shown in Figure 4; again, one sender IP address is used to visit multiple receiver IP addresses. Therefore, the sender IP address and the receiver IP address have a relationship of
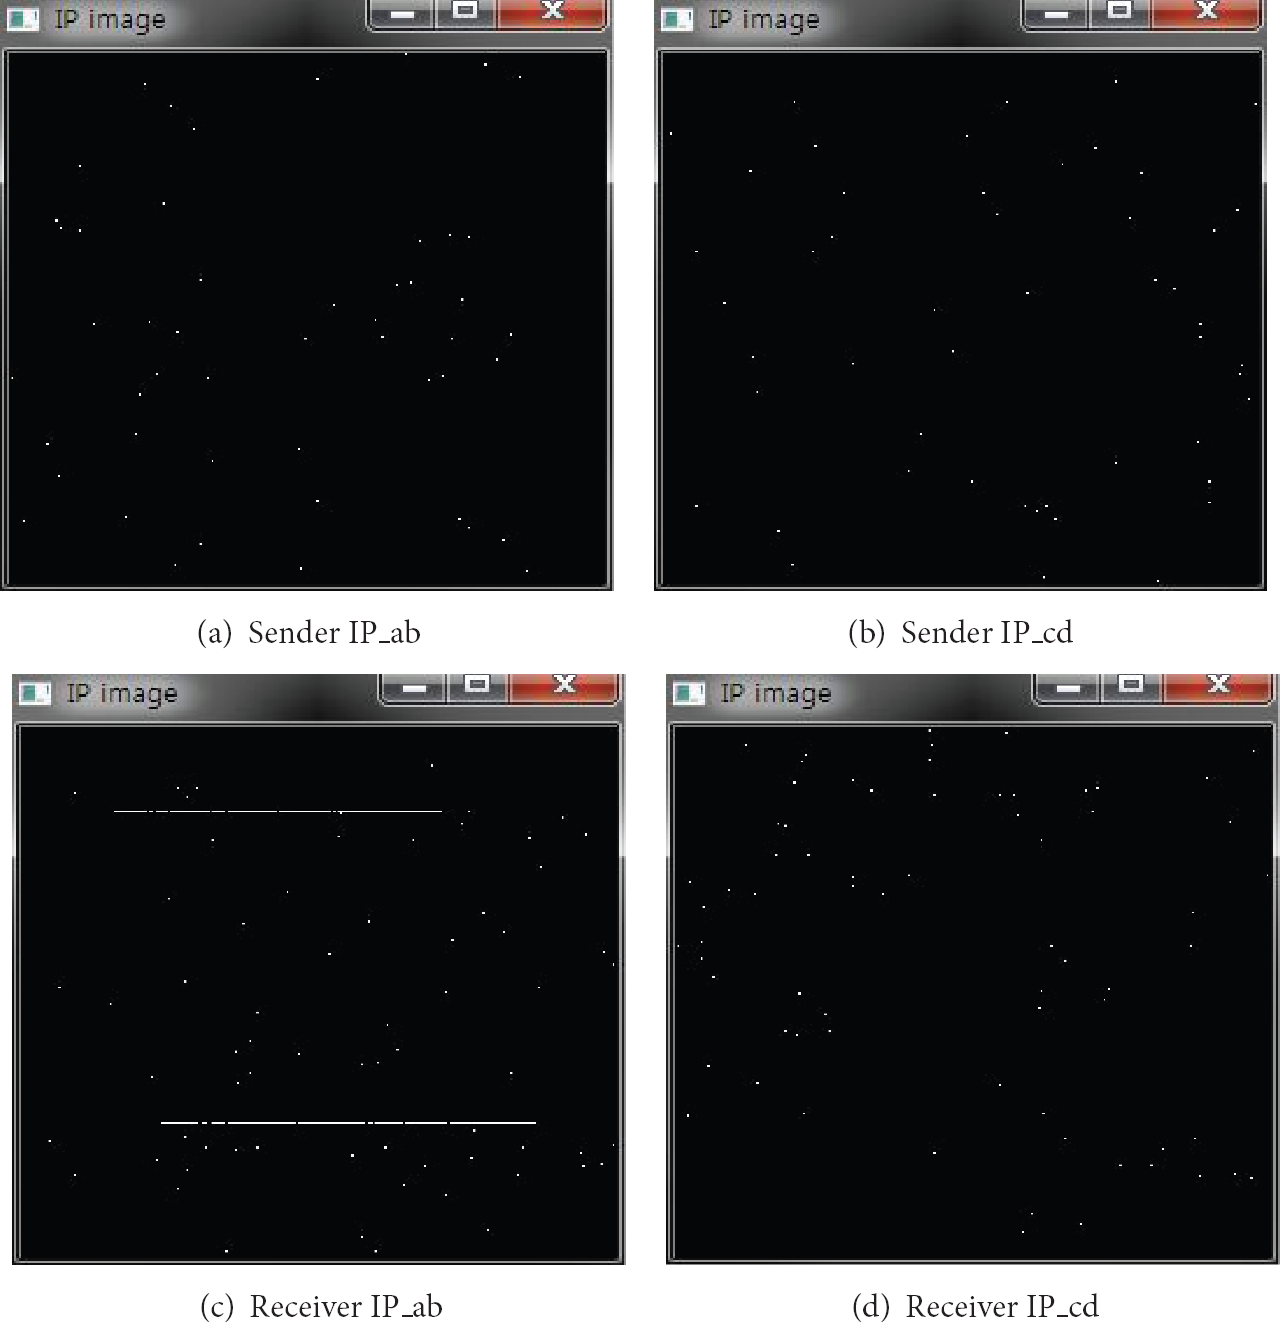
IP images of Internet Worm.
Figure 5 illustrates the characteristics of each network attack appearing in an image of sender and receiver ports. For example, Figure 5(b) presents a case where multiple sender ports try to connect one receiver port and features vertical linear patterns.

Port images.
In the five visualized images created in this manner, network attacks have linear patterns and high brightness values. Therefore, this paper first uses the Hough transform [15–17] to extract lines from IP addresses and port images and then applies (1) to set the longest line value normalized between 0 and 1 to the line feature

We apply (2) to extract the patterns with high brightness values from the five visualized images and then use them as the brightness feature

4. Analysis of Abnormal Patterns through Clustering
Normally, a method of visualizing network traffic data into two-dimensional images can be used to easily detect network attacks. However, the weakness of this method is that it is impossible to measure the volume of traffic data. Therefore, to address this drawback and guarantee accurate classification of network attacks, this paper suggests a method which uses clustering to measure the amount of traffic and its concentration and thereby distinguishes types of network attacks more accurately.
The proposed method in this paper employs an ISODATA clustering-based algorithm to cluster traffic data [18, 19]. The ISODATA clustering-based algorithm is an unsupervised algorithm that solves the weak point of k-Means [20] algorithm: setting up the number of clusters. Through splitting and merging, it is able to set up the number of clusters flexibly. Therefore, the algorithm can be applied to a case where the number of clusters is not decided, such as in the variance of network packet data.
Generally, the ISODATA clustering-based algorithm is performed as follows. First, the center of an initial cluster is generated in the space of data to be clustered. Second, each point of data is assigned to a cluster based on the proximity of the cluster's center. Clusters in which the number of data is lower than a certain number are removed, and their patterns are distributed to the remaining clusters. Third, the position values of the data included in each cluster are used to update cluster centers. Fourth, each mean distance between each cluster's center and data is calculated, and all of the calculated mean distances are used to calculate the mean distance of the entire data. Fifth, the number of clusters is reviewed to verify whether it falls below a threshold, and the variance of each cluster is measured. If a cluster's variance is large, two new centers are created using the data furthest from the cluster center. Sixth, it is determined whether the number of clusters is larger than a threshold, and the distance between clusters is calculated. If the number of clusters is larger than a threshold, clusters nearby are merged. Figure 6 illustrates the flowchart of ISODATA clustering algorithm.
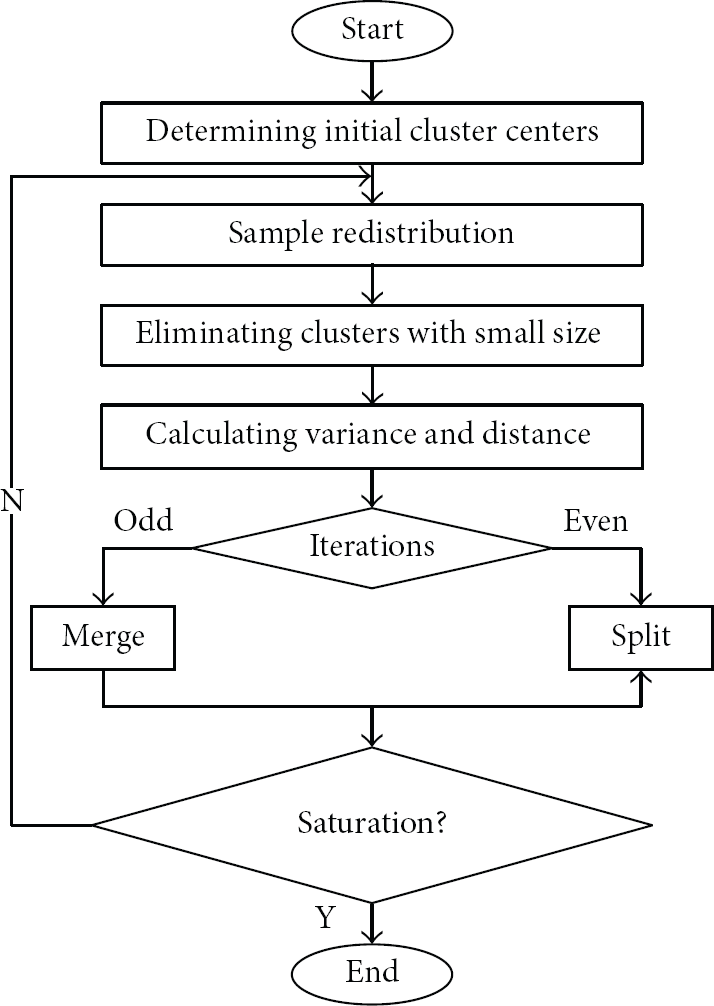
Flowchart of the ISODATA algorithm.
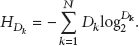
To improve the accuracy of the detection of network attacks, the suggested method clusters the sender and receiver ports of traffic data for the purpose of clustering data with similar patterns. The area to cluster traffic data is a 3D space which comprises the sender port's variance

In (3), N denotes the number of total events, and

As such, the calculated

3D clustering space.
This paper suggests an improved ISODATA clustering-based algorithm to cluster traffic data. To extract the features of traffic data more accurately, the step of removing unnecessary data with a variance larger than the mean variance is added to the existing ISODATA algorithm. Therefore, the improved clustering algorithm is presented as shown in Algorithm 1.
Step 1. Centers of initial clusters are created in the space of data to be clustered. Step 2. Each point of data is assigned to a cluster that has its nearest cluster center. Step 3. Clusters the number of which is lower than a certain threshold are removed, and their patterns are distributed to the remaining clusters. Step 4. The position values of the data located at a center of a cluster are used to update the cluster center. Step 5. Each mean distance of each cluster's center and data's position values is calculated Step 6. All of the calculated mean distances are used to calculate the mean distance of the entire data. Step 7. It is determined whether the number of clusters is lower than a threshold. Step 8. Each cluster's variance is measured. Step 9. The distance between clusters is calculated. Step 10. Each cluster's variance is calculated, and then the data with a larger variance than the mean variance are removed. Step 11. The result of clustering is printed out.
When the improved clustering algorithm is used, it is possible to cluster the data with similar patterns with the use of an x-axis variance, a y-axis variance, and an entropy. In this case, the data included in the same cluster have similar patterns on the network.
As a result, to detect traffic abnormality, the method proposed in this paper extracts the maximum brightness value, the maximum length of a linear pattern, the mean length of linear patterns, and the number of linear patterns from each image of the sender and receiver IP address and port and additionally extracts a sender port's variance, a receiver port's variance, the maximum entropy value, and the number of clusters from the port image.
This paper also allows an artificial neural network to learn the features extracted by the proposed method to classify traffic data into normal data, a DDoS attack, a DoS attack, and an Internet Worm. The data used for learning are artificially generated. Two hundred data, each of which has 10,000 IP addresses and ports, are each created by the type of network attacks.
5. Experimental Results
The proposed network traffic attack was implemented in Microsoft Visual C++ 2008 and tested in Windows 7 on an Intel Core2 Quad Q9400 2.66 GHz processor with 4 GB of memory. For the dataset for experiments conducted to detect abnormality in network traffic, each of the 100 data was generated based on the type of traffic attacks, and we collected packet header information from the created network attacks.
Tables 1, 2, and 3 present examples of patterns according to the types of network traffic attacks. The values of the tables are those of the features finally extracted by stepwise preprocesses. In this work, such values are used to detect any occurrence of network attacks.
Pattern of DDoS attack.

Pattern of DoS attack.

Pattern of Internet Worm.

Figure 8 illustrates an example of the lines detected from the network traffic data visualized into a two-dimensional image by the use of Hough transform.

Lines detected by the use of Hough transform.
Figure 9 illustrates the clustering results of ports by the use of the improved ISODATA algorithm proposed in this paper. Through the use of the method of removing unnecessary data, it was found that clusters were separated more effectively.
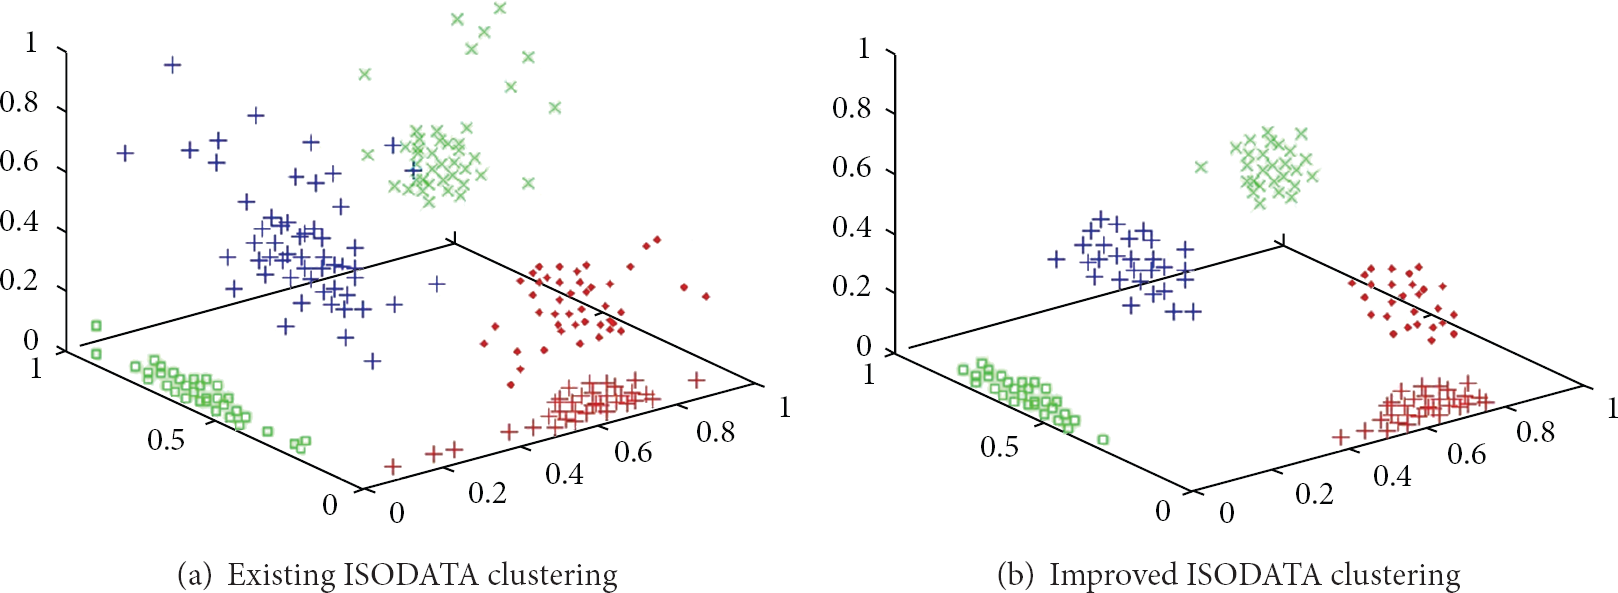
Improved clustering results.
We compared the performance of our suggested approach against those of such approaches as the existing clustering-based and line-based algorithms. To measure the accuracy of the proposed method of detecting network traffic attacks, we evaluated the performance in terms of “precision rate” and “recall rate” [23]. The precision rate depicts the ratio of the number of correctly detected network attacks against the total number of declared attacks, while the recall rate expresses the ratio of the number of correctly detected network attacks against the total number of actual attacks, as shown in the following equations:

In (6),

Precision rate.
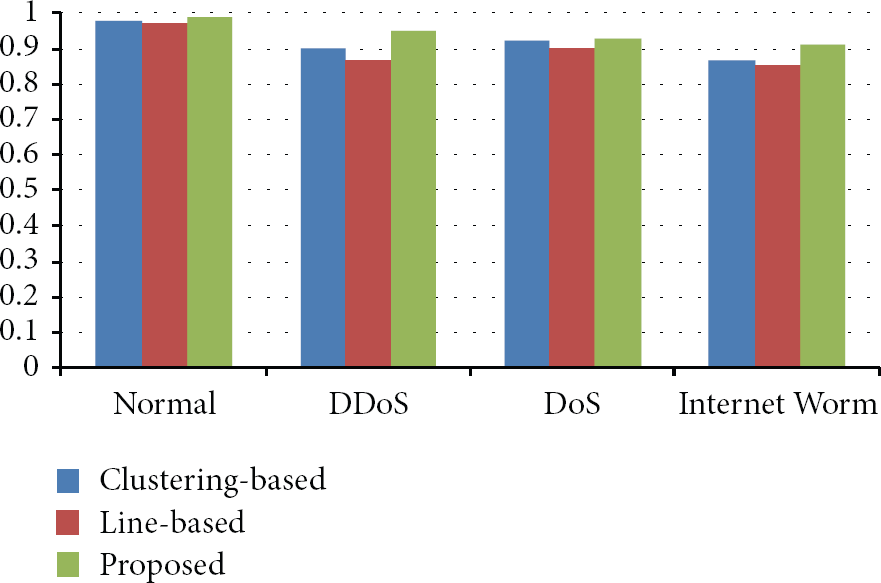
Recall rate.
As shown in Figures 10 and 11, the method proposed in this paper detected normal traffic data and attack traffic data more accurately than the existing clustering-based method. With regard to DDoS and Internet Worm attacks, the proposed method showed better performance than the existing one, and with regard to detection of normal data and DoS attacks, there was a narrow difference between the two methods. In particular, by removing unnecessary traffic data in clustering, the improved clustering-based algorithm improved the accuracy of detection of network attacks. The existing line-based algorithm produces the worst accuracy results because it attempts to detect network traffic attacks with the line information only. However, it shows the best results in terms of the computation time.
Although the proposed detection approach, compared to the existing clustering algorithm, had an additional step of removing unnecessary data with a larger variance than the mean variance, the increase in time calculation was negligible.
6. Conclusions
This paper proposed a method of effectively detecting and classifying network traffic attacks by visualizing their IP addresses and ports and clustering the visualized ports based on their variances. The proposed approach first visualizes the IP addresses and ports of senders and receivers into two-dimensional images. The method then analyzes the visualized images to extract linear patterns or patterns with high brightness values representing network attacks. Subsequently, it clusters ports according to their variances using an improved clustering algorithm and makes an artificial neural network learn the extracted features to let the network automatically detect normal traffic data, DDoS attacks, DoS attacks, or Internet Worms. The experiments conducted in this paper proved that the proposed method detected network traffic attacks in a relatively reliable way.
Our future work will include improving the performance of the general learning algorithm and thereby enhance the accuracy of detection and classification of network traffic attacks. In addition, we will focus on stabilizing the parameters used in the suggested approach by tuning them adaptively through various and repetitive experiments.
Footnotes
Conflict of Interests
The authors declare that there is no conflict of interests regarding the publication of this paper.
Acknowledgment
This research was supported by Basic Science Research Program through the National Research Foundation of Korea (NRF) funded by the Ministry of Education, Science and Technology (2011-0021984).