
Abstract
The relationship between quality abnormality and anomalous causes in the assembly process of CNC machine was described by fuzzy relation equations, because they were not one to one. The fuzzy relation equations were established according to the fuzzy relation matrix and membership degree of abnormality mode and were translated into optimal solution problems by fuzzy deconvolution method. The interval solution of the fuzzy relation equation was obtained by minimal mean square error of BP algorithm, realizing section locating of the contribution of anomalous causes to quality abnormality for a given problem, thereby gaining the optimal solution. Finally, the viability and effectiveness of this method were verified by the quality abnormity diagnosis in the assembly process of a NC rotary table.
1. Introduction
Assembly is the last link in the product-form process and also is the key important link determining the product quality [1]. Different assembly control methods may cause products of different quality using the same parts. Some domestic high-grade CNC machine tool manufacturers purchase high quality parts and components from abroad to assemble, but the product reliability can hardly reach the level of foreign countries. Practice shows that scientific assembly technology can greatly improve the product quality with the same parts [2]. The foreign research about the assembly quality control has provided valuable methods and means for the prevention and control of products quality. Wang and Geng [3] predicted and evaluated the potential quality loss in the preparation stage before the assembly of mechanical product. Zhang and Ge [4] proposed the concept of defects source entropy that target assembly quality in the assembly process of mechanical product. Liu et al. [5] categorized the anomalous causes of assembly quality abnormality and analyzed the collected information that abnormality control required. Literatures [6–8] applied the decision tree, expert system, and artificial neural network to the quality diagnosis and control in manufacturing process. Literature [9] showed an evaluation method of assembly quality for automotive BIW. Literature [10] presented a quality control method for a mixed model assembly line.
Assembly is a very complicated process, which includes a lot of factors probably causing abnormal quality. To improve the reliability, accuracy, accuracy preservation, and other key quality characteristics of a machine, it is important to match quality abnormality with the anomalous cause. However, there are few studies concerning the relationship between quality abnormality and the anomalous cause in the assembly process.
There is no simple corresponding relation between assembly quality abnormality and the anomalous cause, and fuzzy relation equations were adopted to describe this relationship in the current paper. Fuzzy relation equations are an important part of fuzzy mathematics, which is the mathematical description of inverse thinking activity of human's brain, that is, inferring causes according to results [11–15]. Fuzzy relation equations can reasonably describe the fuzzy relationship between abnormalities and anomalous causes. This paper firstly established the fuzzy relation equations to describe the mathematical relationship between quality abnormality symptoms and anomalous causes in the assembly process, adopted membership function and fuzzy relation matrix to describe the quality abnormal state in the assembly process, fuzziness, and uncertain information in the environment, and then applied the improved BP algorithm to get the approximate solution to the fuzzy relation equations through the fuzzy deconvolution method. The parameters in the membership function of anomalous causes were continuously adjusted according to the “minimum mean square error” rule in learning program of BP algorithm, so as to get the internal solutions. Finally, the feasibility of the method was verified by the assembly process of an NC rotary table.
2. Fuzzy Relation Equations of Assembly Quality Abnormality
The set of all possible anomalous causes in the assembly process of CNC machine is labeled X = (X1,X2,…, X m ), where m is the number of the anomalous causes, and the set of corresponding abnormal symptom is labeled Y = (Y1,Y2,…, Y n ), where n is the number of the kinds of abnormal symptoms.
The number of the observed abnormal symptom samples is labeled (y1,y2,…, y n ), and u Y i (y i ) is the corresponding membership degree of each component Y i to the symptom Y i . The abnormal symptom can be described with a fuzzy vector as follows:

Suppose that all symptoms of quality abnormality are caused by the anomalous cause x, and u X j (x) is the membership degree of x to each anomalous cause; then the anomalous cause can be expressed using the fuzzy vector as follows:

There exists a cause-and-effect relationship between the anomalous cause and abnormal symptoms; thus according to Zadeh composite inference rules, the fuzzy relation equations between the Y and X can be expressed as follows:

where ∘ is the fuzzy composite operator. In addition, the min-max composite operator was selected in this paper. Assume that
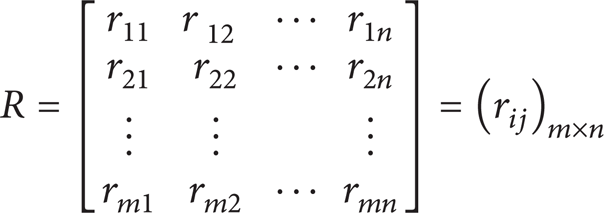
is the fuzzy relation matrix, where r ij ∈ [0,1], i = 1,2,…, n; j = 1,2,…, m denotes the contribution of the ith kind of cause to the jth kind of abnormal symptoms; that is,

According to the known fuzzy relation matrix R and the fuzzy abnormal symptom vector Y, the solution of the corresponding anomalous cause vector X is equivalent to the solution of below fuzzy relation equations,

where operators ∧ and ∨ were labeled min and max, respectively. Hence the above equation can be simplified as

3. Solution of Fuzzy Relation Equations Based on BP Algorithm
The fuzzy inference method of fuzzy systems often depends on a series of subjective parameters such as fuzzy membership function and fuzzy relation matrix. The way to determine these parameters will largely affect the root during the solution of fuzzy relation equations. This paper gained the approximate solution of fuzzy relation equations using BP algorithm through fuzz deconvolution operation.
BP algorithm is also called Error Back-Propagation Algorithm, which is a directed learning algorithm used in the learning of the weight and threshold of BP net. The derivation of this learning plan is based on least mean-square error rule. When a sample (set as the Pth sample) is input to the net and generates output, the mean square error is the sum of the square error of each output unit.
3.1. Selection of Approximating Function
In many cases, there is no precise solution to the fuzzy deconvolution problem, so, to determine A in the fussy relation equations A∘B = B, a natural method by minimizing is as follows:
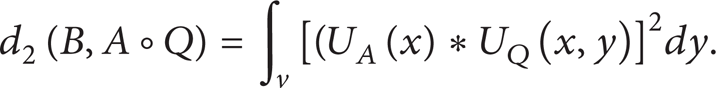
The above formula is the least squares solution; in order to minimize and simplify it, we should firstly complete the following two steps:
(1) transform U A (x) into Gaussian function:

where x and σare free parameters;
(2) sample within the entire region of the U and V.
For xi and y j (i = 1, 2, 3,…, m;j = 1, 2,…, n), (3) can be approximated by
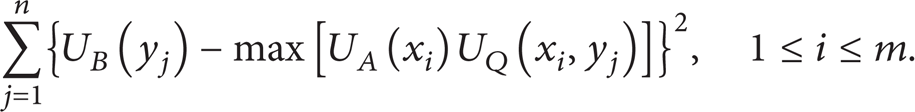
Therefore, the problem can be converted into the solution of parameters x and σ, which minimizes (10). And the minimization of (10) is the basis of derivation of the learning plan in BP algorithm.
3.2. Selection of the Learning Rate of BP Algorithm
In accordance with the traditional BP algorithm, the learning rate is constant in the calculation and is expressed as η(n), where the learning rate η(n) invariably equals η(0). This is the simplest form of the learning rate. It is easy to calculate, but hard to satisfy the overall performance of the system. In order to solve practical problems, the parameter of learning rate should be variable as needed, so as to guarantee the convergence of stochastic approximation algorithm. Search-then-converge schedule learning rate was adopted in this paper,

where η0 and τ are the user-selected constants and n is iterations. After the learning rate is chosen, the algorithm will operate in the form of a traditional stochastic approximation algorithm, and weights will converge to the optimal value. The BP algorithm using search-then-converge schedule learning rate is defined as the improved BP algorithm.
3.3. Solution of the Improved BP Algorithm
We use U
A
(x)U
Q
(x,y) to express the network in Figure 1, where


The network diagram of U A (x)U Q (x,y).
3.4. The Procedure of the Improved BP Algorithm
The algorithm includes the following steps.
(1) Respectively the sample xi and y
i
(i = 1,2,…, m; j = 1,2,…, m) in the whole region of U and V. The regions of U and V are limited here. Uniformly distributed samples in the U and V should be selected, and the initial value of x and σ; that is, x(0) and σ(0), should be determined, where x(0) is selected in the U and
(2) Keep y = y
j
in the network, and calculate Z1,Z2,…, Z
m
along the network with X = X1,X2,…, X
m
. Seek i that satisfy
(3) Adjust χ and σ using the improved BP algorithm. Determine the error correction U A (x) using gradient descent method. The iteration of parameter adjustment was carried out using the following calculation method:

In the above two formulas, all search-then-converge schedule learning rate was adopted; that is,

where η0 and τ are user-selected constants and e j 2 is given by (12). Combining learning algorithms (13), (14), and (15), it can be obtained as follows:

where

(4) Make y = yj + 1, and return to step 2; repeat the calculation with y = y1,y2,…, y
n
,yn + 1 (yn + 1 actually implies that if the n elements all do not meet the conditions after going through them, recalculate from y1) until k>n; that is, when the variations of
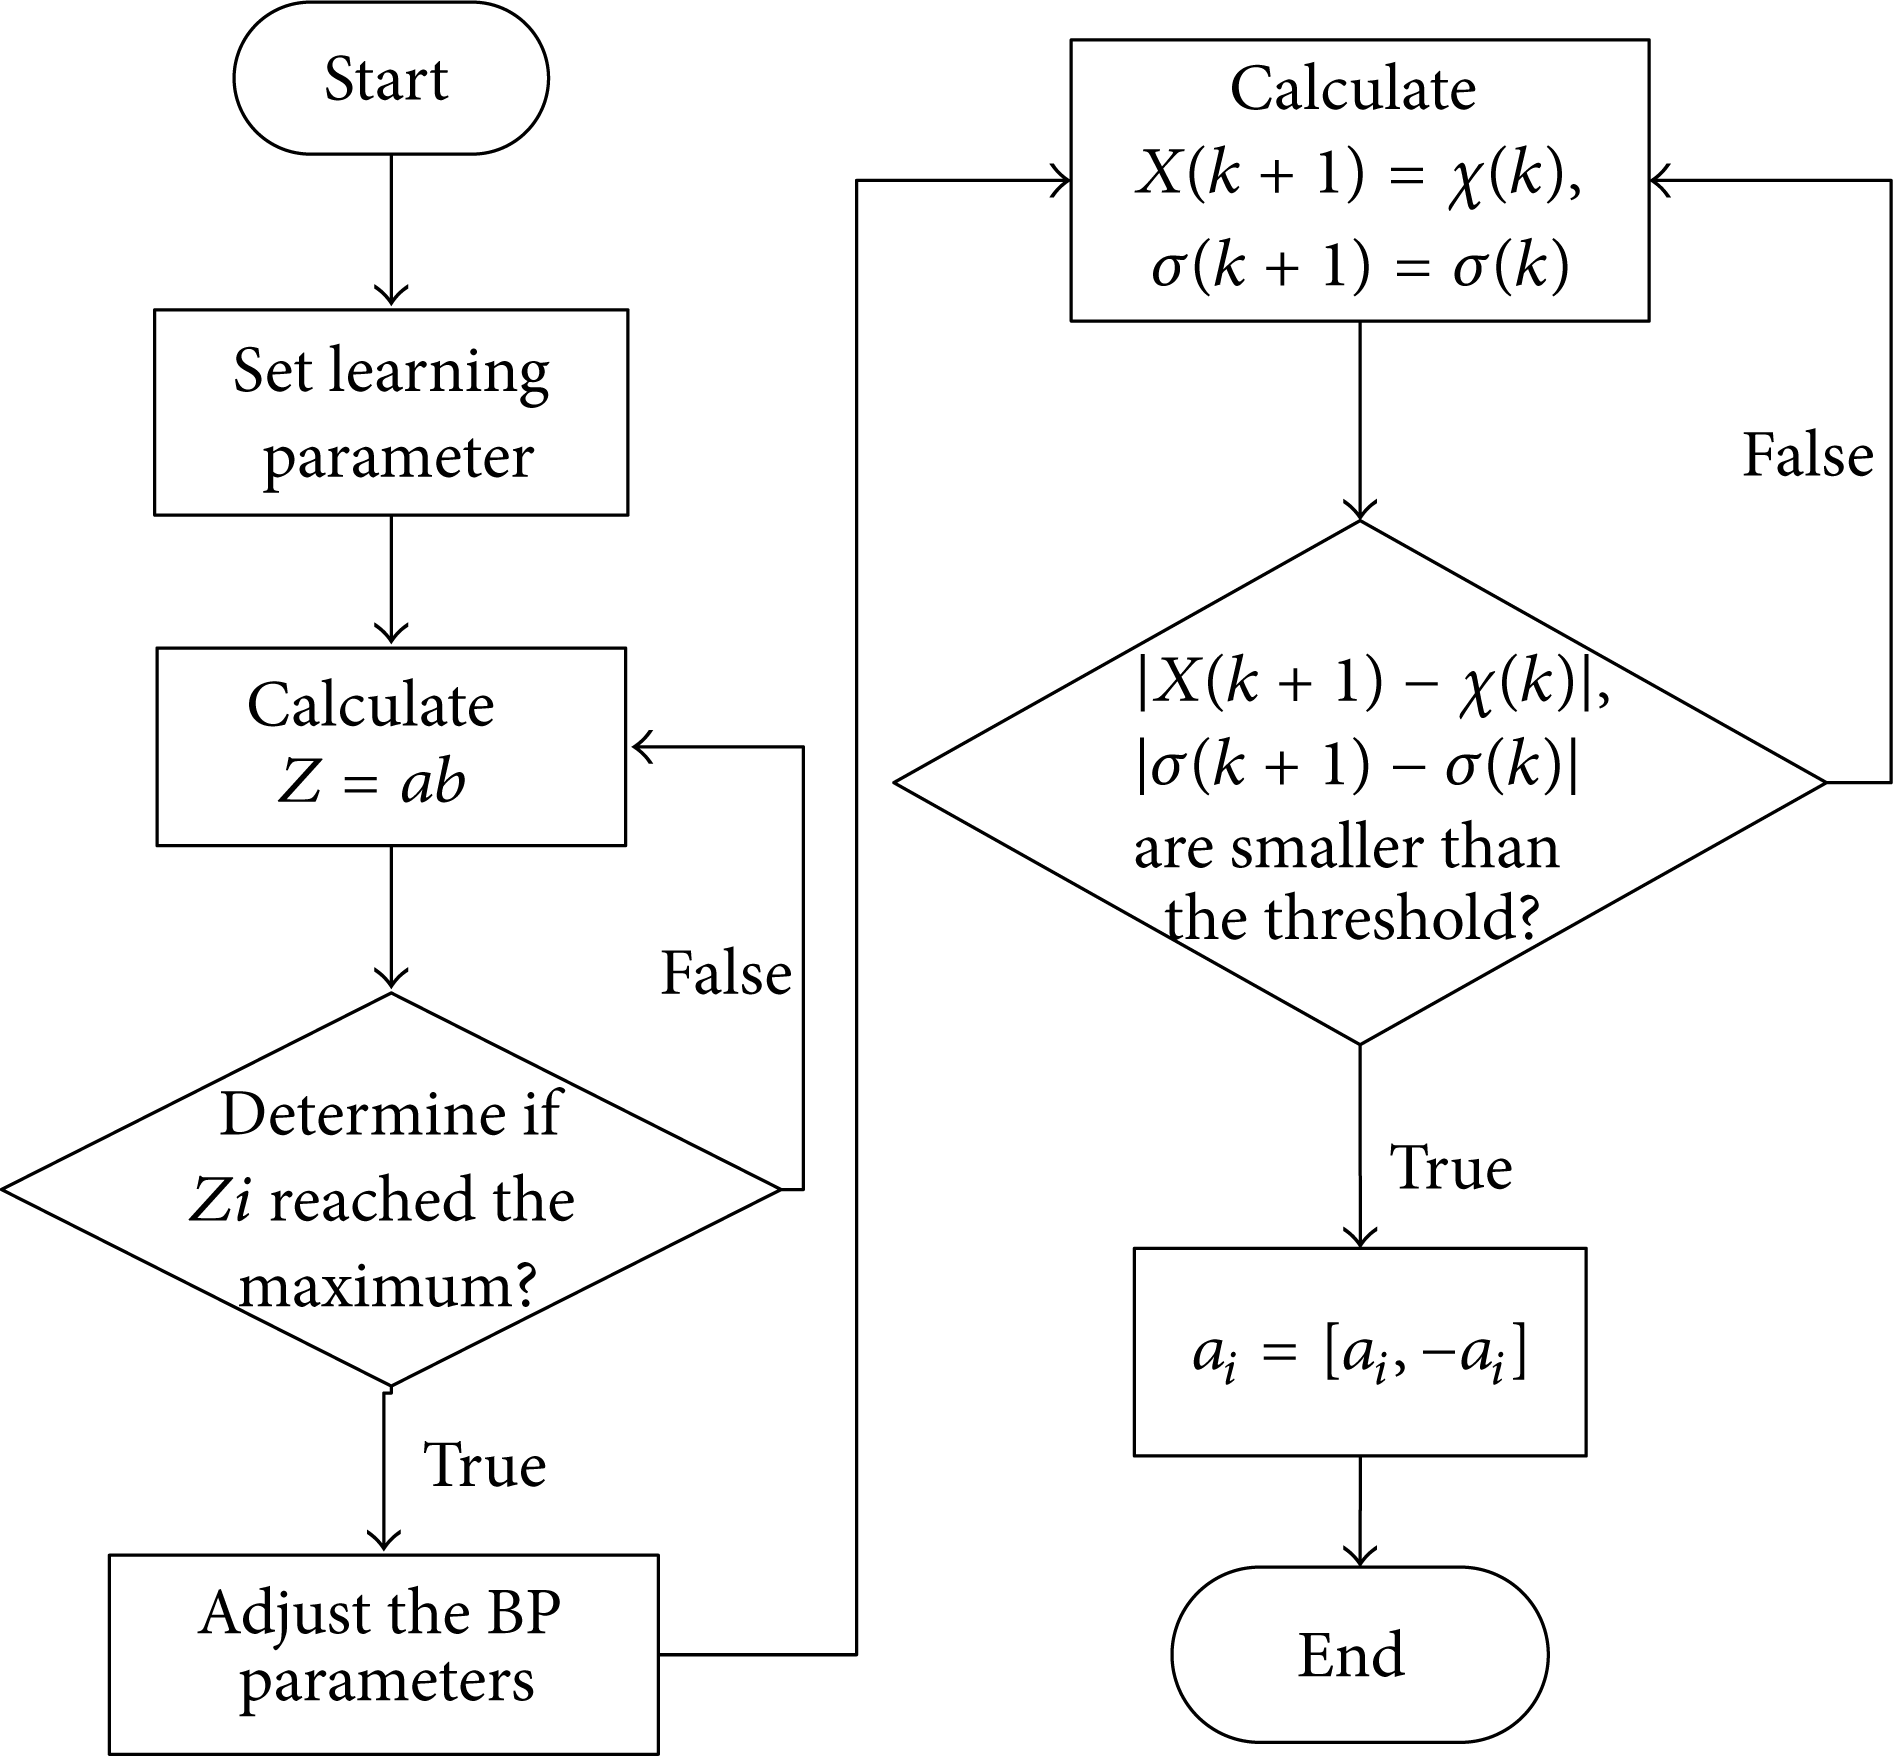
Solving flowchart of fuzzy relation equation using BP algorithm.
4. Practical Example
Taking the assembly process of an NC rotary table as research object, the assembly quality abnormality was diagnosed in detail using the proposed solutions. The basic process is shown in Figure 3.

The principle diagram of NC rotary table assembly quality fuzzy abnormal diagnosis.
4.1. Problem Description
Through interviews with CNC machine operator, maintenance staff, and equipment managers of 10 sets of CNC machine in the automobile and mold industries after-sales service personnel of CNC machine producers, 510 field failure data from January 2011 to April 2012 were collected, and three types of abnormal quality symptoms of a NC turntable during assembly were summarized and abnormous assembly quality reflected in the abnormal control charts, respectively, on the following three conditions.
Bad accuracy:quality control chart to monitor window, assembly point value of the NC rotary table will happen out of control limit state, shows NC machining parts have these phenomenon, such as work geometry accuracy, positioning accuracy, precision, and the moving parts clearance is too large. The mode was labeled PR (y1).
Bad accuracy stability: the NC rotary tale control chart showed a trend of rising or falling and the geometry accuracy and position accuracy of NC turntable descend during machining parts. This mode was labeled PL(y2).
Low reliability: The quality control chart to monitor window shows, sports jammed parts of NC rotary table near point value will appear mutations, characterized by the moving parts in the process of machining parts no action, is not in place, is not allowed back to zero, stuck, the moving parts jitter, a sound, liquid, gas, oil leakage. This mode was labeled RE (y3).
Bad accuracy will cause poor machining quality of parts, unstable work of machine, shaking, noise, and rapid performance deterioration. Poor reliability of parts will cause various faults, big loss due to machine halt, and large reject rate.
Table 1 shows the anomalous causes of the three types of quality abnormality symptom of NC rotary table in assembly process.
Anomalous causes of abnormal quality symptoms of NC rotary table.

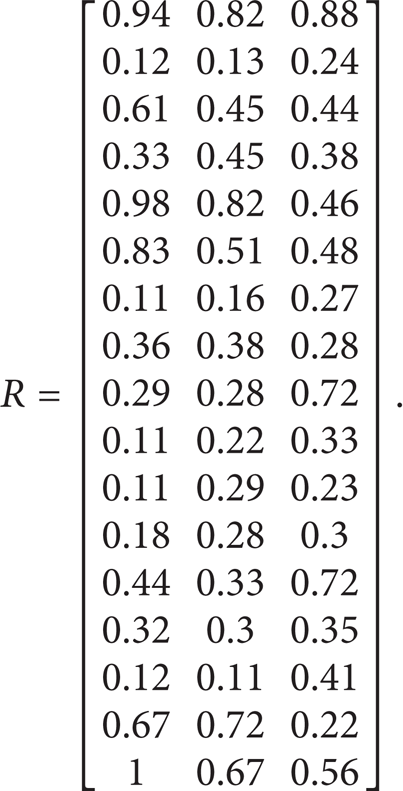
According to the Saaty's scoring method, for every kind of abnormity, through comparing anomalous causes and normalization processing, we can get fuzzy relation matrix R. Consider

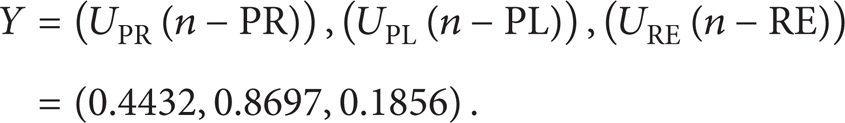
Set the calculated membership degree of fuzzy abnormality pattern at a certain time as PR_mf = 0.4432, PL_mf = 0.8697, and RE_mf = 0.1856.
Substituting the above data into the fuzzy relation equation Y = X∘R, there is
The fuzzy relation equation can be converted into
4.2. Solution of Fuzzy Relation Equation Using BP Algorithm
The fuzzy membership degree of the anomalous causes in the fuzzy relation (20) is a i = U A (x i ). The equation is solved using BP algorithm in following steps.
(1) Sampling and Initializing Data. In the fuzzy relation equation, the membership degree of the anomalous causes can be described as a i ∈ [0, 1]. In this example, U and V both have a boundary that U∈[0, 1], V = Y∈[0, 1]. The evenly distributed points in the region of U and V are selected, when m = 17 and n = 3; that is,

The initial values ofχand σare χ(0) and σ(0), and χ(0) is selected from U. Besides,
(2) Selection of Learning Rate. Learning rate was obtained by (20). When η(0) = 0.04, τ = 100; the convergence process is shown in Figure 4.
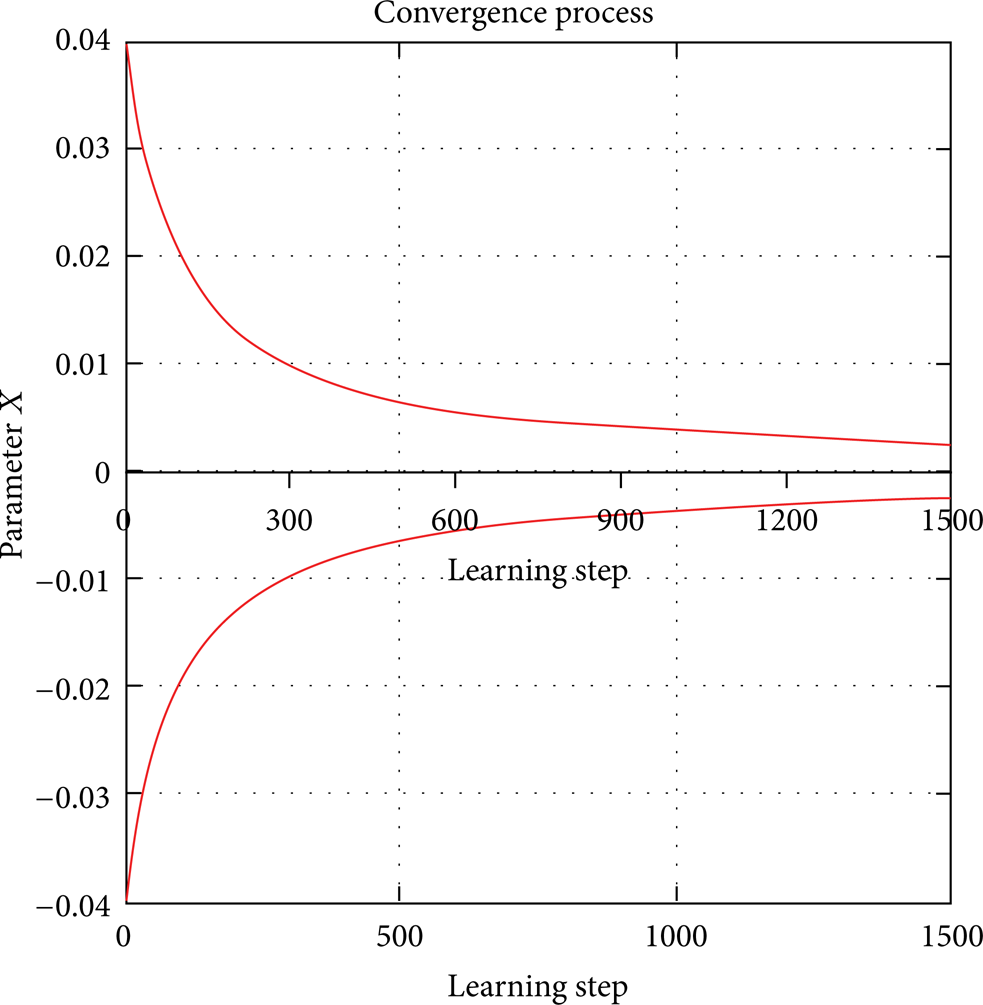
U
A
(x
i
) convergence process of
(3) Solving with BP Algorithm
(a)
X = (0.058824, 0.117647, 0.176471, 0.235294, 0.294118, 0.352941, 0.411765, 0.470588, 0.529412, 0.588235, 0.647059, 0.705882, 0.764706, 0.823529, 0.882353, 0.941176, 1) Y = (0.4432, 0.8697, 0.1856);
U(x,y) = R; % R is the fuzzy relation matrix obtained from (9);

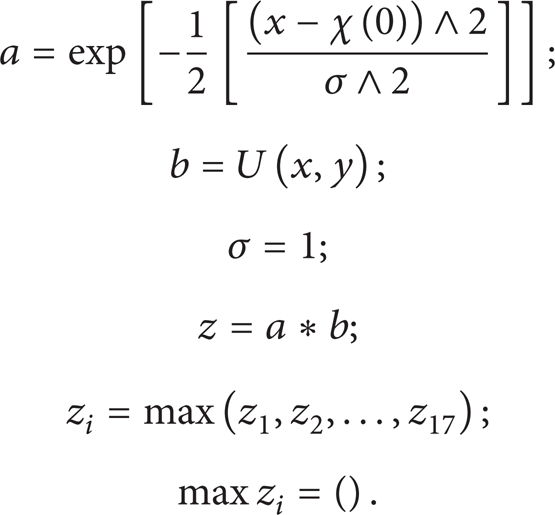
Set y equal to Y = (0.4432, 0.8697, 0.1856); respectively, run
The result is obtained as
(b) Adjust the parameters χ and σ in Ux(x
m
), obtained
Iteration results using BP algorithm.

(c) From the obtained results by BP algorithm, solving results change curves of abnormous cause membership grade using BP algorithm is shown in Figure 5 and solving results interval graphs of membership grade using BP algorithm is shown in Figure 6. Execute the search operation within the range of ai, and sort them utilizing the operator
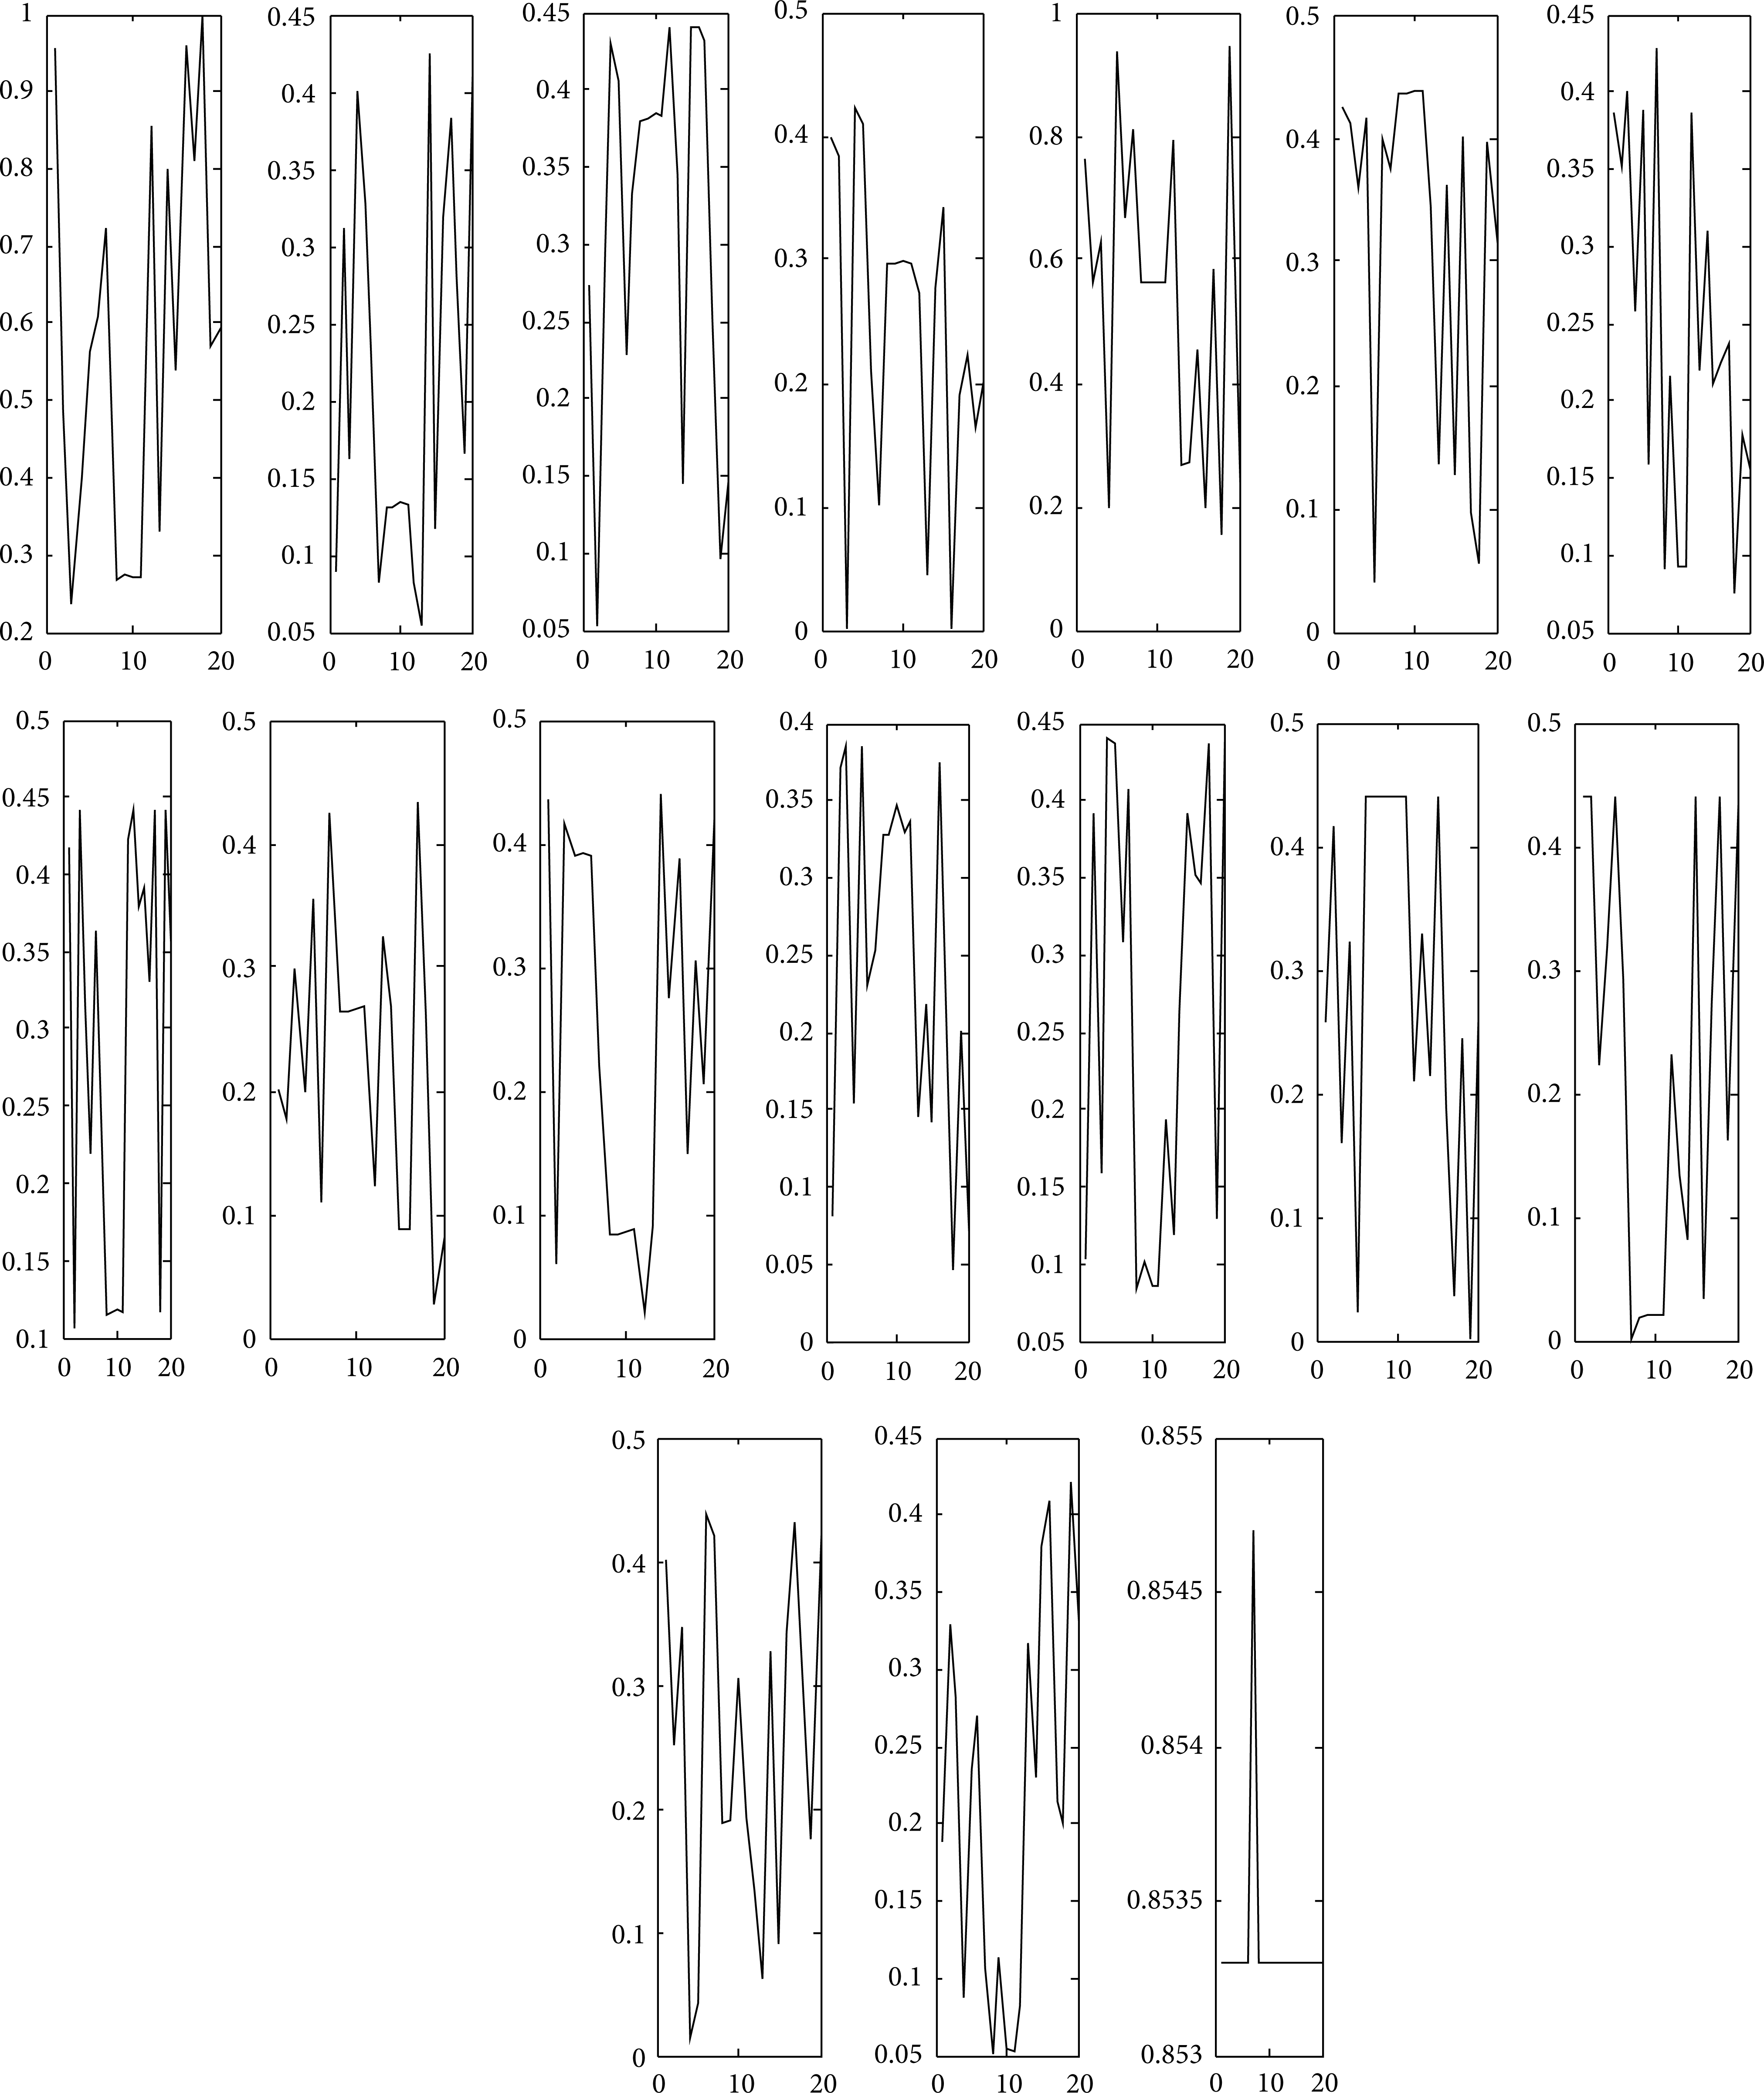
Solving results change curves of abnormous cause membership grade using BP algorithm.

Solving results interval graphs of membership grade using BP algorithm.
5. Conclusion
The fuzzy relation equation was introduced to describe the relationship between the assembly quality abnormity and the anomalous causes. The influence factors in the assembly process of CNC machine were obtained by solving the fuzzy relation equation, realizing the control of the assembly process. The work can provide a new method for improving the assembly quality of CNC machine, and it can alsoextended to improve assembly quality of other products.
A diagnostic model of assembly quality abnormity based on fuzzy relation equations was established, and a constructing method of fuzzy relation equation from the fuzzy relation matrix and the abnormal pattern membership degree was proposed. Through solving fuzzy deconvolution problem by the improved BP algorithm, the fuzzy relation equation was transformed into neutral network problem. Finally, the related parameters in the algorithm were determined through designing the neutral network algorithm to get the approximate solution of the fuzzy relation equations.
A diagnosis scheme of assembly quality abnormality based on fuzzy relation equations and BP algorithm was established, which can diagnose the anomalous causes to quality abnormality in detail.
Conflict of Interests
The authors declare that there is no conflict of interests regarding the publication of this paper.
Footnotes
Acknowledgments
This work was financially supported by the National Natural Science Foundation, China (no.51175527), the National Major Scientific and Technological Special Project for “High-grade CNC and Basic Manufacturing Equipment”, China (no. 2011ZX04014-011; 2012ZX04014-031; 2013ZX04012-061), the Natural Science foundation, ChongQing (no. KJ121602), supported by Open Research Foundation of State Key Lab. of Digital Manufacturing Equipment & Technology in Huazhong University of Science & Technology, and supported by Hunan Provincial Natural Science Foundation of China (no. 12JJ6053).