
Abstract
This paper presents wind tunnel experiment on two delta wing configurations which are differentiated by their leading edge profiles: sharp and round-edged wings. The experiments were performed as a part of the delta wing aerodynamics research development in Universiti Teknologi Malaysia, low speed tunnel (UTM-LST). Steady load balance and flow visualization tests were conducted at Reynolds numbers of 0.5, 1, and 1.5 × 10⁶, respectively. The flow measurement at low Reynolds number was also performed at as low as speed of 5 m/s. During the experiments, laser with smoke flow visualizations test was performed on both wings. The study has identified interesting features of the interrelationship between the conventional leading edge primary vortex and the occurrence and development of the vortex breakdown above the delta wings. The results conclude the vortex characteristics are largely dependent on the Reynolds number, angle of attack, and leading-edge radii of the wing.
1. Introduction
The flow on the sharp-edged delta wing at a certain wind speed and angle of attack can be described as a movement of a part of the flow from the lower to the upper surface into a spiral type of motion [1–3]. Flow separation will take place at the leading edge near the apex and primary vortices are formed over the upper surface. The primary vortices basically start as small shear layers at the leading edge and then wrap up in a spiral fashion [4, 5]. The vortices thus originate from a series of smaller vortices shed from the leading edge of the wing. The shear layers rotate around to form a pair of larger vortices called primary vortices. The chordwise extent of the primary vortex depends on angle of attack, Mach number, Reynolds number, the leading edge bluntness itself [2, 3], and pitching frequency [6]. In addition to these, the details of vortex characteristics on a delta wing undergoing pitching motion had not been successfully observed in the experiments [6]. The situation increases the complexity of the primary vortex characteristics and the vortex breakdown process. Investigations into this were driven by observation that the vortex breakdown process at higher angle of attack is temporarily delayed by pitching motion. A high performance aircraft can take advantage from these unsteady effects for a rapid maneuver at high angle of attack [6].
In 2003, two research teams called CAWAPI and VFE-2 were established under the Research Technology Organization of Advanced Vehicle Technology to investigate the effects of Reynolds number, Mach number, angle of attack, and the leading edge bluntness to the characteristics of vortex properties above delta wings model [1–3]. The aims of these teams are to increase technology readiness for the development of new military aircraft and also for future transport aircraft [3]. Both CAWAPI and VFE-2 are closely related although there are different requirements of each part; for example, VFE-2 is focused on experiments and CFD validation while CAWAPI compares the flight test with the CFD codes. The general objectives of the VFE-2 are to perform wind tunnel experiments and numerical calculations on a 65° delta wing model in order to understand the vortical flow and use the experimental results to validate the existing CFD codes. Several experiments and numerical analysis were performed to achieve those objectives and one of them was to investigate the boundary layer status laminar to turbulent transition on delta wings. A detailed research on pressure distribution measurement especially in the region of the onset of flow separation for configurations with rounded leading edge was also studied.
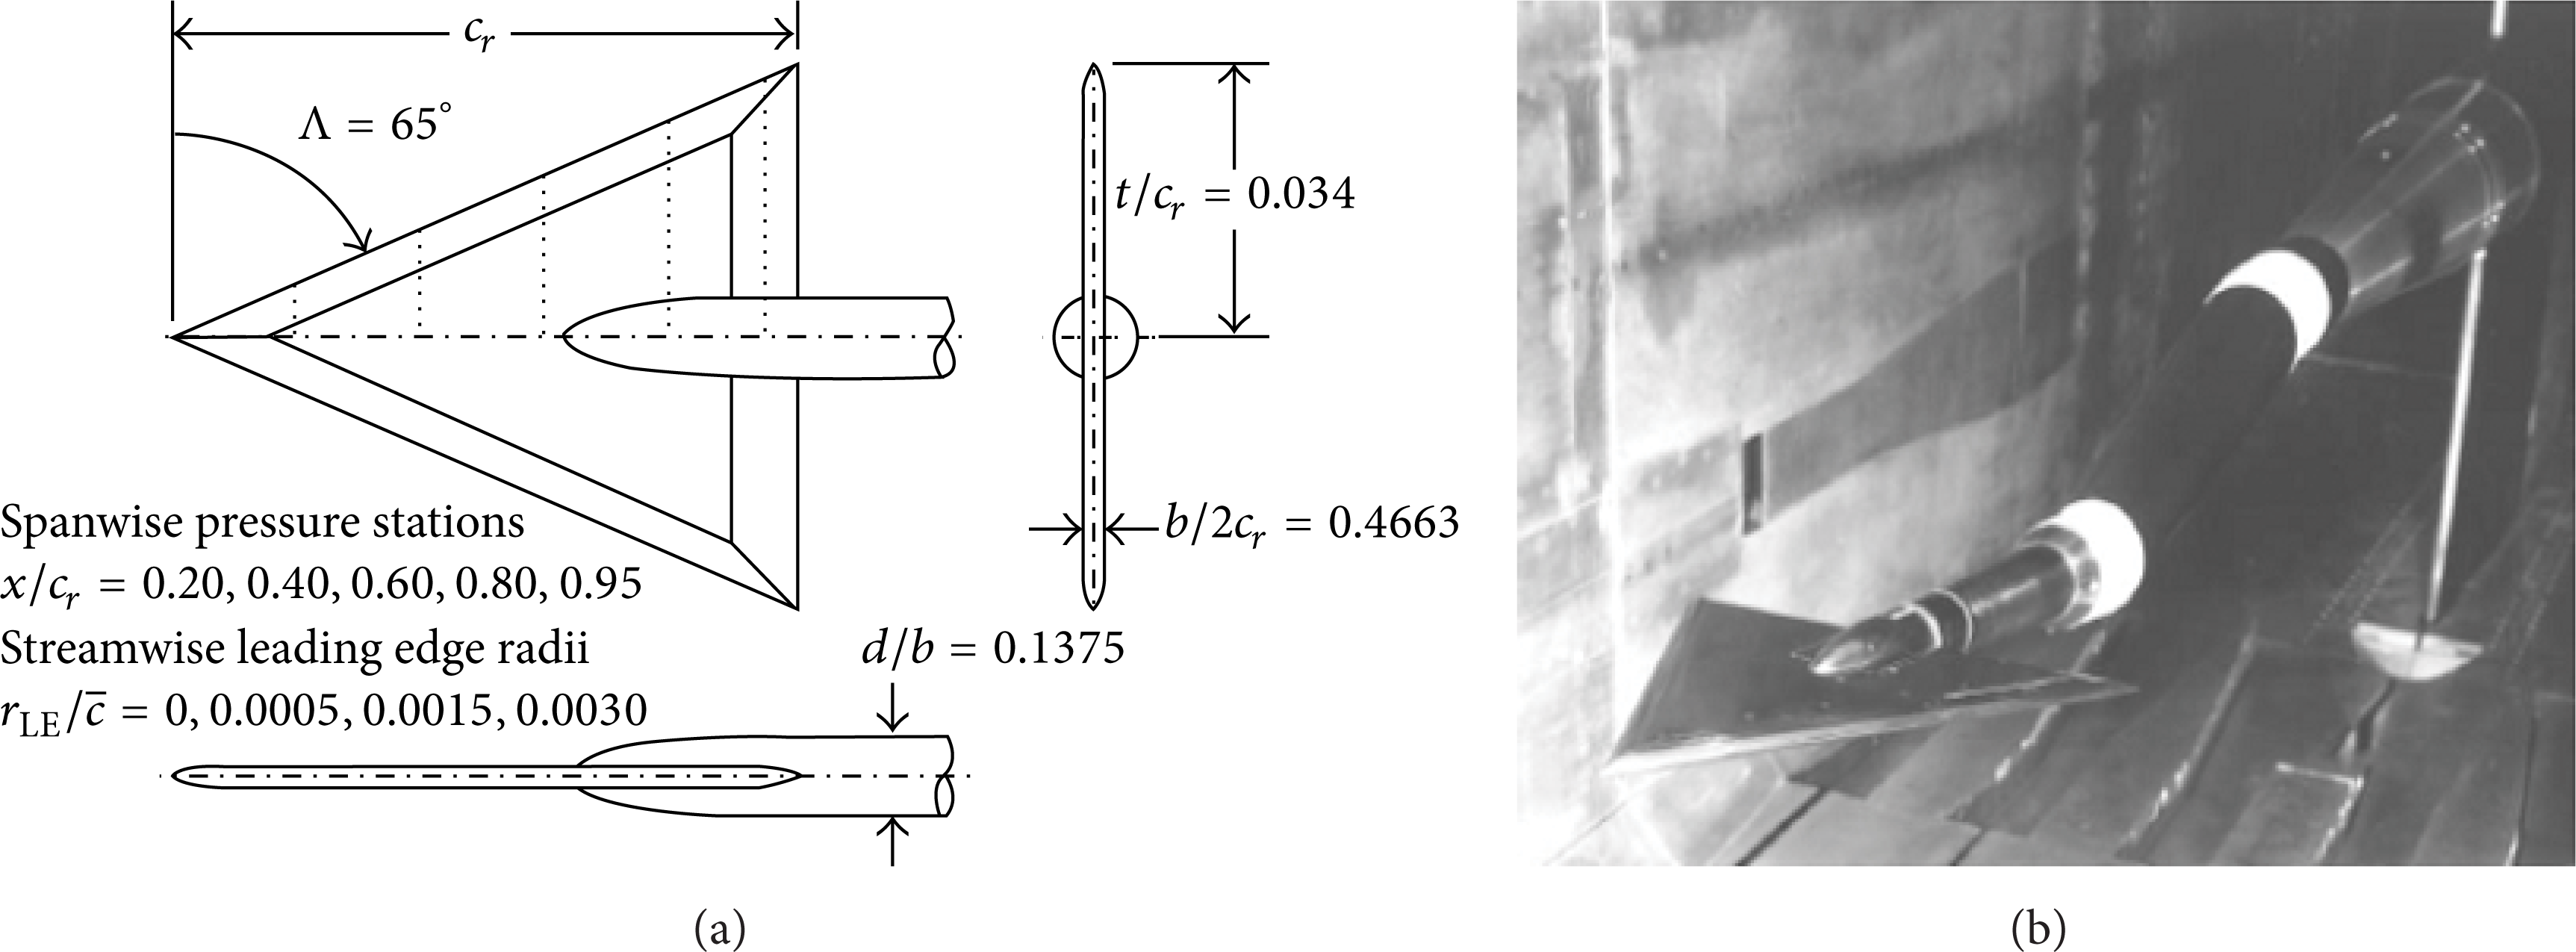
The models tested in the NASA transonic wind tunnels [7] were reused again as a generic model for further investigation using modern measurements techniques such as particle image velocimetry (PIV), pressure sensitive paint, hot wire, and steady balance within the VFE-2 team in wind tunnels across Europe Research Institutions [8–13]. The profile of the model [7] is shown in Figure 1(a) and its installation in the wind tunnel is shown in Figure 1(b). The results from this campaign were compared with each other and with the CFD codes [14]. More experiments are needed in the future to investigate the boundary layer status and the behaviours of the vortex breakdown across the wing.
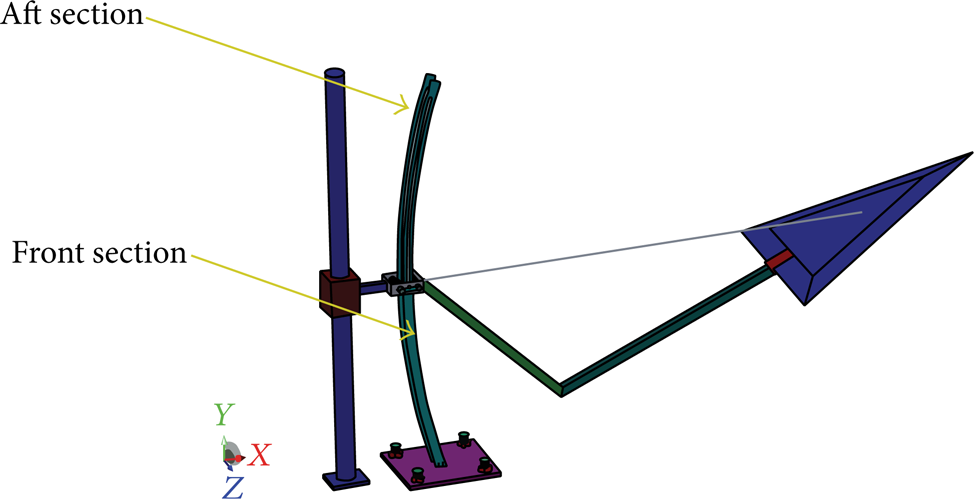
As part of the VFE-2 campaign, the researchers in Glasgow [11] designed and replicated the original Chu and Luckring [7] profiles shown in Figure 1 for further experiments in the University of Glasgow Argyll Wind Tunnel. The final design is shown in Figure 2(a) while the installation of the model in the Argyll wind tunnel is shown in Figure 2(b), respectively. Several interesting flow physics were obtained throughout the duration of the project from 2005 to 2010 [15]. During the tests, several flow techniques were employed, that is, steady and unsteady balance, oil flow visualization, and particle image velocimetry.

Wind tunnel test at Glasgow Argyll wind tunnel.
In 2010, a research team is established in UTM to continue the research. The initial work is to access the suitability of the UTM wind tunnel (UTM-LST) for this kind of research by repeating the work that has been reported in the literature review. Thus, the main objective of this paper is to present the progress of this research in Universiti Teknologi Malaysia low speed wind tunnel. Several early predictions on the effects of Reynolds number, leading edge bluntness, and angle of attack on the vortex properties would be discussed throughout this paper.
2. Research Methodology
The initial development in UTM was to design and fabricate the model and its support structure. The primary design of UTM test rig is shown in Figure 3. In the design, the two rollers engaged with the front and back of the radiuses support structure. The front section had a radius of 2.0 metres and the aft section had a radius of 2.2 metres and these two sections created parallel radii originating from the centre of rotation. The angle of attack was determined by moving the stub-sting component around the radius about a constant centre of rotation at the model. To create pitching motion, the sting component is linked to an electrical motor which is positioned behind the support structure.
Primary design of UTM test rig.
Vibration problem caused major setback to this design forcing major modification to be made in order to minimise the vibration issue. An electrical motor is then attached directly to the sting components. These components are then reattached to the radiuses support structure. The arrangement is shown in Figure 4(a). The final assembly of UTM test rig is shown in Figure 4(b).

The final UTM test rig.
In order to differentiate the leading edge bluntness, two models, namely, the sharp and the blunt wings, were designed and fabricated by their leading edge profile given by Chu and Luckring [7]. The basic dimensions of the model are shown in Figure 5(a). The model has the chord length of 0.68 meter and thus the Reynolds number of 1.5 × 10⁶ can be achieved at the speed of 33.39 m/s. The original model [7] shown in Figures 1(a) and 1(b) has the wing root chord of 0.653 meter. Figures 5(b) and 5(c) depict the different leading edge profile of the wings.

Profiles of the models.
During the initial stage of the experiment, several problems were faced. The main problem was the vibration of the test setup so it had been decided to test the model without the sting support. The well-established MICRCORAFT 6-component external balance had been chosen to measure the steady forces. The experiments were carried out in the 2.0 (W) metre by 1.5 (H) metre closed circuit UTM low speed wind tunnel as shown in Figure 6. The results are discussed in the next section.

The installation of the delta wing model in UTM-LST wind tunnel.
Tests were conducted at speeds of 11.13 m/s, 22.26 m/s, and 33.39 m/s which are corresponding to Reynolds numbers of 0.51 × 10⁶, 1 × 10⁶, and 1.5 × 10⁶ based on wing root chord, respectively. The experiments were conducted in two phases, the steady load balance measurement and smoke flow visualizations.
3. Results
3.1. Flow Visualization
3.1.1. Flow Visualization at Reynolds Number of 1.5 × 10⁶
To present the leading edge bluntness effect, the flow visualization results of the blunt leading edge wing is compared with those from the sharp-edged wing and this is done in Figure 7. At as low as α = 5° angle of attack, the primary vortex had been well developed on the sharp wing while at α = 10° for the blunt wing. The figure shows that the increment of leading edge radius does reduce the magnitude of the primary vortex which may conclude the leading edge bluntness could delay the formation of the primary vortex.

Table of smoke test at different angle of attack (α) with each wing.
3.1.2. Flow Visualization at Lower Reynolds Number of 0.22 × 10⁶
The flow visualization studies at lower Reynolds number were also performed throughout this project. The experimental setup is shown as in Figure 8. In this experiment, the laser sheet is mounted on the roof of the test section while the smoke generator is placed in front of the model. The tests were performed at Reynolds number of 0.22 × 10⁶ and 0.44 × 10⁶, which are equivalent to the speed of 5 and 10 m/s, respectively.

The wind tunnel setup for flow visualization experiments at α = 22.5° angle of attack.
The sample images of flow visualization results on the sharp-edged wing at α = 22.5° are shown in Figures 9(a) and 9(b). The primary vortex is observed to develop in the leading edge areas shown in the Figure 9(a).

With laser visualization results Reynolds number of 0.22 × 10⁶.
The effects of angle of attack on the flow structure are presented in Figure 9(b) when the angle of attack is increased to α = 25° at constant Reynolds number. The vortex core is observed from the wing apex to a certain chordwise position near the trailing edge. After this point the flow turns into disorganized and unsteady flowfield or called vortex breakdown. The flow characteristics of the vortex breakdown very much depend upon the Reynolds number, angle of attack, and leading edge bluntness and this investigation needs more experiments in the future.
The instantaneous development of the primary vortex is shown in Figure 10. At the beginning (stage 1), the shear layer of the flow rotates itself to form smaller vortices in the apex region. These vortices rotate again to form primary vortex; this is very well agreeable with Gad-El-Hak and Blackwelder [4]. In the second stage (stage 2) the vortex is well developed on each leading edge. It can be seen also from this figure the transportation of the flow from the lower to the upper surface of the wing. This happened further aft of the wing. Further aft to the trailing edge area (stage 3), the vortex breakdown is observed to develop. The vortex at this position becomes disorganized and unstructured.
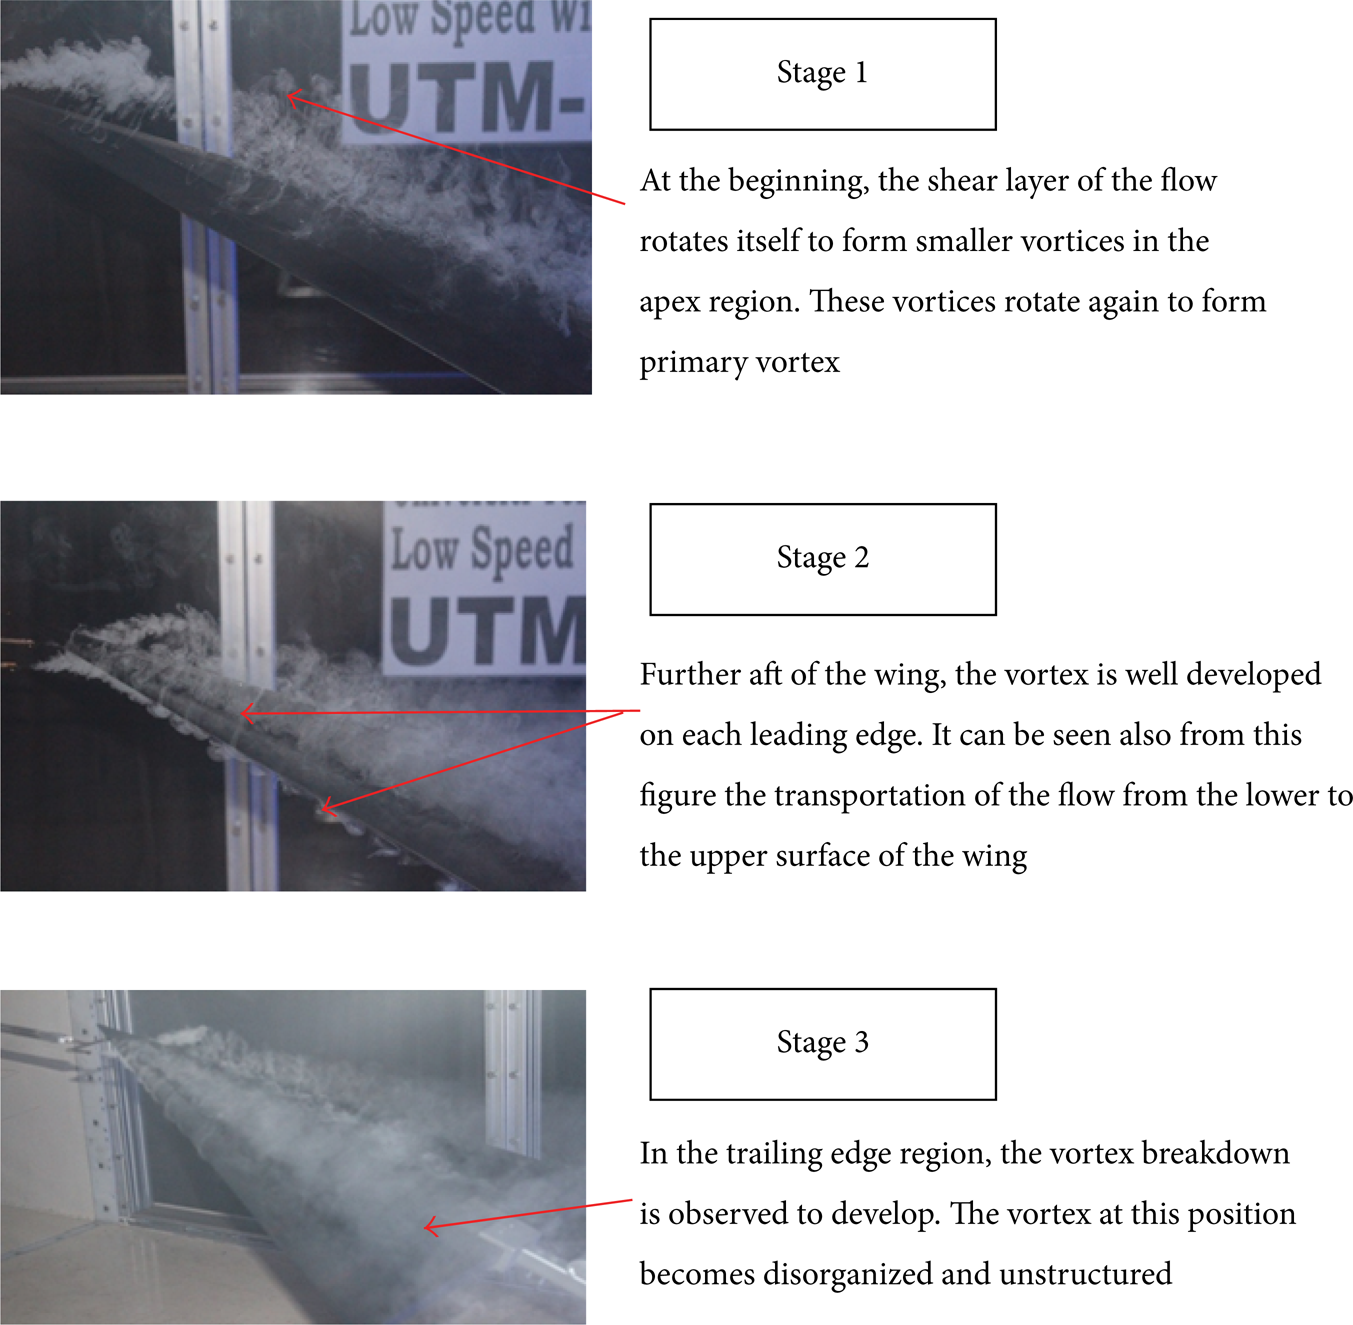
Development of the primary vortex across the wing.
3.2. Steady Balance Measurements
This section discusses the effect of Reynolds number and leading edge bluntness on the steady load data, focusing on aerodynamic lift and drag data. Figures 11 and 12 show the effect of Reynolds number on the characteristics of lift and drag coefficients characteristics. From Figure 11, the maximum lift coefficient C L on the sharp-edged wing is 1.18 at the model angle of attack α = 23°. There is a reduction in coefficient of lift C L beyond α = 23° which associated with the effect of vortex breakdown. Observing Figure 11, the maximum lift coefficient for the blunt-edged wing is slightly lower than that of the sharp wing. This is consistent with Hummel [3] who discussed the vortex properties above the sharp-edged wing are stronger than those from the blunt wing. From Figure 12 the maximum drag coefficient for the sharp-edged wing is about 0.55 at model angle of attack α = 22° compared to 0.5 for the case of blunt wing at the Reynolds number of 1.5 × 10⁶.

Effects of Reynolds number on C L characteristics.

Effects of Reynolds number on C D characteristics.
The results obtained show that the increase in Reynolds number increases the lift, drag, and pitching moment coefficients significantly. At the moment, the characteristic of laminar transition to turbulent boundary layer is strongly suspected to cause the difference. By increasing the Reynolds number, the turbulence intensity of the flow is also increased. This is in well agreement with Hummel [1, 2] who discussed the vortex property above the turbulent separation is stronger than the laminar case. Stronger separation at higher Reynolds number is induced by a strong adverse pressure gradient in the region, which in turn reduces the viscous effects. Further flow-data is required to confirm this hypothesis.
The effect of leading edge bluntness is demonstrated in Figures 13 and 14. From the figures, it can be seen that the lift and drag coefficients are not sensitive to leading edge bluntness within the range of 1 to 1.5 Reynolds numbers. This finding is tally with Hummel [1, 2] stating the effect of leading edge would appear at higher Reynolds number.

C L at different leading edge bluntness.

C D at different leading edge bluntness.
At higher angle of attack, the C L for the sharp-edged wing is higher than the blunt wing for both cases of 1 and 1.5 × 10⁶ Reynolds number. At α = 22°, C L for sharp wing is 1.13 compared to 1.11 for the blunt-edged wing at 1 × 10⁶ Reynolds number. Similar trend is observed for the 1.5 × 10⁶ Reynolds number case; C L is 1.16 for the sharp and 1.14 for the blunt wing. This strongly linked with the characteristics of vortex breakdown aft of the wing. The flow field data in the vortex breakdown region would confirm this hypothesis.
The characteristics of drag for Reynolds number effects are shown in Figure 14. Within this Reynolds number range, it shows that the drag coefficient is insensitive to the change of leading edge bluntness at relatively low angle of attack. However at higher angle of attack, C D becomes dependent on angle of attack where the sharp-edged wing is found to have higher C D over the blunt-edged wing. For example at 1.5 × 10⁶ Reynolds number, C D is about 0.5 on the blunt wing compared to 0.56 for the sharp case. The reason for this is still unknown and more flow-filed data is required to investigate this phenomena.
Figure 15 depicts the drag polar curve which is essential to the design process as much of the basic aerodynamics of an airplane is reflected in the drag polar. For the both Reynolds numbers, the aerodynamic performance characteristic for sharp and blunt wings is found to be relatively the same but it starts deviating when C L reaches about bigger than 0.9. This implies at huge C L value the blunt wing has better lift-to-drag ratio over the sharp wing.
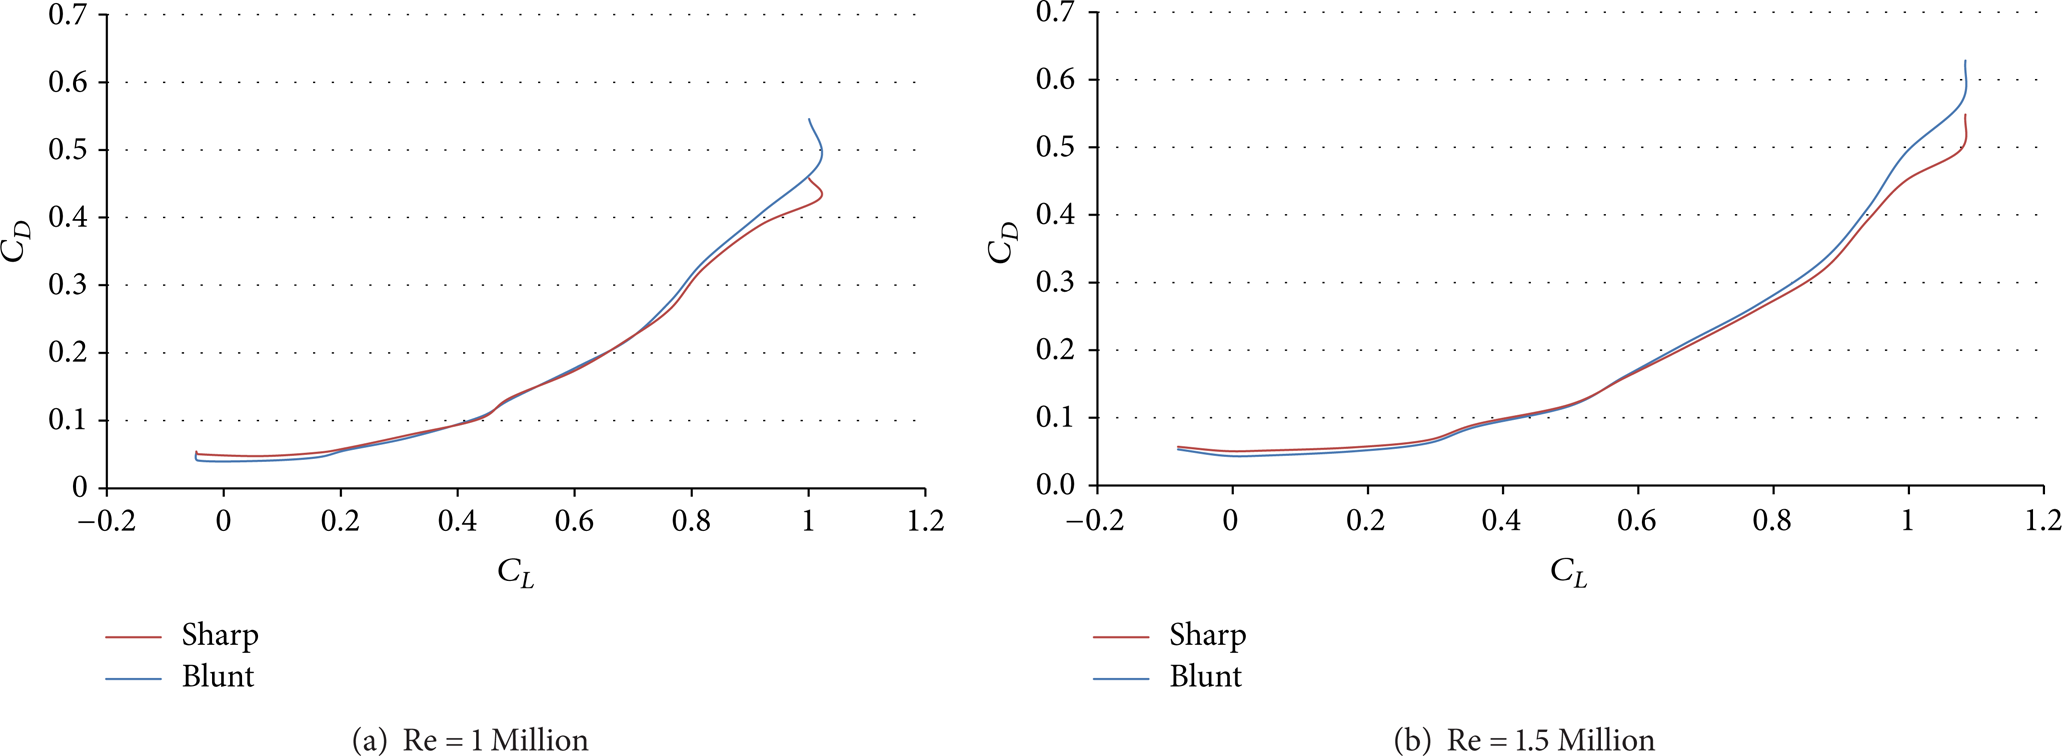
A drag polar.
4. Conclusion
The results presented show that the formation of conventional leading edge primary vortex is very much dependent on the leading edge bluntness, Reynolds number, and angle of attack. An increase in leading edge bluntness and Reynolds number can delay the formation of the primary vortex towards the aft portions of the wing. Nevertheless, increasing the angle of attack prompts an upstream movement of the origin of the primary vortex. The lift force was found to be sensitive to leading edge radius but this sensitivity was not consistent across the angle of attack range. At low angle of attack, an increment in leading edge radius would decrease the lift force coefficient significantly. This could be associated with the decrement in magnitude of the primary vortex.
Footnotes
Nomenclature
Conflict of Interests
The authors declare that there is no conflict of interests regarding the publication of this paper.
Acknowledgment
The project is funded by MOHE/UTM Research University Grant no. 4F172.