
Abstract
With the rapid development of augmented reality (AR) technology, the combination of reality and virtual learning material finally came true. This study adopts AR technology to enrich learning environment and students' learning experience at the same time. Furthermore, to passively avoid students being lost while they were learning in a real environment and to actively channel students into ideal learning topic, this study proposes an indoor positioning algorithm which is able to calculate the current position of the learner and further enables learners to find out where he/she is and which learning subjects he/she will learn. The experiment is carried out to demonstrate the accuracy of the proposed indoor positioning algorithm. The results show that the proposed algorithm has a higher accuracy and lower error. Meanwhile, the algorithm is able to eliminate the anomalous RSSI signals, which is the main reason for improving the positioning accuracy. The maximum error is improved by 51.22%. From the application aspect, we elaborate the implications of this study which present the substantial contributions and educational values of the system. We expect that the smart learning can be made via the system establishment in near future.
1. Introduction
Technology has been widely adopted in education setting for achieving the goal of providing education for the future society [1, 2]. There are plenty of institutions providing abundant learning information other than schools [3]; however, visitors may get lost in the spacious places like museum or library, in which guides are required to lead the route and to explain to the visitors. In the condition of limited human resources, tour guide is impossible to individualize even if he could provide engrossing narration. Nevertheless, when people face abundant learning resources, they are not necessarily cable of determining the proper materials for themselves; they tend to get lost in it. Furthermore, from the viewpoint of educational psychology, people who lack of self-regulated abilities might tend to go astray in a spacious educational social institution [4].
Therefore, the main goal of this study is to establish one smart learning space utilizing the access point (AP) deployment to set up indoor positioning to calculate the current position of the learner and using augmented reality (AR) technology to enable users to quickly combine virtual information and physical objects. For the sake, we develop two kinds of indoor positioning algorithm, trilateration algorithm and enhanced version. Using RSSI values (i.e., a measurement of the power present in a received radio signal) measured from Wi-Fi signals, the trilateration algorithm locates a user's current position. Moreover, the enhanced trilateration algorithm further improves the accuracy with a more complicated calculation process. Equipped with this system, visitors could acquire valuable information provided by AR corresponding to the sites at anytime and anywhere in the institution. The system also records the learning process of each person with added nodes to present learning progress in order to enhance their self-regulated ability. Two main contributions should be found in this study. Low-cost indoor positioning is achieved with Wi-Fi APs. Additionally, users can be equiped with mobile devices to see their current positions. On the other hand, we combine indoor positioning technology with AR technology to enrich the physical learning content, which was indicated to improve learning when the educational experience presents information at spatially and temporally appropriate locations.
Four main sections are organized in this study in addition to a concluding section which addresses a few pragmatic limitations and future directions. Section 2 reviews the related studies, which include augmented reality technology, indoor positioning technology, and self-regulation learning. In Section 3, we describe the implementation issues of two algorithms and the experimental procedures. Section 4 presents the experiment results and implications in terms of the applications in real contexts.
2. Literature Review
2.1. Augmented Reality (AR) Technology
Augmented reality (AR) is a technology combining virtual environments and real-world environments to supplement inadequacies of the real world instead of replacing the real-world environment. In 1997, Azuma defined the three elements of AR, which are, respectively, “combines real and virtual,” “interactive in real time,” and “registered in 3D.” Information is combined with actual 3D space and presented in real time, and learners can even interact with the context-aware virtual environment [5–9].
The development of this technology has been matured and been widely used in various fields, including the field of education. According to 2012 Horizon Report for K-12 education released by NWC (New Media Consortium) and 2012 Horizon Report of the museum of science, it is predicted that AR will be gradually adopted in the next five years [10, 11]. The Horizon reports of these institutions provide expert recommendations of application of educational technology for the next five years in three major categories: Higher Ed Edition, K-12 Edition, and Museum Edition. The reports also provide examples on the implemented technology, such as the learning activity in which students use mobile devices to interact with surrounding environments for studying Asian Arts or students use gesture operation to interact with AR technology at the Natural History Museum in London via the use of tablet PCs; students can see extinct dinosaurs walk in front of them. Such applications make the exploration of knowledge more realistic and interesting.
Based on the above example, it is seen that applying AR in education is a viable option. The application enables students to learn not only from traditional textbooks; the application of AR in K-12 fundamental education especially also avoids tedious learning for younger kids. It is extremely important to attract their attention and stimulate learning motivation. In the past, AR application has been demonstrated to actually enhance learning motivation [12, 13]. Therefore, this study innovatively adopts AR technology on mobile devices, making the screen display well-informed information, and via AR information, the build-in direction sensor of the devices and indoor positioning technology, the locations of the learners are detected so as to guide them to specific learning themes [14]. This kind of location-based service will assist in improving user experience [15, 16].
2.2. Indoor Positioning Technology
The currently most common wireless communication positioning technology is Global Position System (GPS). The early application of GPS was in the fields of military, engineering, and academic research; as the lifestyle changes, different livelihood needs of the technology are created. Although the outdoor GPS positioning is widely used, indoor positioning is not applicable because satellite signals are affected by obstructions. If more precise indoor positioning can be developed, it creates diversified application services such as aiding construction site safety and predicting user location [17, 18]. When there is indoor emergency or people are facing safety issues, the application can be used to assist with rescue or provide guiding routes [19]. Therefore, the technology applicable in indoor positioning has increasingly been taken seriously. One of the most high profile development plans is the In-Location Alliance established by 22 enterprises including Nokia, Samsung Electronics, and Sony Mobile Communications, which committed to promoting accurate indoor positioning and its application [20].
Today's indoor positioning technology can be roughly divided into four types: infrared, ultrasound, RFID, and Wi-Fi. Some of these technologies have been identified as not applicable for indoor positioning for the reasons such as cost consideration, limited positioning range, and difficulty in environment setup. The above-mentioned technologies are illustrated, respectively, as follows.
2.2.1. Infrared
Infrared is a type of electromagnetic waves with wavelength ranging from 770 nm to 1 mm. It receives signals from infrared sensors installed indoors to process positioning. Its drawback is that objects and sunlight interfere with it, resulting in poor accuracy of positioning. In addition, the range covered by infrared emitters is small; thus, a large number of emitters are required to cover the entire range so the cost is higher.
2.2.2. Ultrasound
Ultrasound is a sound or oscillating frequency greater than the upper limit of the human hearing range. Utilizing the return wave generated when ultrasound passes through medium, distance is measured via calculating the time difference at transmitting and receiving ends. However, after ultrasound is transmitted and it passes through multiple walls, reflection is in multipath and result in inaccurate measuring of distance. As a result, when the indoor environment is more complex, the cost for building the environment is higher.
2.2.3. Radio Frequency Identification (RFID)
RFID are chips with built-in radio technology, with electric waves ranging from 125 kHz to 13.56 MHz. The equipment of this system includes tags, readers, transponders, antennas, and back-end system [21]. The purpose of positioning is reached by calculating the distance between tags via RSSI. Nevertheless, tags and readers are directional devices and are easily interfered by objects. It is difficult to apply this technology in indoor positioning.
2.2.4. Wi-Fi
Wi-Fi is a wireless local area network (WLAN) technology built on IEEE 802.11 standard. Through connecting three or more stations, distance is measured via signal strength and triangulation. Many of today's public resources, including the explored sites of this study, have built-in wireless networking; also many mobile devices are equipped with Wi-Fi chips. In consideration of fast deployment and cost, this study uses Wi-Fi as the indoor positioning technology [17].
2.3. Self-Regulated Learning
By the rapid development of modern technology, learning may happen in various learning environments, such as in and out of classroom, with or without instruction, and formally or informally [22]. Therefore, learners are able to develop learning plans based on their needs and goals, and they must command learning resources, execute and assess the plans, and be responsible for their own learning processes [23]. In a blended learning environment, it is suggested that learners should possess self-regulated learning (SRL) skills [24].
While there are different explanations of the definition of SRL, it was firstly defined in 1994 [25]. Schunk and Zimmerman defined SRL as “the process whereby students activate and sustain cognitions that are systematically oriented toward an attainment of their goals.” The SRL theory has been widely applied in various subject domains such as science, math, social studies, language, and computing courses in recent decade [26]. Due to the nature of e-learning context, it is essential to examine learner self-regulation in e-Learning paradigm [27]. Many researchers have defined this theory from various perspectives, deriving numerous terms related to self-regulated learning, such as self-directed, self-control, self-teaching, self-management, and self-autonomy. Several researchers have argued that self-regulated learning requires higher autonomy [28]. In summary, self-regulated learning is influenced by the individuals’ learning experiences, capacities, and personal traits. Self-regulated learning requires interaction with available learning resources to improve learning achievement and satisfaction. However, before learners acquire the ability of self-regulated learning, educators must assist them in self-management to stimulate them.
In SRL theory defined by Schunk and Zimmerman, four common attributes exist for self-regulated learners [25, 29].
Intrinsically or self-motivated: for the purpose of knowledge acquisition and self-regulated learners’ motivations for learning are extremely strong. Planned or automatized: self-regulated learners are fully responsible people who can independently analyze, plan, execute, and evaluate their own learning activities. They can also identify what they need during the learning process, set individualized learning goals, control their own time and effort for learning and arrange feedbacks of their work. Self-aware of performance outcomes: in order to achieve the best learning outcomes, self-regulated learners make use of existing learning resources and feasible learning strategies to overcome the difficulties which occur in the learning process. Environmentally/socially sensitive and resourceful: one's learning behavior is usually influenced by the learning environment or resources. Self-regulated learners have better skills in satisfying their learning need efficiently and affordably (e.g., by obtaining data on the experiences of other learners, then using that data to set and achieve their own study goals).
Based on the self-regulated learning theory, we develop the learning system using augmented reality technology to facilitate learners’ intrinsic motivation and let them “see” visual additional information in a physical learning environment. Furthermore, in order to precisely present the indoor visual learning materials, we devise two algorithms to calculate a learner's indoor position. The detailed explanations of the algorithms and comparisons are presented in the next section.
3. Creating a Smart Learning Space Using AR & IP Technology
3.1. AR Implementation
During system development, floor layout and coordinates are established in the database. Coordinates of objects (such as washrooms, classrooms, recycle area, and elevators) to be shown in AR should be established in the database so that mobile devices can grab their coordinates. First of all, turn on the phone camera as the base of AR and utilize SurfaceView (multilayer perspective canvas) application to achieve multiperspective effect. The images captured by the camera are used as the base of canvas. Coordinates of the objects in the database are obtained and then trigonometric calculations are used to determine the current position (user's position) and the angle and distance of the objects. Depending on the distances of the objects, the size and degree of transparency of how they are shown in the screen differ. Use the accelerometer function of Gyro sensor on the handheld device to detect the direction the device is currently facing and obtain the wide-angle degree of the camera lens. The two data are combined to calculate the location of the object displayed on screen and its amount of movement. When the x-axis of the handheld device is <1.5 (downward), virtual arrows are displayed on the path to guide the users the direction. The technology provides the indoor orientation and navigation services. The implementation of AR is to help learners to accurately find the learning resources as shown in Figure 1. It is the way of properly connecting abstract concepts with physical objects. In this case, the virtual information shows an image of an egg, English and Japanese of an egg, and the explanations of how an egg is formed. If the system detects that the direction of a learner aligns the poster on the wall, the virtual information will be shown.

The well-informed virtual information with AR technology displayed in a mobile device.
The virtual image and text prompt displayed on the handheld device can help the learner not to lose the direction whilst searching for resources indoors and the searching time can also be reduced. Meanwhile, continuous tracking can be executed by using such a system and the learning status and usage condition can both be recorded.
3.2. Indoor Positioning Implementation
3.2.1. Experimental Setting
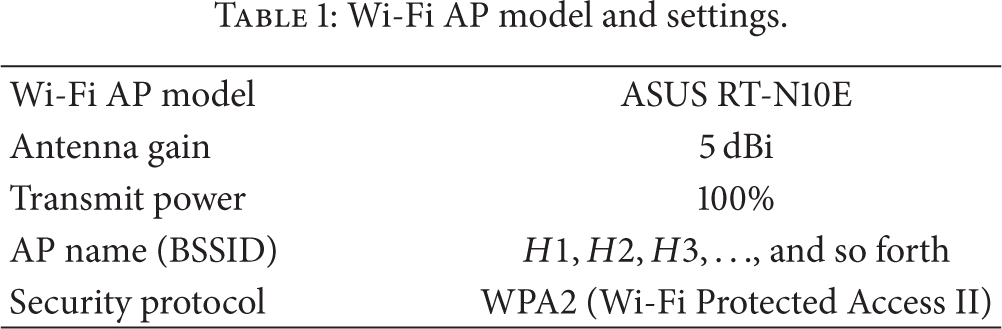
The study uses ASUS RT-N10E Wi-Fi Access Point (AP) to implement two indoor positioning algorithms, and measures RSSI signals to calculate the current position. To minimize the differences of all APs, all APs have the same setting as shown in Table 1.
Wi-Fi AP model and settings.
Based on the actual common specifications of Wi-Fi antennas, the official data of the TP-LINK TL-ANT2415D antenna is shown in Figure 2, if the antenna is installed horizontally, the RSSI signals of the Wi-Fi will have different ratios on vertical planes due to different positions. Thus it is not suitable for this experiment. As for antennas set vertically, they all have the same ratios on horizontal planes, so they will have a higher stability than that of horizontally set antennas if taken as the data of Wi-Fi indoor positioning algorithm. Therefore, all Wi-Fi AP antennas of the study are set to 90 degrees vertically and located on the floor indoors.
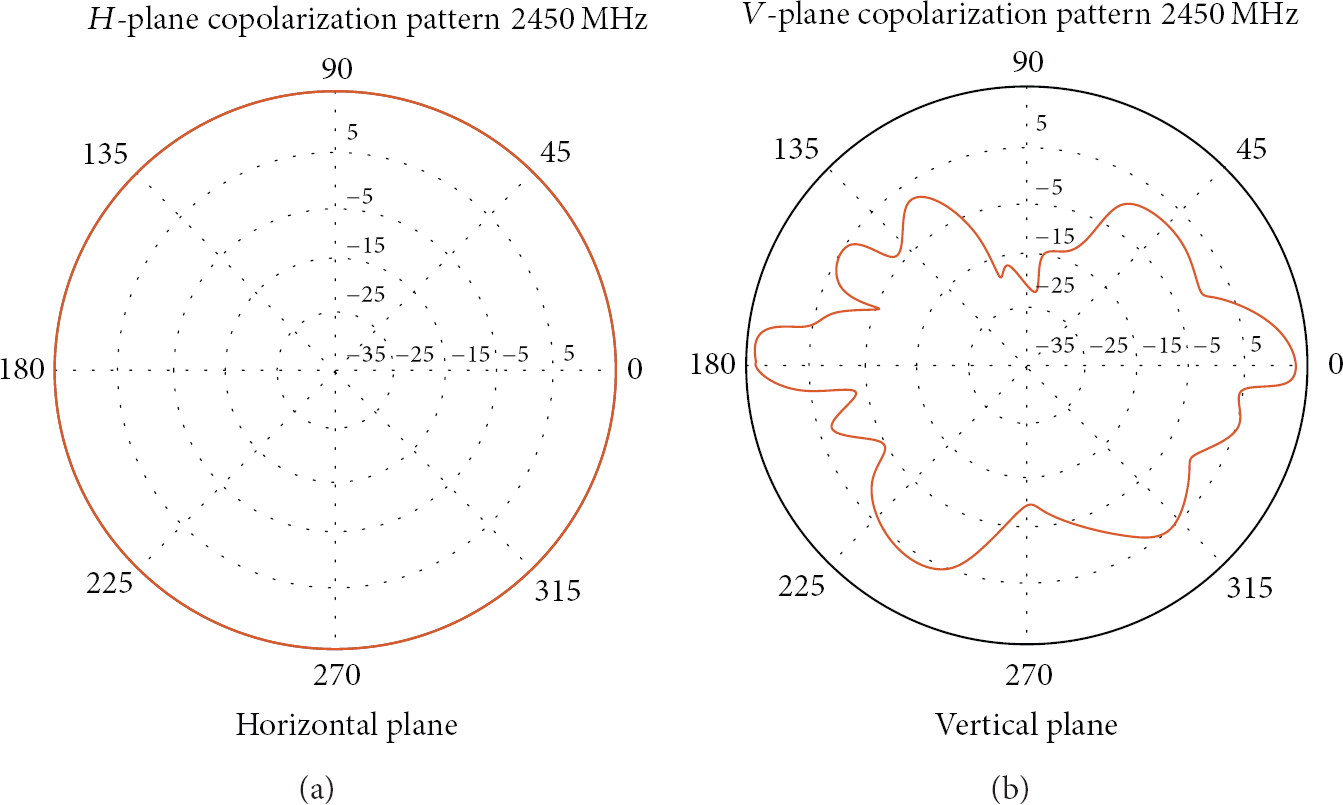
Official data of the TP-LINK TL-ANT2415D antenna (Source: http://www.tp-link.com).
To simulate the change of signals in different situations, the experiment analyses signal data from three areas: near the window, near the stairs, and near the elevator. The procedure is as follows.
Measure the RSSI signals of the APs based on different distances. Put the APs at different locations with a meter as unit and test the RSSI signals between 100 and 150 times.
Measure the RSSI near the window. After putting the AP near the window and measuring, the following data is retrieved (see Figure 3). Based on Figure 3, the statistics of the RSSI changes for Wi-Fi AP near the window, an RSSI signal distribution graph can be drawn as Figure 4. In Figure 4, it can be observed that it is almost impossible to get measurable values for signals near the window after the range over 6 meters. Measure the RSSI near the stairs. After putting the AP near the elevator and measuring, the following data is retrieved (see Figure 5). Similarly, the RSSI signal distribution graph can be shown in Figure 6. It can be observed that the measurable values are all within 7 meters. Measure the RSSI near the elevator. After putting the AP near the elevator and measuring, the data is retrieved as shown in Figure 7. We also draw a RSSI signal distribution graph as shown in Figure 8. Retrieving usable RSSI signals and calculating the environment variables.

The statistics of the RSSI changes for Wi-Fi AP near the window.

RSSI signal distribution graph near the window.

The statistics of the RSSI changes for Wi-Fi AP near the stairs.

RSSI signal distribution graph near the stairs.

The statistics of the RSSI changes for Wi-Fi AP near the elavator.

RSSI signal distribution graph near the elavator.
The actual measured data reveals that the range of usable Wi-Fi signals is around 7 to 8 meters. The data beyond 8 meters can be observed in Figures 4, 6, and 8, and it shows that the repeatability of Wi-Fi signals is too high. If used, the quality of the indoor positioning is severely hindered. This research established an “environment variable” to the database based on the data measured at different locations. The value of the environment variable bases on the actual measured results to build the corresponding distance of the RSSI signals with the method of automatic collocation as the ratio in the algorithm. The environment variables in different locations are shown as Figure 9. Figure 9 shows the environment variables measured at different distances. The environment variables have considerable differences in different environments when the range goes over 7 meters. As a result, when we take samples of the environment variables, we use the values within the range of 7 meters for calculation.

The environment variables at different locations and different distances.
3.2.2. The Trilateration Algorithm
The experiment is performed with three Wi-Fi APs and one smart phone (model name: Samsung I9300), and trilateration algorithm is executed with the environment variables in Figure 9. Considering other factors such as the temperature, moisture, and wind directions, the environment variables only provide the ratio of the current AP location and distance, but not the actual distance. Through the environment variables, the current positions of the APs and the smart phone, the strength of the RSSI signals corresponding to the APs are as shown in Figure 10. More calculation is performed with the environment variables of the smart phone and the database, and we can find the distance ratios of the three Wi-Fi Aps (

Sketch of RSSI retrieving for trilateration.
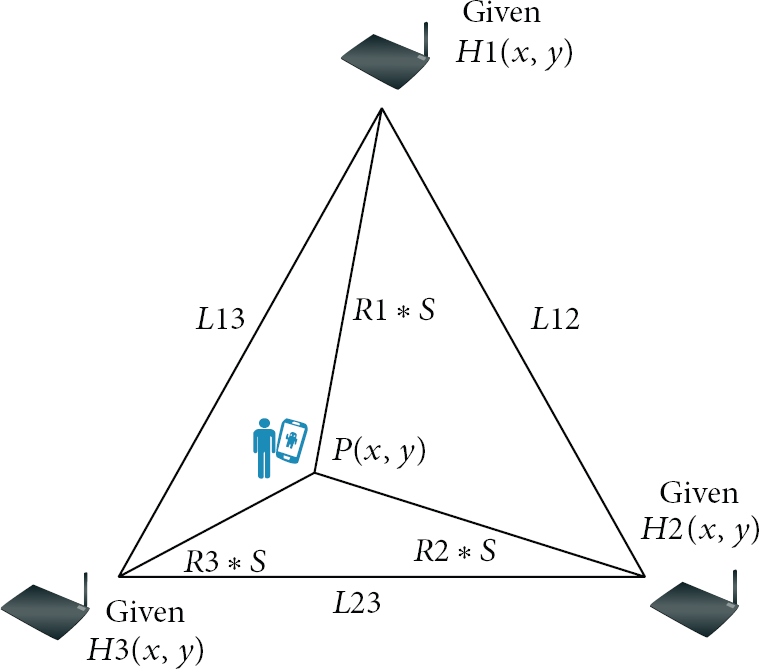
Schematic diagram of trilateration.
In Figure 11, S is a variable ratio (that can be different due to factors of temperature, moisture, and wind).
The example of the trilateration algorithm.

The theoretical value of the algorithm is very accurate with almost no error, but the actual RSSI signals of Wi-Fi are not as accurate as the theories. Therefore the algorithm is not suitable in most situations; if the ratio is incorrect, S might be impossible to derive. Therefore we added intelligent modifications in the algorithm to make the signals that cannot be located into corresponding distance ratios. This avoids the situation where most RSSI signals cannot be used. However, as the actual RSSI signal of Wi-Fi is unstable, the algorithm cannot avoid the vast amount of unstable signals. In response to this, the research proposes the “enhanced trilateration” method to remove the flaws the trilateration method might have.
3.2.3. Enhanced Trilateration Algorithm
The experiment is performed with four Wi-Fi APs and one smart phone (model name: Samsung I9300), and the enhanced algorithm is executed with the environment variables in Figure 9. Considering other factors such as the temperature, moisture, and wind directions, the environment variables only provide the ratio of the current AP location and distance, but not the actual distance. The experiment procedure is as follows.
Step 1 (deriving the distance ratio).
The strength of the RSSI signals of the corresponding AP can be found through the environment variables, the four Aps, and the smart phone (the location to be positioned). We then find the distance ratios of the four Wi-Fi APs through the environment values of the smart phone and the database.
Step 2 (calculating a positioning point).
We first take three Wi-Fi APs to calculate the range of the error ratio (S), then use the distance ratios (

Calculating one positioning point using enhanced trilateration algorithm.
The minimum range
Step 3 (repeat Step 2).
Repeat Step 2 and perform four calculations of positioning points. The four combinations of corresponding distances of WiFi APs are (

Simulation graph of the enhanced positioning algorithm.
Step 4.
Perform corresponding calculating based on the number of positioning points to get the final positioning point.
There is no usable point: no final positioning points are derived. Calculation will be performed again when the next set of RSSI signals of WiFi APs is collected. There is one usable point: this point is the final positioning point. There are two usable points: take the average of the two points to calculate the final positioning point. There are three usable points: take the average of the three points to calculate the final positioning point. There are four usable points: group the four usable points and calculate for the point that has the largest difference to the other three points. Remove this point from the calculation and take the average of the other three points as the final positioning point. The grouping method is shown in Table 3.
Grouping method of enhanced trilateration.

The distance between two points can be calculated by Distance() function.
Based on the condition of the four usable points, the experiment will encounter the four situations below. The calculations are performed as below for respective cases.
There is only one maximum value. Compare among There are two maximum values. Calculate the two points with the largest distance only once, decreasing their shares in the average, and take the average of the point with the largest distance and the other two points. If There are three maximum values. Remove the point with the biggest difference and take the average of the other three points to calculate the final point. There are four maximum values. Take the average of the four points and calculate the final point.
4. Results
4.1. Experimental Results and Comparisons
After the actual testing, the experiment performed 516 positioning calculations with the trilateration algorithm and 545 positioning calculations with the enhanced trilateration algorithm. All intervals between positioning are four seconds. The error value times and error ranges of different distance are derived from the two positioning methods as shown in Tables 4 and 5. It can be found clearly in the error ratio that no errors larger than 3.5 meters appeared for the enhanced trilateration method. On the other hand, errors larger than six meters were found for the trilateration method. This shows that the enhanced trilateration method effectively reduces errors. We then take the statistics of the error distribution of the two methods, and the results reveal that the enhanced trilateration method had better performances in both maximum error value and average error value over the trilateration method, as shown in Table 6.
Error distribution table of the trilateration algorithm.

Error distribution table of the enhanced trilateration algorithm.

The comparison of error values of two positioning algorithm.

From Table 6, we can obtain a big improvement of maximum error values by 51.22%. We further convert the error distribution tables of the two positioning methods into a bar graphs and it can be seen that the error distribution of the enhanced trilateration method is within a smaller range (0.5 m–2 m), and trilateration has a wider range of error (Figures 14 and 15).

Error distribution chart of the trilateration algorithm.

Error distribution chart of the enhanced trilateration algorithm.
As shown in Figures 14 and 15, although trilateration can calculate more signals, it fails to avoid the unstable RSSI signals, resulting in larger errors. On the contrary, enhanced trilateration can use less signals but can effectively avoid unstable and inaccurate signals; thus, it has smaller errors. This proves that the positioning calculated with enhanced trilateration is more accurate, as shown in Table 7.
The total comparison between the proposed trilateration algorithm and the enhanced version.

4.2. The Scenarios of Applying Two Technologies in Real Environments
Augmented reality and indoor positioning technology is suitable for application in learning environments with wide space such as social education facilities of museums and libraries. In the past, guides lead groups in touring these facilities and the learners received information and knowledge passively instead of actively building and exploring knowledge. Although learners are surrounded by diverse and rich learning materials, they might not know what to do without a guide.
Therefore, self-regulated learning plays a key role in this type of situational learning. Self-regulated learning emphasizes that the learner continuously perform self-monitoring and modification towards the learning goals in the learning progress and self-evaluation in the final stages. In learning environments like libraries and museums, it is hard to promote effective learning if guides are too relied on or missing. Thus the students have to complete the processes of setting goals and strategies as well as the self-monitor and evaluation through self-regulation. Tsai et al. pointed out in a review research on self-regulated learning in the past decade that 65% of the researches for college students, followed by secondary school students [26]. Below are paradigms of self-regulated learning, indoor positioning, and augmented realities in educational environments like museums and libraries for secondary and higher education.
Secondary education stresses the nurture of basic thinking abilities. For youths who are in their formal operational stage, the three major abilities of hypotheticodeductive reasoning, compositional reasoning, and propositional reasoning are especially emphasized [30]. The exhibitions, experiment equipment, and 3D theater in the natural sciences museum can assist students to understand and strengthen the concepts of complex cultural and natural sciences through experience. In this wide environment, the assistance of indoor positioning and augmented reality can help students systematically explore the exhibitions in the museum. The instructors, meanwhile, can design adaptive learning materials on the mobile devices to meet the diverse needs of the learners. Static exhibitions can include augmented reality and be blended with tasks of self-regulated learning. For example, at the entrance hall, the mobile device lets students select a learning plan and answer questions on their learning goals (goal setting and strategic planning). When entering the exhibition halls, learning system wizards appear to lead students into thinking about their own learning positions and whether these positions meet the goals they have set (strategy implementation and monitoring and strategic outcome monitoring). When the learning has ended and the students come to the exit, the system displays the degree of learning task completion of the student and issues a self-evaluation survey to evaluate their own learning (self-evaluation and monitoring). Through the assistance of indoor positioning and augmented reality with the combination of self-regulated strategies, secondary students can take more systematic and planned learning in wide exhibition places.
The training of higher education stresses the abilities of independent thinking, exploring, and research [31]. Compared to museums, the systematic presentation of books, literature, and multimedia information in libraries can better provide college and even graduate students resources in all types of knowledge learning. However, the resources displayed in a way of taxonomy in the libraries leads to problems due to the lack of relativity between the sorting method and the display spaces. For example, the area and floor of psychology resources has no relevance with psychology itself. In other words, as the database of libraries is digitized to a very limited extent, it takes time for users to index the information system and look for the actual book in a wide library space. However, with the assistance of indoor positioning and augmented reality, the users can be lead to the direction or location of the resources. In this manner, the time cost mentioned above can be easily converted into the study time. Meanwhile, college students can perform self-regulated studies at a higher degree, a more independent and complex process of self-regulated studies. The instructors, therefore, only have to provide college students of hints to self-regulated strategies, which is different from the interface design for secondary school students. For example, the stage of goal setting and strategic planning can all be performed by the college students themselves depending on their needs. The students set study fields that they want to explore and plan their routes with the positioning and augmented reality system (strategy implementation and monitoring). At the stage of strategic outcome monitoring, students can implement the study plans they have set with the hints and guidance of the system gradually. At all steps, the indoors positioning can detect the correct locations (strategic outcome monitoring) and lead the students into self-evaluation and monitoring with augmented reality. We expect to blend the library resource application with self-regulated strategies and expand the indoor positioning and augmented reality assistance. It will help college students enhance their efficiency and effectiveness when exploring and studying in the library.
5. Conclusion
In this paper, we devise a learning system applying augmented reality and indoor positioning technologies for self-regulated learning. We firstly describe the background of these two technologies and introduce the self-regulated learning and its educational importance in the learning process. Furthermore, we implement these two technologies with mobile devices. In AR implementation, learners can use mobile devices to see the well-informed virtual information instead of fancy 3D models. In order to locate the virtual information in the space, we develop a trilateration algorithm for indoor positioning. However, this algorithm has a weakness that the signals are unstable, which yields the accuracy decreasing in positioning. We then propose an enhanced trilateration algorithm in order to improve the accuracy. The results show that the enhanced version indeed improves the positioning accuracy and the maximum error by 51.22%. This method will contribute to the innovative development of AR educational systems.
Moreover, through the results of this study, the possibility of implementing these two technologies in the museum of natural science (MNS) is expected. The MNS itself covers many resources, including the knowledge in the Nature and Life Science subject. However, due to the massive knowledge range and space, learners may get lost easily in such learning environments. In one informal qualitative interview, one student mentioned that when he was at one spot in the MNS, he had no idea where that area was; this may result in reduced learning effectiveness. Hence the aid of indoor positioning technology navigating learning paths is one direction worth exploring. Through augmented reality, the virtual arrow and text prompt displayed on the handheld device enable the learner to follow a path when they search for indoor learning resources, and the searching time can also be reduced. Meanwhile, continuous tracking can be executed by using such a system and the learning status and use condition can both be recorded.
In addition, when learners are in the MNS, they may have problems operating the instruments, which affects their willingness to use them and in turn reduces the opportunities for learning. If sensitive information such as a QR Code is shown in the description of each instrument, learners can use mobile devices with cameras to scan the code and some prompts will be displayed to show how to operate the instrument and the related topics of Nature and Life Science. Such concept may be put into future research for its degree of aiding the learners.
Footnotes
Conflict of Interests
The author declares that there is no conflict of interests regarding the publication of this paper.
Acknowledgments
This research was supported in part by the National Science Council of Taiwan with a NSC Grant NSC 102-2511-S-025-003. The author would like to thank the contributions of graduate students, Sz Chi Huang and Yu-Wen Chou, who supported this research study by assisting with the experiment planning.