
Abstract
Trash racks are set before inlet sumps of a pumping station with wet-pits in order to block trash. The flow fields before and behind the trash rack were numerically simulated and flow fields in the inlet sump were calculated using the simulated velocity distribution of the section behind the trash rack as the inlet boundary condition. Local head loss of trash-barriering increases with the increase of blockage ratio of the trash rack. When waterweeds block upper part of the trash rack, flow pattern behind the trash rack will be extremely turbulent, flow velocity of lower part of inlet section of inlet sump will increase, flow velocity of the upper part will decrease, and even backflow appears, which will deteriorate the flow pattern and increase head loss in the inlet sump. Trash-barriering has little effect on velocity distribution of impeller inlet section. Trash-barriering will not only increase head and power of the pump but also decrease the flow. For the example of the pumping station: when blockage ratios of the trash racks are 0.3, 0.5, and 0.7, operating cost will increase by 13%~43% than that of without trash racks. Therefore, the trash rack should be cleaned up timely.
1. Introduction
To ensure the safe operation of pump units, the trash rack is often set before inlet passage in pumping station to block trash. Although head loss of the trash rack itself is small, a much larger water level difference will be formed between, before, and behind the trash rack when intercepted trash blocks the flow section, which will increase the operating head and the shaft power of pump, decrease the flow, and deteriorate the flow pattern behind the trash rack, thus affecting the inflow of the pump and deteriorating the energy and cavitation performances of the pump system. When water volume to be pumped of the pumping station is certain, trash-barriering will increase the power of pump units, extend the operation time of pump units, and consequently increase the operating cost. To make things worse, it may cause frequent start-stop of pump units and even crush the trash rack.
Gao et al. [1] calculated and analyzed the flow velocity distributions of inlet and outlet of a pumped storage power station and the head loss without trash in front of trash rack through flow numerical simulation. Ren et al. [2] researched the relationship between the corrosion and clogging extent of trash rack and the increment of head loss of Fengman Hydropower Station through hydraulic model test. Zheng et al. [3] researched the harm of head loss of trash-barriering in pumping station. Odinets's experiments [4] show that location of blocked part of trash rack has little effect on head loss, and blocked range of the trash rack plays a decisive role.
At present, there are few studies about head loss and flow field of trash-barriering when trash rack is blocked by trash. In rural pumping stations, waterweeds are the main trash which blocks the upper part of the trash rack. In numerical calculation we adopted ANSYS CFX software and VOF model [5, 6] to calculate local head loss and flow field before and behind the blocked trash rack of a prototype pumping station. Then, we use velocity distribution behind the trash rack as the inlet boundary condition to calculate and study the influence of trash-barriering on the flow in inlet sump and operation of pump device.
2. Numerical Calculation of Flow Field for Trash-Barriering
2.1. Numerical Calculation Model and Methods
Take a pumping station with an open inlet sump as an example. The trash rack was set in front of entrance of the inlet sump. The pump impeller diameter is 1.0 m. We set up a trash-barriering flow field calculation model with the forebay, the trash rack and trash in front of it, and inlet sump to calculate flow fields before and behind the trash rack with different amount of trash gathered before the trash rack. Figure 1 shows the calculation domain and its structure sizes of trash-barriering flow field with 75° oblique angle (between rack face and horizontal plane) of the trash rack, 2.25 m water depth, 4.8 m3/s flow, 4.15 m length of trash gathered before the trash rack, 1.58 m blocked depth of the rash rack, and 0.7 blockage ratio—blocked area over whole cross flowing section area of the trash rack. Three calculation models with 0.3, 0.5, and 0.7 trash blockage ratios of the trash rack were set up, respectively.

Calculation domain and its structure sizes.
Figure 2 shows the unstructured grids of the calculation geometric model. For the simulation of trash-barriering flow field, because grids near grid bars and cross beams of the trash rack adopt local grid refinement, if total number of grids is too little, meshing cannot be dealt with properly in geometry. On the other hand, if total number of grids is too many (more than two million), the calculating time of the computer is too long. Number of 1088118 grids is suitable because of its moderate calculating time of the computer, and especially it has the same high calculating precision as the grid number of more than two million.

Calculation grids.
The governing equations of the flow field numerical calculation include continuity equation and RANS equations. k-ε turbulence model was adopted here; the equations were dispersed by the finite volume method. Volume of fluid (VOF) model was used to track the water level distribution before and behind the trash rack. The numerical calculation adopted CFX commercial software. In the calculation domain, inlet pressure and outlet mass were used as the boundary conditions, and, at the top of inlet section (water surface), one atmosphere pressure was given. The calculation of flow near walls adopts the wall function; flow with no slipping and adiabatic wall was taken as its boundary conditions.
2.2. Flow Field of Trash-Barriering
When intercepted trash blocks flowing section of the trash rack, the water level difference will be formed between, before, and behind the trash rack and the flow pattern behind the trash rack will also change significantly. Due to slight water permeability of waterweeds gathered before the trash rack, there is a nuance between the two flow velocity distributions of numerical calculation and tested results, but they are similar on the whole.
Figure 3(a) shows velocity distribution of 2.25 m water depth, 4.8 m3/s flow, and 0.5 blockage ratio. Demarcation line of water and air is apparent. Water flow bypasses the trash that has blocked the trash rack and flows through the part of the trash rack that has not been blocked. Velocity in the lower area before the trash rack increases with the decrease of area of flowing cross section. In the area behind the trash rack, velocity in the lower area increases rapidly and decreases in the upper area, and even a large scale of backflow appears. Figure 3(b) shows velocity distribution of section q behind the trash rack based on numerical calculation, which is in front of and 0.5 m far from entrance of the inlet sump, as shown in Figure 3(a). It could be known from Figure 3(b) that velocity in the lower part is quite large, and the backflow in the upper part has a small maximum value. Due to slight water permeability of the trash gathered before the trash rack, there is a nuance between the two flow velocity distributions of numerical calculation and tested results; velocity numerical calculated is a little larger than the real one. The related other velocity distributions have been got by calculating the flow fields of trash-barriering with different blockage ratio of the trash rack.
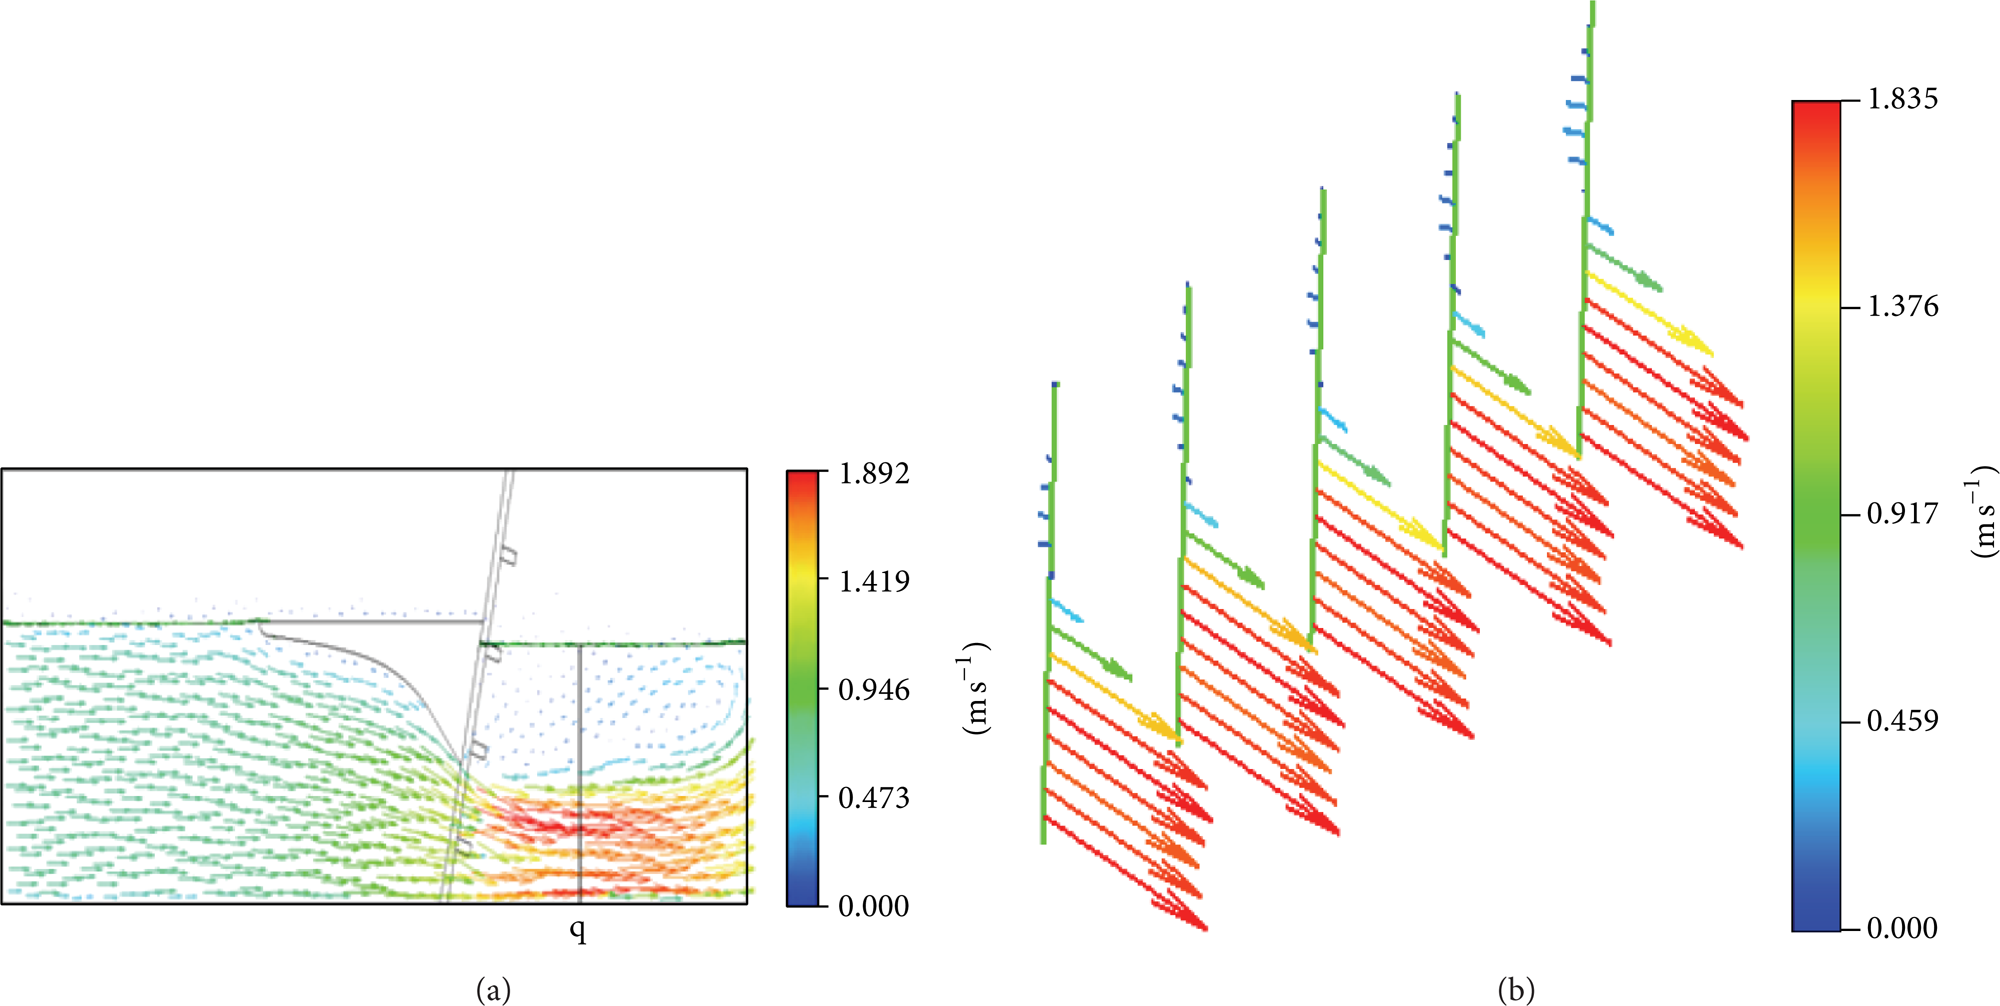
(a) Velocity distributions before and behind the trash rack. (b) Velocity distribution of section q after the trash rack.
2.3. Local Head Loss of Trash-Barriering
Figure 4 shows the nephogram of trash-barriering flow with 2.25 m water depth, 4.8 m3/s flow, and 0.7 blockage ratio. The red part represents water, the blue represents air, the green represents the two-phase flow of water and air, and the white represents trash (waterweeds). A water level difference is formed between, before, and behind the trash rack. The water level difference numerically simulated of different blockage ratio (corresponding to different amount of trash before the trash rack) is almost equal to the actual measured water level difference of equivalent trash. This computing method can accurately calculate the flow field and water level difference of trash-barriering in pumping stations.
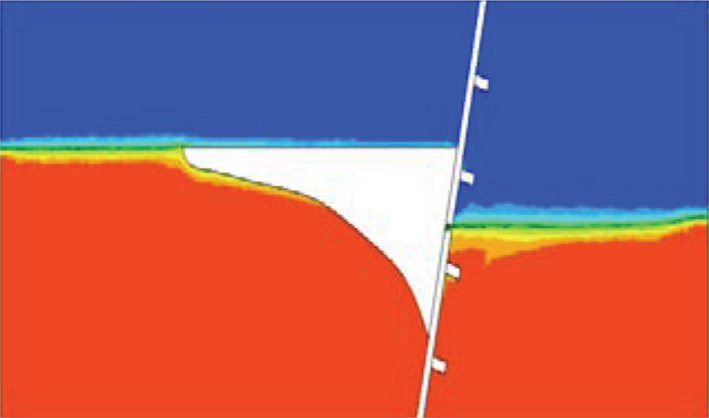
The flow nephogram before and behind the trash rack.
Bernoulli energy equation was established between entrance section of the calculation domain before the trash rack and section q behind the trash rack, from which the local head loss of trash-barriering could be obtained.
Figure 5 shows the relationship among water level difference, local head loss of trash-barriering, and blockage ratio of the trash rack, where the water depth is 2.25 m and the flow is 4.8 m3/s. When the blockage ratio is less than 0.5, the local head loss of trash-barriering increases more slowly with the increase of the blockage ratio. However, when the blockage ratio exceeds 0.5, the water level difference and local head loss will increase more rapidly. When the blockage ratios are 0.5 and 0.7, the water level differences are 0.25 m and 0.69 m and the local head losses are 0.157 m and 0.478 m, respectively, which is consistent with the actual situation of pumping stations.

The relationship between head loss of trash-barriering and blockage ratio of the trash rack.
3. Influence of Trash-Barriering on Performances of Pump Device
3.1. Numerical Calculation Model and Methods
The performance parameters of the pump are as follows: the pump impeller diameter 1.0 m, the design flow 4.8 m3/s, the design head 2.21 m, and the rated speed 490 r/min. The pump has 3 impeller blades and 5 guide vane blades. The pump model is shown in Figure 6.

The pump model.
Figure 7 shows the calculation model of the pump device, which consists of the open inlet sump, the bellmouth inlet, the pump, and a part of the outlet pipe. Section q (shown in Figure 3(a), inlet section of the open inlet sump) was selected as entrance of the calculation domain. The exit of outlet pipe was selected as exit of the calculation domain. The unstructured grid of the calculation geometric model was adopted; the grids near impeller and guide vane adopted local refinement and suitable total number of grids was determined as 876359 through independency test.

The calculation domain of the pump device and its structure sizes.
The governing equations, turbulence model, and calculation methods in numerical simulation of the flow field in the pump device are the same as in Section 2.1. Section q calculated velocity distribution (shown in Figure 3(b)) used as the inlet boundary condition of the calculation domain. The mass was taken as the outlet boundary condition; the mass flow is 4800 kg/s. Free water surface of inlet sump adopted symmetry boundary condition and calculation of flow near the wall adopted wall function and flow with no slipping.
3.2. Flow Pattern in Inlet Sump
Figure 8 shows the streamline in inlet sump with 2.25 m water depth, 4.8 m3/s flow with different blockage ratio. When blockage ratio δ = 0.3, there is only a little backflow near the water surface in the entrance of inlet sump; velocity in the middle and lower part distributes quite uniformly which has little influence on the flow pattern in inlet sump. When δ = 0.5, the backflow zone obviously increases at the entrance of inlet sump. When δ = 0.7, the local head loss of trash-barriering increases rapidly, a large scale of backflow appears around the entrance of inlet sump, and the flow pattern in the first half inlet sump deteriorates and tends to uniform in the second half.

(a) The flow pattern in inlet sump with blockage ratio δ = 0.3. (b) The flow pattern in inlet sump with blockage ratio δ = 0.5. (c) The flow pattern in inlet sump with blockage ratio δ = 0.7.
3.3. Velocity Distribution of Inlet Section of Impeller
To estimate the influence of different blockage ratio of the trash rack on velocity distribution of inlet section of the impeller, the velocity uniformity δ
u
and velocity weighted average angle

where m is the total number of computing elements in the section, u
ai
is the axial velocity of number i element in the section,
According to calculation, when the blockage ratios of the trash rack are 0.3, 0.5, and 0.7, the axial velocity uniformity δ u of inlet section of the impeller is, respectively, 0.895, 0.886, and 0.889; the velocity weighted average angle is, respectively, 84.5°, 84.6°, and 84.3°. Though trash-barriering has a great effect on the flow pattern in inlet sump, it has little influence on velocity distribution of inlet section of the impeller because of rectifying action of the inlet sump and bellmouth inlet. Figure 9 shows the three-dimensional velocity vector distribution of inlet section of the impeller when δ = 0.5.

Velocity distribution of inlet section of impeller when δ = 0.5.
3.4. Head Loss of Inlet Sump and Bellmouth Inlet
In order to analyze the influence of trash-barriering with different blockage ratio of the trash rack on head loss of the inlet sump and bellmouth inlet, Bernoulli energy equation was established as for inlet section of the inlet sump and the outlet section of the bellmouth inlet (inlet section of impeller), and the infinitesimal gravity weighted average method was used to calculate the mechanical energy of per unit weight of water flowing through the calculating section. Head loss of the inlet sump and bellmouth inlet is 0.226 m when the trash rack is without trash. Comparatively, head losses of the inlet sump and bellmouth inlet are 0.255 m, 0.278 m, and 0.425 m when the blockage ratios of the trash rack are 0.3, 0.5, and 0.7 and thus 0.029 m, 0.052 m, and 0.199 m larger, respectively, than that of without trash. Head loss of inlet sump increases with the increase of the blockage ratio of the trash rack because the increase of the blockage ratio will further deteriorate the flow pattern in inlet sump behind the trash rack. After being rectified in inlet sump, velocity distribution in the cross section of bellmouth inlet already tends to uniform and thus has little influence on the flow pattern in the impeller and outlet pipe.
4. Influence of Trash-Barriering on Operation of Pumping Station
4.1. Influence on Energy Performances
For the pumping station with wet-pit, the trash rack is set before inlet sump; there will be local head loss at the trash rack and bad-distributed velocity in the section behind the trash rack when blocked by trash. Furthermore, the bad-distributed velocity behind the trash rack deteriorates the flow pattern and increases head loss in the inlet sump and bellmouth inlet of the pump. However, the trash-barriering has no influence on the flow pattern in the impeller of the pump and outlet pipe because of the effective rectifying action on the flow of the inlet sump and bellmouth inlet.
The pump head will increase because of the local head loss of the trash rack and the increase of head loss in the inlet sump and bellmouth inlet of the pump; consequently, the pumping flow will decrease and pump shaft power will increase (for axial flow pump and high specific speed mixed-flow pump). For the example of pumping station, when there is no trash before the trash rack, the water depth is 2.25 m and the pump flow is 4.8 m3/s; when the blockage ratios of the trash rack are, respectively, 0.3, 0.5, and 0.7, the sum of head losses caused by trash-barriering is, respectively, 0.102 m, 0.209 m, and 0.677 m, and the pump flow will, respectively, decrease by 11.4%, 13.6%, and 16.1%, which is based on the pump performance that the flow will decrease when the water head increases.
The pumping station needs operating 180 days a year when no trash blocks the trash rack. Taking the flow reduction of trash-barriering into consideration, the pumping station needs operating another ∇t hours to meet the demand of the pumped water volume of a year. That is,
where Q0 is the flow of one pump unit without trash; Qδ is the pump flow when the blockage ratio of the trash rack is δ; ∇t is extension of operating time, h.
The pumping station was designed to operate 6 pump units. When the blockage ratio isδ, the pumping station has to increase its operating cost to ensure the certain pumping volume:

where A is the electricity price (the electricity price is 0.509 yuan RMB/(kW·h)); Pδ is the pump motor power when the blockage ratio is δ; ∇Pδ is the increment of pump motor power when the blockage ratio is δ. According to the calculation results, when the blockage ratios are 0.3, 0.5, and 0.7, the annual operating cost will, respectively, increase by 227.3, 342.7, and 747.8 thousand yuan RMB, which is 13%∼43% higher than that of without trash racks. Cleaning up the trash before the trash rack timely will greatly decrease head loss of trash-barriering and the operating cost of the pumping station and thus it is very important for the safe and economical operation.
4.2. Influence on Cavitation Performance
As for irrigation and drainage pumping station, the net positive suction head NPSHa of the pump device is

where pa is the local atmospheric pressure; pv is the vapor pressure at that temperature; H si is the height of the pump below water surface of the forebay; Δh p is the inherent head loss of the inlet sump and bellmouth inlet of the pumping station; Δh b is the increment of total head loss of the inlet sump and bellmouth inlet caused by trash-barriering. Compared with the case without the resistance of trash-barriering, the cavitation in pump will happen more likely because the NPSH a decreases by head loss Δh b of trash-barriering.
5. Conclusions
For a wet-pit pumping station with a trash rack before the inlet sump, waterweeds block upper part of the trash rack, velocity behind the trash rack is quite large in the lower area, and small even backflow appears in the upper area. The uneven distributed velocity in the section behind the trash rack deteriorates the flow pattern in the inlet sump and has little influence on velocity distribution of impeller inlet section because of rectifying action of the inlet sump and bellmouth inlet.
Trash-barriering causes local head loss and increment of sump head loss, which increase with the increase of the blockage ratio of the trash rack, and when the blockage ratio exceeds 0.5, the head losses will increase rapidly. The increment of sump head loss is caused by deteriorated flow pattern. For the example of pumping station, when the blockage ratios are 0.3, 0.5, and 0.7, the local head losses of trash-barriering are, respectively, 0.073 m, 0.157 m, and 0.478 m; the increments of sump head loss are, respectively, 0.029 m, 0.052 m, and 0.199 m.
Head losses of trash-barriering will increase the pump head and decrease the pump flow, and for the axial flow pump and high specific speed mixed-flow pump the pump shaft power will increase. Therefore, the pumping station needs to run for a longer time in larger power in order to meet the pumping water volume requirements; as a result, the operation cost increases greatly. For the example of pumping station, when the blockage ratios are 0.3, 0.5, and 0.7, the annual operation cost will, respectively, increase by 227.3, 342.7, and 747.8 thousand yuan RMB, which is 13%∼43% higher than that of without trash racks.
Head losses of trash-barriering will decrease the NPSH a of the pump device, and the cavitation in the pump will happen more likely.
Therefore, trash-barriering has bad effects on energy performances and cavitation performance of pumping stations. It is very important for the safe and economical operation of pumping stations to clean up the trash rack timely.
Conflict of Interests
All the authors declare that there is no conflict of interests regarding the publication of this paper. All the authors do not have a direct financial relation with the commercial identities mentioned in their paper that might lead to a conflict of interests for any of the authors.
Footnotes
Acknowledgments
This work was supported by the National Natural Science Foundation of China (no. 51079125; no. 51379182), the Author Foundation of the National Excellent Doctoral Dissertations of China (no. 2007B41), and the Industry-University-Research Cooperation Project of Jiangsu Province (BY2012165).