
Abstract
With the aim of numerically replicating a drag reduction phenomenon induced by grooves presence, this paper presents a comparative large eddy simulation study of the flow over a smooth circular cylinder, and the flow over a U-grooved cylinder, at Re = 140,000, which is near transition between the subcritical and critical flow regimes. The grid densities were 2.6 million cells and 20.7 million cells for the smooth and the U-grooved cylinder, respectively. Both meshes were composed of hexahedral cells disposed in a structured form with additional refinements in near-wall regions, in order to obtain y+< 5 values. The cases were simulated during 25 vortex shedding cycles with the purpose of obtaining significant statistic data through the commercial software FLUENT V.12.1, which solved the Navier-Stokes equations in their unsteady and incompressible forms. Regarding the U-grooved cylinder flow, parameters such as the drag coefficient, lengths of recirculation, the transition from subcritical to critical flow, and the formation of a wake formed by secondary vortices of smaller sizes were predicted satisfactorily by the LES technique. From the manner in which the flow separates at different angles for both valleys and peaks of the U-grooves, a distinctive transitional mechanism induced by grooves presence is conjectured.
1. Introduction
The study of the boundary layer formed around a circular cylinder has proven to be a complex issue, mainly due to the adverse pressure gradient presence, which causes a momentum deficit in the boundary layer that promotes flow separation, and the formation of a wake that can be stationary, oscillating, laminar, turbulent, or both laminar and turbulent, which is related closely to the lift and drag forces formed at the walls.
The prediction and control of such features are based on theoretical models derived from experimental correlations and numerical modeling, allowing the optimization of engineering devices such as supports of marine platforms, towers, chimneys, heat exchangers, power transmission lines, nuclear fuel rods, cooling devices, and, in general, any blunt body subject to an external flow.
In relation to the turbulent flow over nonaerodynamic geometries, the main task of a flow control method is focused on suitably modifying the frequencies and magnitudes of the drag and lift forces acting on the walls. According to the classification of Gad-el-Hak [1], the flow control methods can be divided into passive and active, depending on their dependence or independence of an external power supply. Regarding the passive control methods, the modifications of the wall roughness at scales smaller than the boundary layer thickness have proved, in controlled experiments, to be related to important changes in the flow structures of the wake, altering both the oscillation frequencies and magnitudes of the forces acting on the cylinder wall.
Among the main researchers studying this phenomenon, it could be mentioned that Achenbach [2], in 1971, demonstrated that it is possible to artificially manipulate the incidence of critical Reynolds number “Re
c
” through variations of the cylinder surface roughness (see Figure 1). Achenbach studied the phenomenon for a range of Reynolds numbers
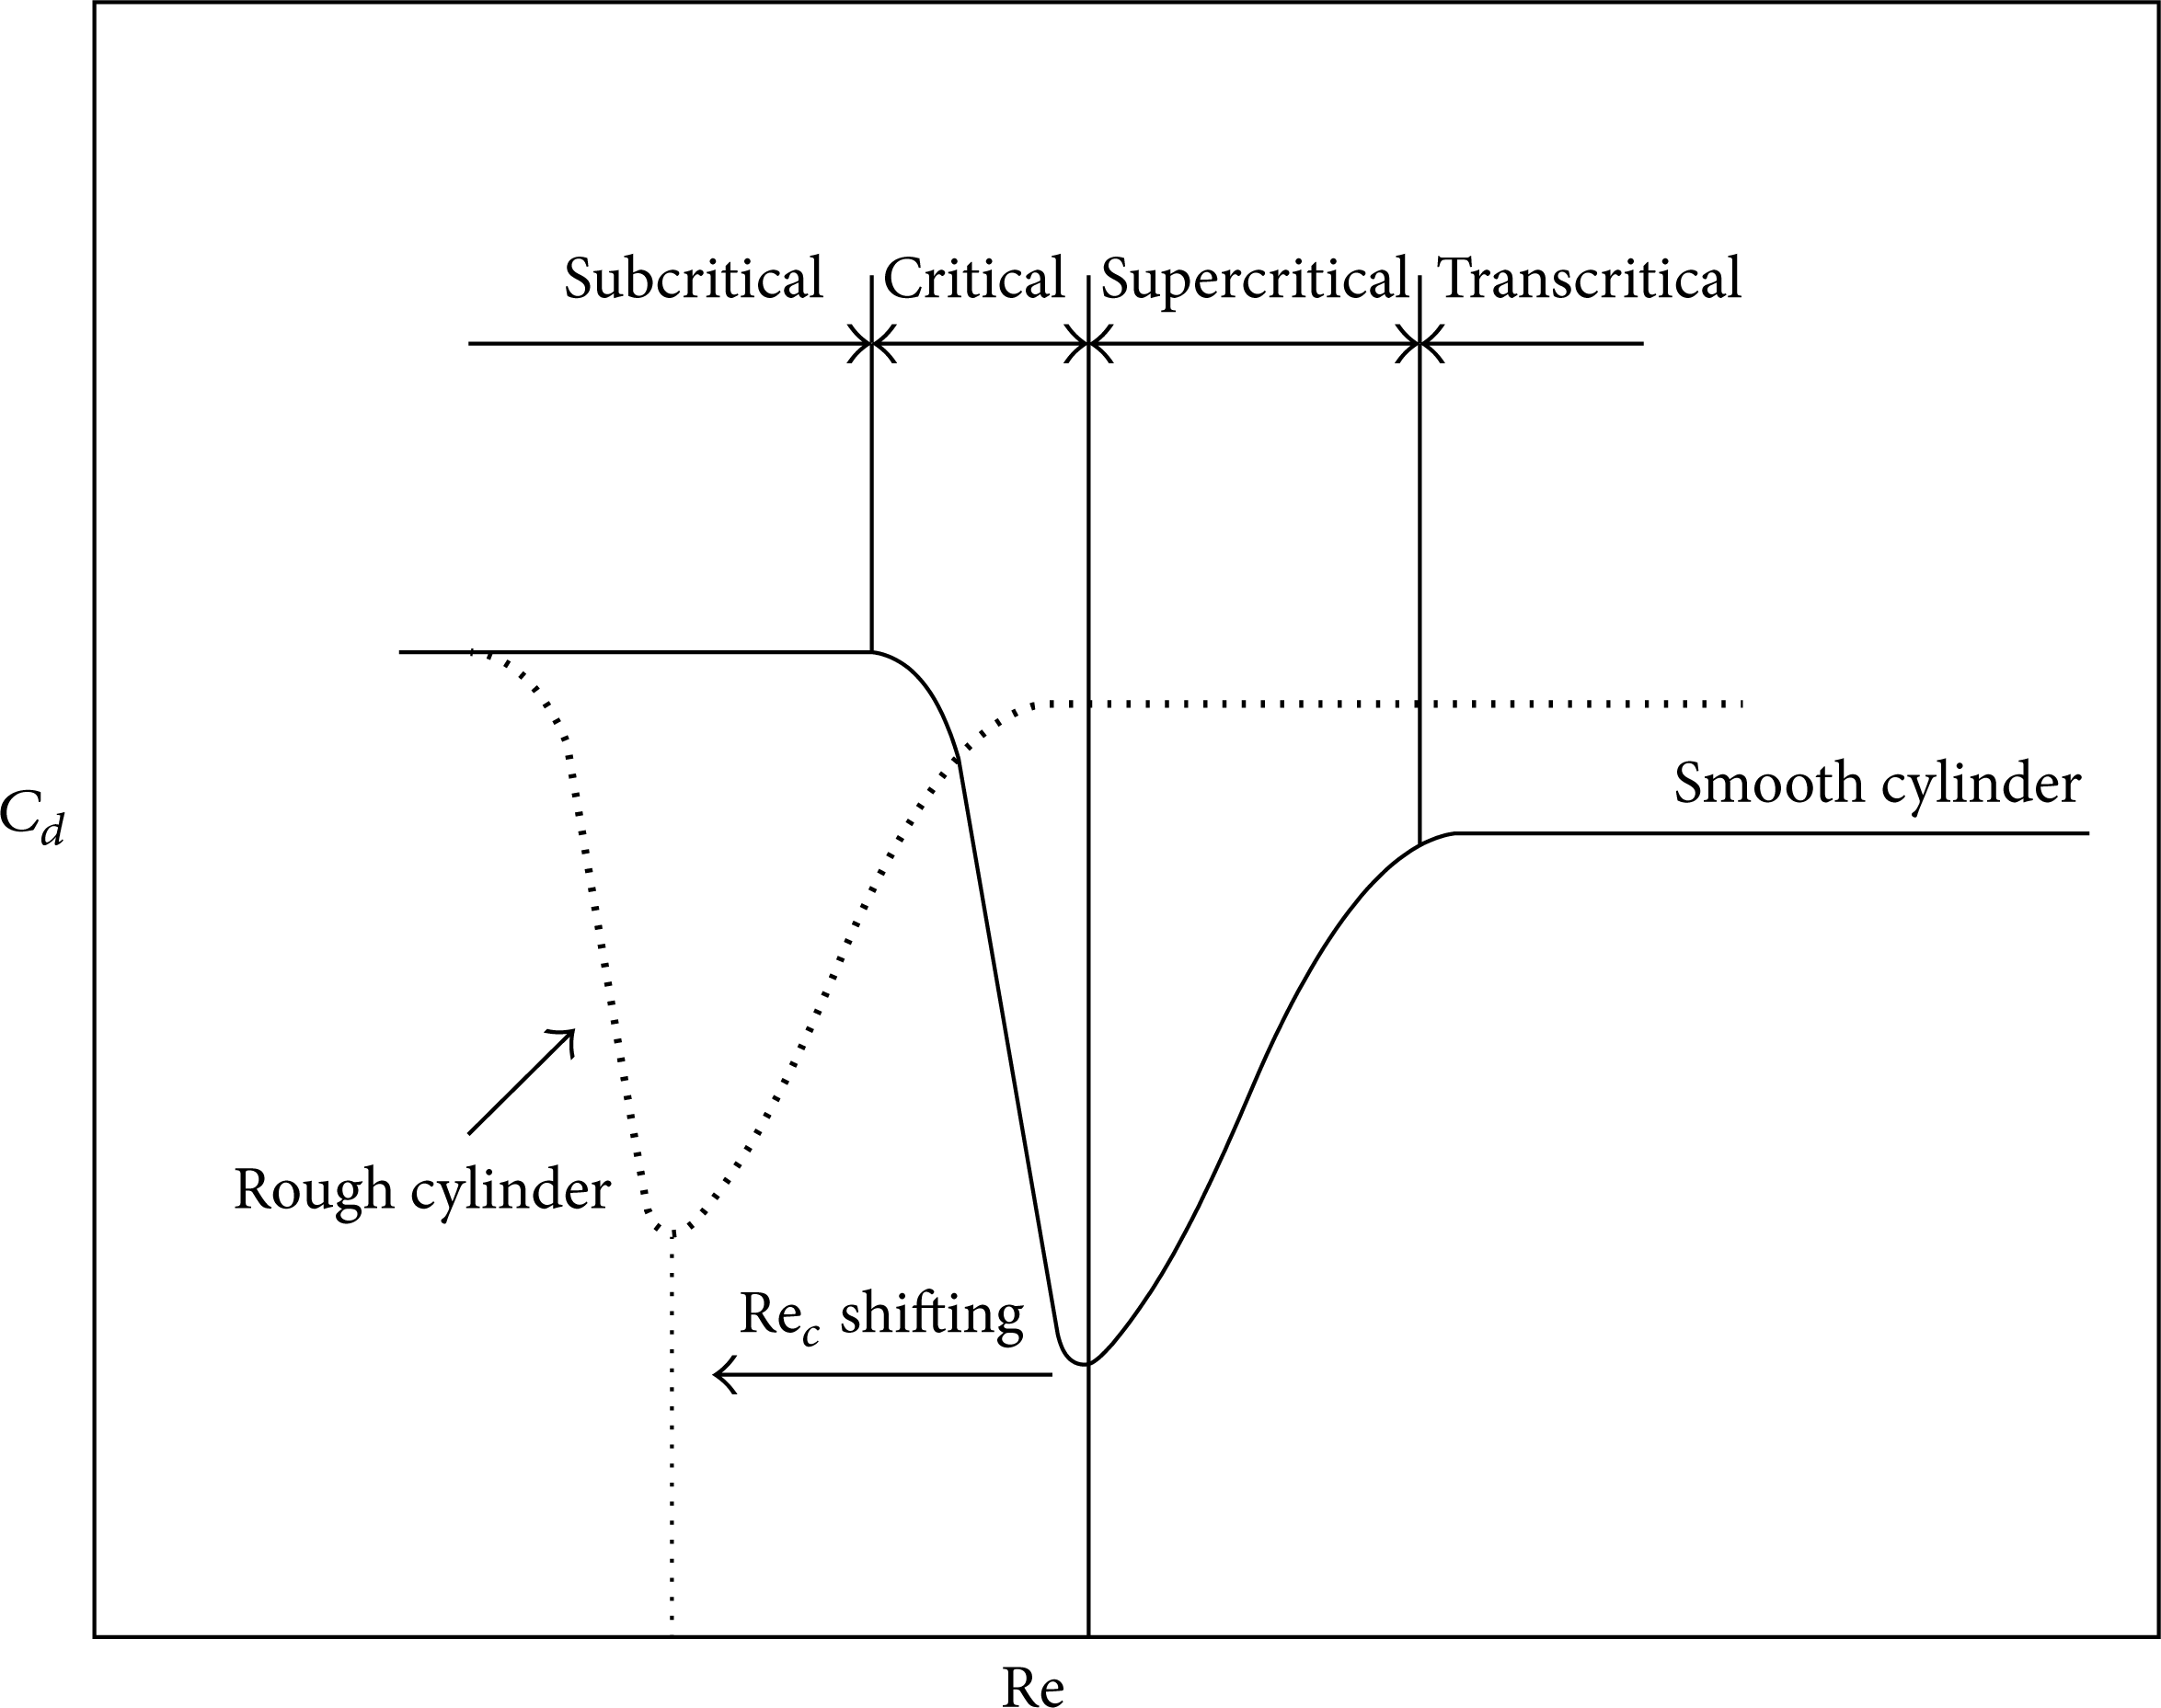
Overall effect of the wall roughness in the flow regimes of a circular cylinder, adapted from Achenbach [2].
Later, in 1980 Guven et al. [4] performed a comparative study of the flow over a rough cylinder, varying the Reynolds number in the range 7 × 10⁴<Re<5.5 × 10⁵, analyzing the effect of different roughness conditions in the flow characteristics such as pressure distributions, boundary layer thickness, and drag coefficients, and presented a detailed comparison of their results with other reports. Their results, besides confirming Achenbach findings [2], brought into consideration the large data scatter present in experiments performed at different aspect ratios L/D, blockage, edge effects, and side walls conditions of the various wind tunnels, mentioning the importance of further efforts to elucidate this phenomenon.
Achenbach and Heinecke in 1981 [5] studied the vortex shedding of the flow over a smooth circular cylinder and the flow over cylinders covered with pyramidal knurls of different sizes at the range 1.3 × 10⁵<Re<5 × 10⁶. Authors reported that for both the smooth and rough cylinder flows, the Strouhal number suffered an increase in the critical regime, being that somehow, this increase was damped due to the influence of the knurls. Additionally, it was reported that the low aspect ratio (L/D) influence on the cylinder flow could be reflected in a suppression of the regular oscillating behavior of the wake structures, causing an early incidence of the supercritical flow regime.
Nakamura and Tomonari in 1982 [6] studied the effect of strips with different roughness sizes adhered to the frontal surface of the cylinder. Their findings showed that, unlike the flow over a fully rough cylinder, the rough strips distributed in certain angular positions near the separation point could cause an early transition to the supercritical flow regime.
In the same year, Walsh proposed the use of riblets as a passive drag reduction device of the shear forces acting on a flat plate. In his study, Walsh [7] compared the performance of a wide variety of riblets with different sizes and cross-sections and pointed out that the maximum profit was given by U and V riblets, obtaining drag reductions in the order of 10%. Walsh related the drag reduction phenomenon to changes in the dissipative structures present in near-wall regions, induced by the sharp edges of the riblets.
Ko et al. in 1987 [8] extended the work of Walsh and studied the flow over a circular cylinder covered with V-grooves, in order to get more insight about the riblets drag reduction effect, but, in this case, applied to a boundary layer affected by an adverse pressure gradient. The Re number range studied by them covered the subcritical and critical flow regimes (2 × 10⁴<Re<1.6 × 10⁵), with heights ranging from h = 0.42 mm to h = 0.60 mm, and angles between valleys from ⌀ = 27° to ⌀ = 42°. In agreement with Achenbach's findings [2], Ko et al.'s results showed that, due to the presence of grooves, it is possible to anticipate the transition from the subcritical flow regime to the critical and from the critical regime to the supercritical. Also, Ko et al. derived a formula to correlate this phenomenon, in terms of the spacing between grooves peaks and the angle of the valley. Although the formula proposed by Ko et al. showed good agreement with the experimental values obtained for the V-shaped grooves, the suitability of such deduction to different cross sectional grooves is still unclear (e.g., U-type, rectangular, trapezoidal, etc.).
In 1991, Leung and Ko [9] studied the characteristics of the flow over a cylinder with V-grooves, covering the subcritical and critical flow regime, varying the aspect ratio of the cylinder in the range 2.0<L/D<4.5. The angle of the grooves valleys and height presented constant values of θ = 19° and h = 1.39 mm, respectively. Ko and Leung mentioned that although both longitudinal grooves and tridimensional roughness (sand paper, knurls) caused an anticipation of the critical Reynolds number, the velocity profiles measured near grooves suggested a different transitional mechanism.
In 2002, Lim and Lee [10] performed an experimental comparison of the flow over a V-grooved cylinder, a U-grooved cylinder, and a smooth cylinder, for the subcritical regime range (8000<Re<140000). The grooves spacings and heights were s = 3 mm and h = 3 mm for the V-grooved cylinder and s = 3 mm and h = 1.5 mm for the U-grooved cylinder. In the work of Lim and Lee, it is established that U-type grooves are more effective as a drag reduction method, in comparison to the use of V-grooves. Furthermore, the change of certain parameters such as the Strouhal number increase and the static pressure recovery in the cylinder rear appeared to indicate an early transition to the critical flow regime, induced by grooves presence.
Lim and Lee in 2003 [11] presented an extension of the previous work [10], but, in this case, focusing on the effect of the U-grooves in the wake structures. The authors stated that the sharp edges of the grooves align the flow and break the near-wall structures, causing the formation of a wake composed of smaller secondary vortices in comparison with the smooth cylinder flow. These smaller secondary vortices, according to the authors, also cause a reduction in the turbulent kinetic energy on the near wake region.
With respect to commercial applications, Lee et al. in 2005 [12] reported a method to manufacture V-grooves with heights of about h = 0.5 mm. In their work, authors reported drag reductions of 10% induced by the grooves presence at the Reynolds number of Re = 4800, confirming previous reports of the presence of a wake formed of smaller secondary flow structures, and a redistribution of the kinetic energy in the recirculation zone. Regarding the manufacturing process of the grooved surfaces, the authors also stated the difficulties arising from the alignment and homogeneity of the produced surfaces. Apparently, the pureness of the implemented materials plays an important role in the quality of the roughness geometrical conditions.
Based on the above, it can be mentioned that the problem of the flow over a circular cylinder with controlled roughness, in general, has been studied from two approaches. The first one is based on three-dimensional geometrical modifications such as those conferred by sandpaper and knurls, which cause early transitions to the critical flow regime. The other approach is based on replicating the drag reduction effect induced in flat plates for U and V-riblets, but in this case in cylindrical geometries.
Both trends have focused largely on studying the phenomenon from a global point of view; that is, there is an important amount of information regarding the variation of parameters such as the drag coefficient, Strouhal number, and wake structures obtained from methods as hot-wire anemometers, PIV, and conditional sampling [13], in terms of the Reynolds number. However, there is a lack of information about the velocity fields and flow structures in the near-wall regions, which are related to the drag and lift forces, and this information could be useful to improve the knowledge of the drag reduction mechanism.
The following work presents a comparative study based on the results of the LES technique of the flow over a smooth cylinder, and the flow over a U-grooved cylinder at the Reynolds number value of Re = 140,000, which is near the boundary between subcritical and critical flow regime, where it is expected a drag reduction effect induced by the grooves presence. The abovementioned has two purposes: the first one is to explore the LES capabilities to reproduce the influence of the adverse pressure gradient on the boundary layer, the flow separation, and wake formation present in the physical phenomenon, and the second is to present information derived from the velocity field and flow structures in near-wall regions, in order to gain some insight about the phenomenon. For analysis purposes, the cases presented were named A and B, denoting the flow on a smooth cylinder and the flow over a U-grooved cylinder, respectively. Finally, the U-grooves implemented were semicircles, with height and spacing of h/D = 0.025 and s/D = 0.05.
2. Materials and Methods
2.1. The Large Eddy Simulation Technique
The large eddy simulation technique is based on the theory of Kolmogorov's energy cascade, which states that the largest eddies which rotate at lower frequencies and contain the most of the flow turbulent kinetic energy, depending on the geometrical dimensions of the disturbing element (i.e., the diameter of the cylinder), being that the smallest eddies, which have higher oscillating frequencies and dissipate the energy on the walls, are considered isotropic, and for that reason, more susceptible to a universal modeling such as those used by the RANS averaging technique. Taking this into consideration, the LES technique filters the Navier-Stokes equations, solving directly the most energetic eddies, being the contribution of the nonfiltered eddies of universal sizes, modeled due to a subgrid scale model (SGS model) which generally depends on the size of the cells. Often, in the LES model, it is considered that the SGS model contribution induces smaller errors when a fine mesh is used, in comparison with the RANS models [14].
2.2. Governing Equations
In the LES model, the Navier-Stokes filtered equations could be expressed as

In (1), the symbol “
In the classical Smagorinsky model [17], it is considered that the residual anisotropic SGS (subgrid scale stresses) and the filtered strain rate tensor
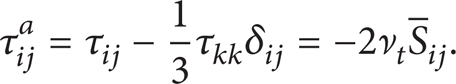
In (2), the term

with

C
s
being the Smagorinsky constant and
2.3. Solution Method
In this work was employed the segregated solver of the commercial package FLUENT V.12.1, which applies the finite volume method to approximate the solution of the Navier-Stokes equations in their unsteady and incompressible forms. In order to improve the accuracy of the solution, all constructed meshes were composed of hexahedral elements distributed in a structured way. To avoid the numerical diffusivity problems caused by the use of forward or backward schemes, the convective and dissipative terms were discretized by the second order bounded central differences of Leonard [18]. The temporal terms of the governing equations, which are responsible for the temporal evolution of the solution, were discretized by a fully implicit second order central differences scheme. The pressure-velocity coupling of both continuity and momentum equations was performed using the PISO predictor/corrector algorithm, which is a further improvement of the SIMPLE algorithm, which has proved to provide better convergence in problems that deal with unsteady external flows [19].
2.4. Grid and Computational Domain
Figure 2 shows the overall dimensions of the computational domain used in the LES cases, which were chosen taking into account other LES studies for the flow over a circular cylinder at subcritical regime, as Kim and Mohan [20] and Catalano et al. [21].

Overall domain extents chosen for the flow over a smooth cylinder (Case A), and the flow over a U-grooved cylinder (Case B).
Due to the high computational costs related to the LES model for this kind of high Reynolds number flows, for the flow over the smooth cylinder, the grid independence study was performed using the RANS k-ω model, which is applied to transitional flow regimes [22]. In agreement with Breuer's findings [15], which suggest 64 elements distributed along a 2D extent in the “z” direction, and considering the fact that the nodal distribution of the depth plays a key role in the time consumption of a LES simulation, the nodal distributions of the meshes constructed for Case A were varied only in the x-y plane, presenting 64 elements uniformly distributed along the spanwise direction. Concerning the radial discretization, although there is poor information about the influence of this parameter in the response of the numerical code, it seems to be critical in the accurate prediction of both pressure and shear forces acting on near-wall regions. Taking this into consideration, all constructed meshes for Cases A and B were constructed with 200 elements uniformly distributed along the cylinder's periphery, rather than the 165 elements suggested by Breuer [16].
Table 1 presents the sizes and velocities in the main direction at the intermediate point x/D = 10 located at the midplane x-y, for the 3 constructed meshes to evaluate Case A, which for analysis purposes were named A1, A2, and A3. From the results, it can be seen that between A2 and A3 grids, the variation of the results was less than 0.27%; for this reason, in this work was chosen the mesh of 2,581,120 cells for Case A. Figure 3 depicts a slice at the midplane z = 0 of the mesh A2.
Grid independence results of Case A LES.


Nodal distribution of the mesh used in the LES of the subcritical flow over a smooth cylinder (slice at plane z/D = 1).
In the case of the flow over a U-grooved cylinder (Case B in Figure 2), a computational domain that replicated the presence of 40 grooves distributed along the spanwise direction and aligned with the flow direction was built. The grid independence study of Case B was conducted considering the x-y nodal distribution derived from the mesh independence from Case A and using the same turbulence model.
Due to the need of capturing the effect of 40 grooves distributed uniformly along the cylinder's depth, the nodal distribution along the spanwise coordinate was increased. In accordance with the latter and as shown in Table 2, four meshes named B1, B2, B3, and B4 were evaluated, which presented 240, 400, 560, and 800 elements distributed along the z-coordinate, meaning nodal distributions between groove peaks of 6, 10, 14, and 20 elements, respectively. Figure 4 shows the velocity distribution in the main flow direction of the 4 meshes built and the experimental data reported by Cantwell and Coles [23], plotted at the horizontal line defined by the range 0.5<x/D<3.0 in z/D = 1, immersed in the recirculation zone, where flow gradients are considered to be important. From Figure 4, it can be seen that the velocity data obtained for B3 and B4 meshes presented almost the same values.
Grid independence study performed for the U-grooved cylinder flow.


Nondimensional mean velocity component obtained in the recirculation line for the B case grid independence study.
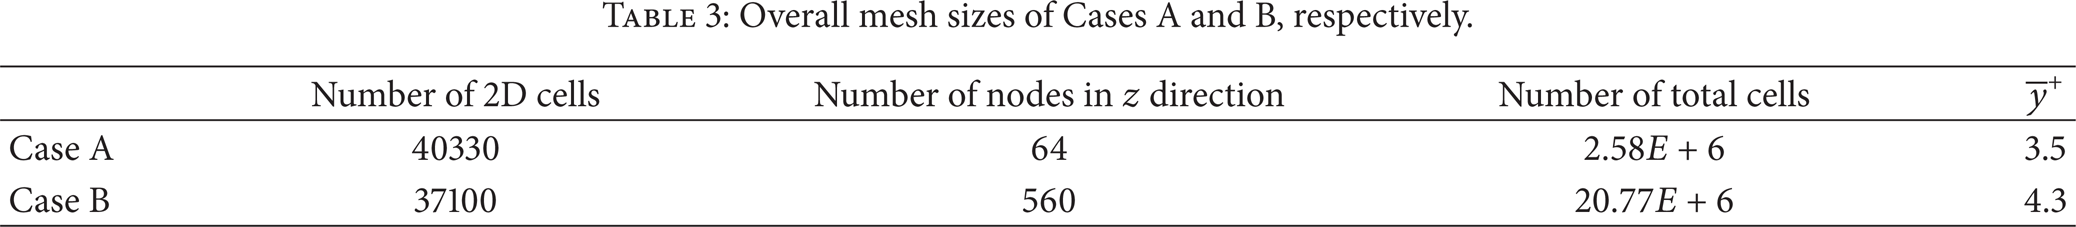
Even if velocities and the drag coefficient of Case B meshes (see Table 2) seem to be far from the experimental values, works such as those of Catalano et al. [21], Benhamadouche, and Laurence [24], to name a few, have pointed out the inefficacy of the RANS models to adequately reproduce the physical quantities of flows with unsteady wakes. For such reasons and considering the impact of the nodal distribution in the “z” coordinate in the computational costs, the B3 mesh was selected for the LES simulation of the U-grooved cylinder. Figure 5 shows a zoom of the z-y plane, located in x/D = 0 for the B3 mesh. Finally, for both cases, additional refinements were conducted in the near-wall boundary layer through the y+ adaptive mesh refinement in order to locate the first cells within the viscous sublayer. Table 3 shows the overall dimensions of the final meshes used in the LES simulations for Cases A and B, respectively.
Overall mesh sizes of Cases A and B, respectively.
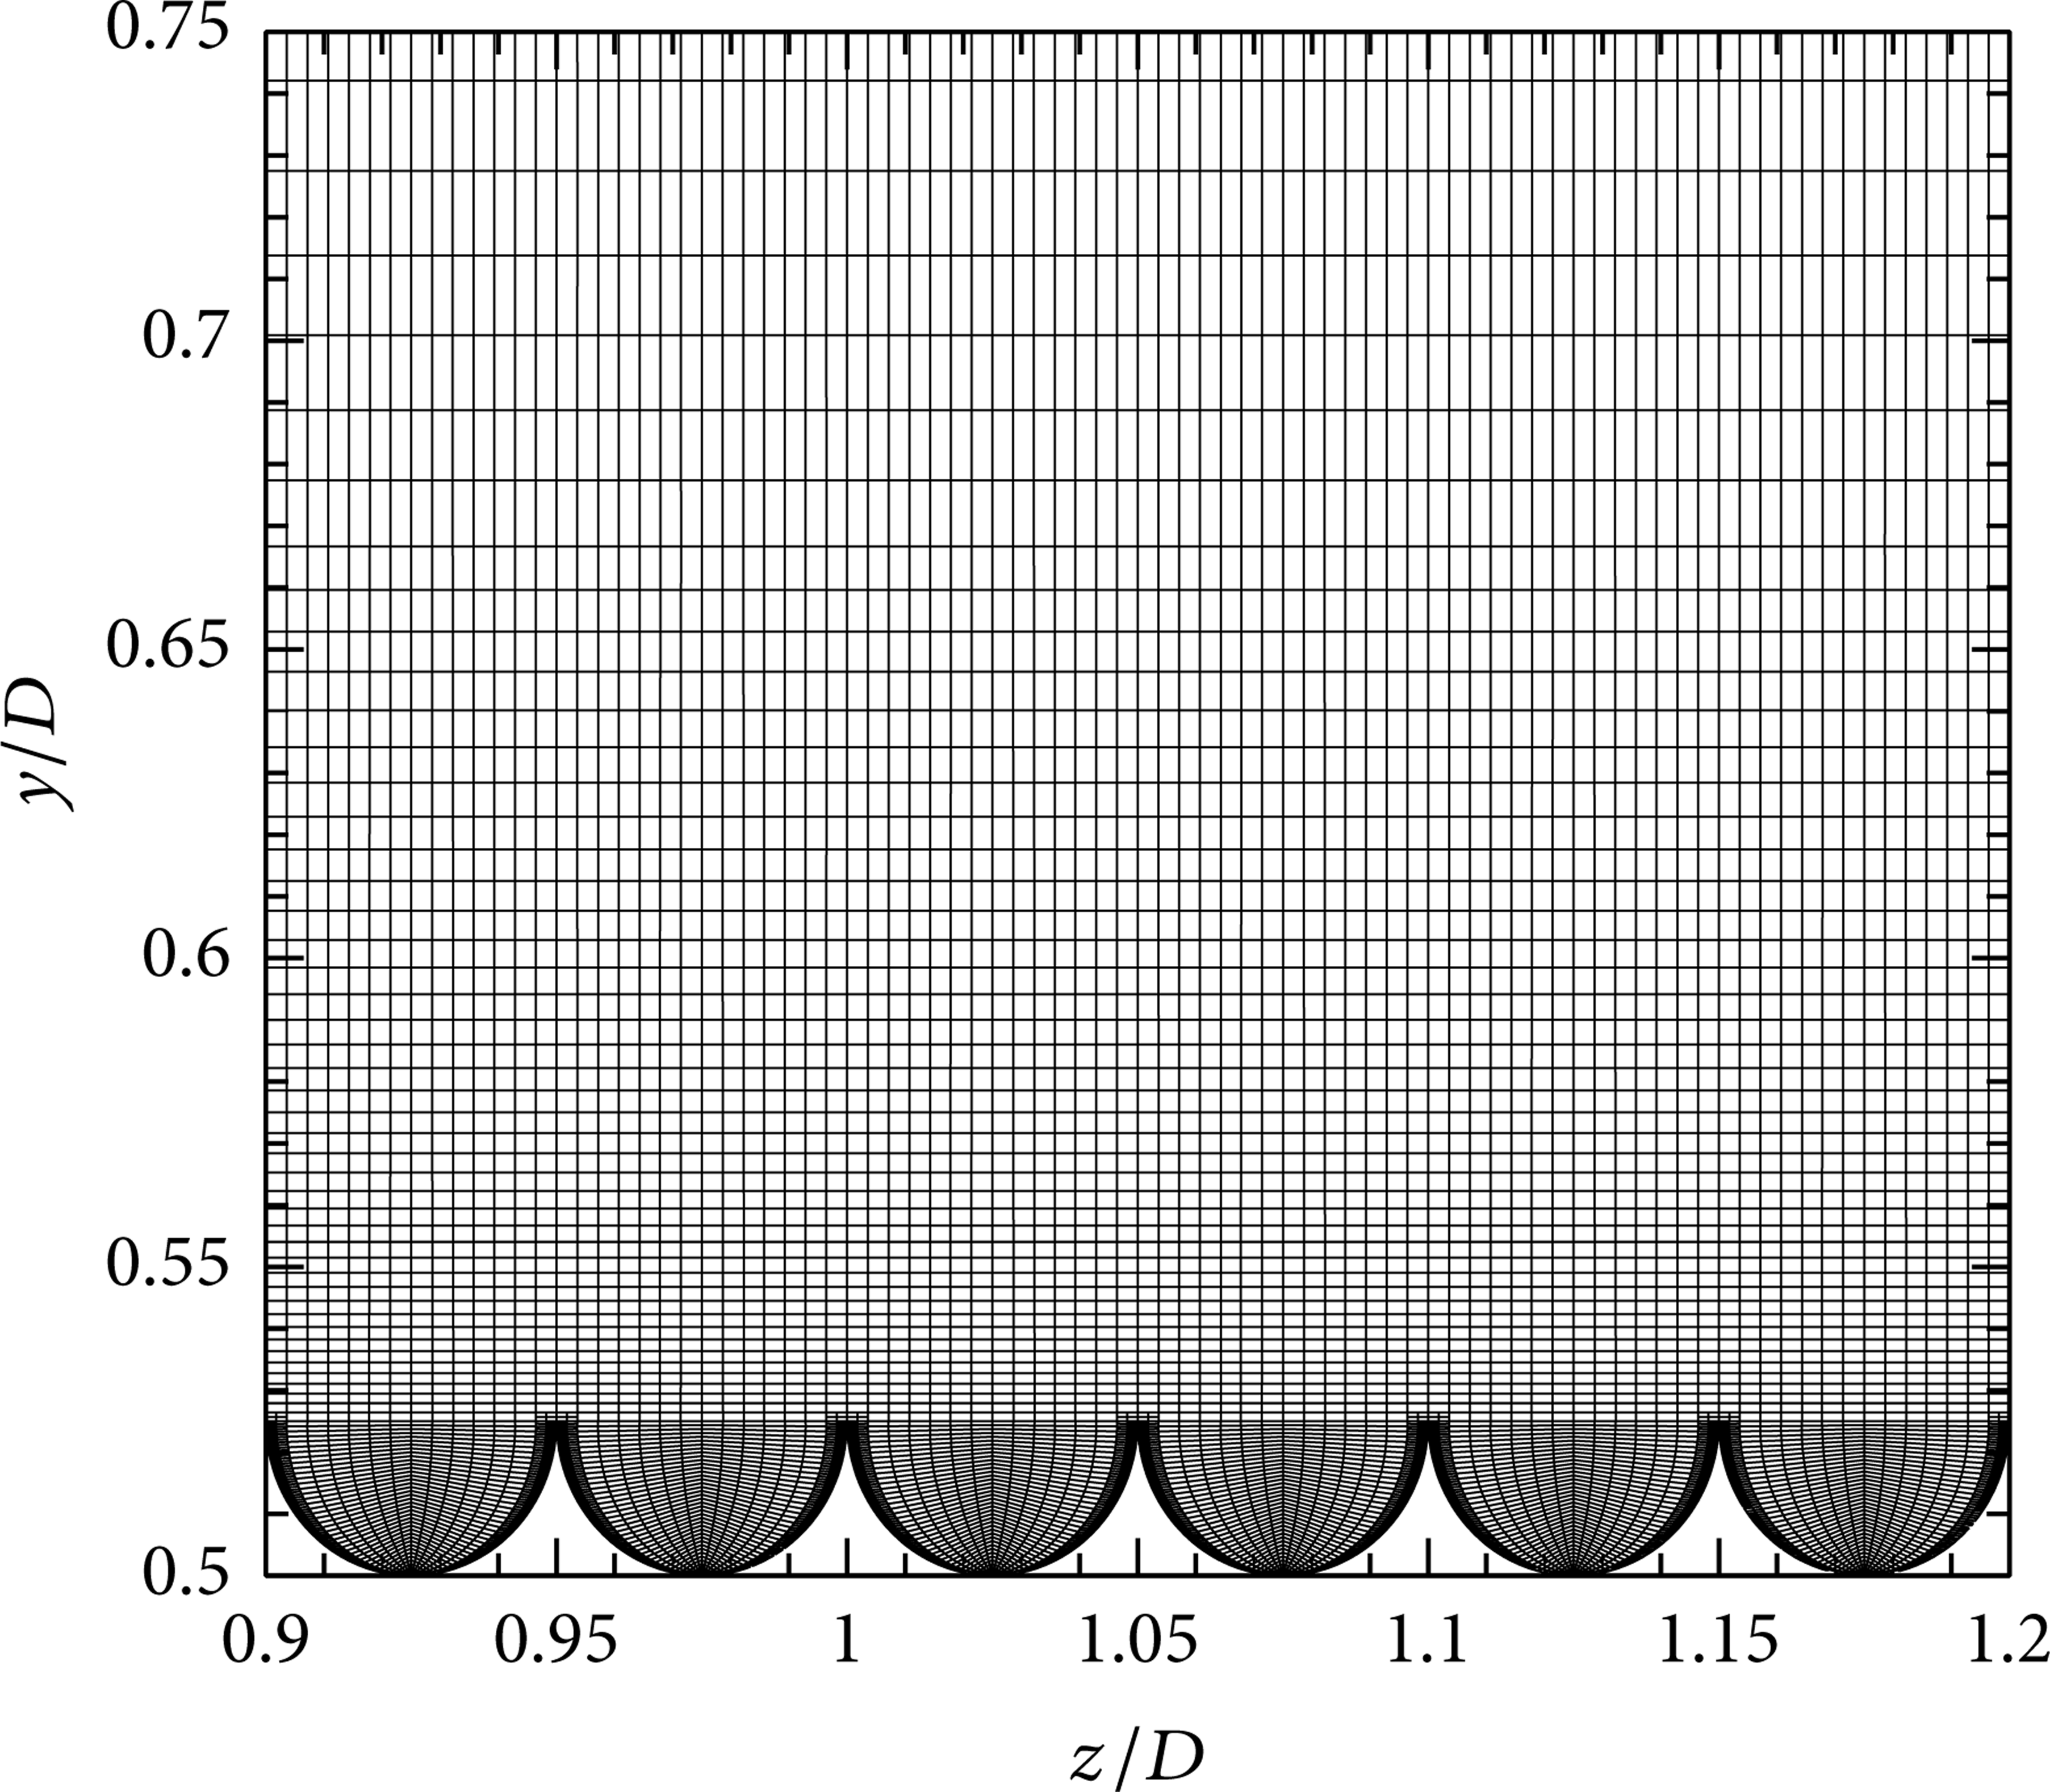
z-y plane normal to the flow direction view of the U-grooved cylinder grid.
2.5. Boundary Conditions
At the inlet of the computational domain was prescribed a uniform velocity profile (u = 1, v = 0, and w = 0). In the domain outlet, the outflow boundary condition in its convective form was implemented, expressed by
3. Results and Discussion
Figure 6 shows the results of the “x” velocity component along the entire trail (y = 0 line), located in the plane z/D = 1, for Cases A and B, compared to the LES simulations of Kim and Mohan [20] and the experiment of Cantwell and Coles [23], both focused on the analysis of the flow over a smooth cylinder at Re = 140,000.

Nondimensional mean velocity component measured along the wake midline.
In this work, the Cantwell and Coles results were preferred to compare the studied cases, due to the highly bidimensional flow conditions of their experiment, given for a high aspect ratio (L/D ≈ 29.3), a blockage of about 0.3%, and turbulence intensity levels lower than 0.6%. Regarding the LES of Kim and Mohan, it was performed using the same commercial software, so it was considered as another important reference. In relation to the obtained results, in the figure could be seen an overall good agreement between Case A results and the experimental and the numerical values used for comparison. Regarding Case B, apparently, the main effect of the grooves was reflected in an increase in the recirculation bubble length (obtained from the geometrical length between points, where u = 0), which suffered an increase from L r ≈ 0.8 for Case A until L r = 0.95 for the U-grooved cylinder flow. The latter was confirmed by the comparison of the time-averaged streamlines plotted at the central xy plane, at z/D = 1 of the two studied cases, shown in Figure 7. Another important characteristic that is also shown in the figure is the average displacement of the separation point (downstream movement) present in the flow over the grooved cylinder, this feature being related to a decrease of the drag forces present in the cylinder periphery. This makes sense if it is considered that grooves lateral walls confer an alignment effect to the flow, causing an increase of the laminar flow region of the cylinder front part that retards the flow separation, causing then a drag reduction.
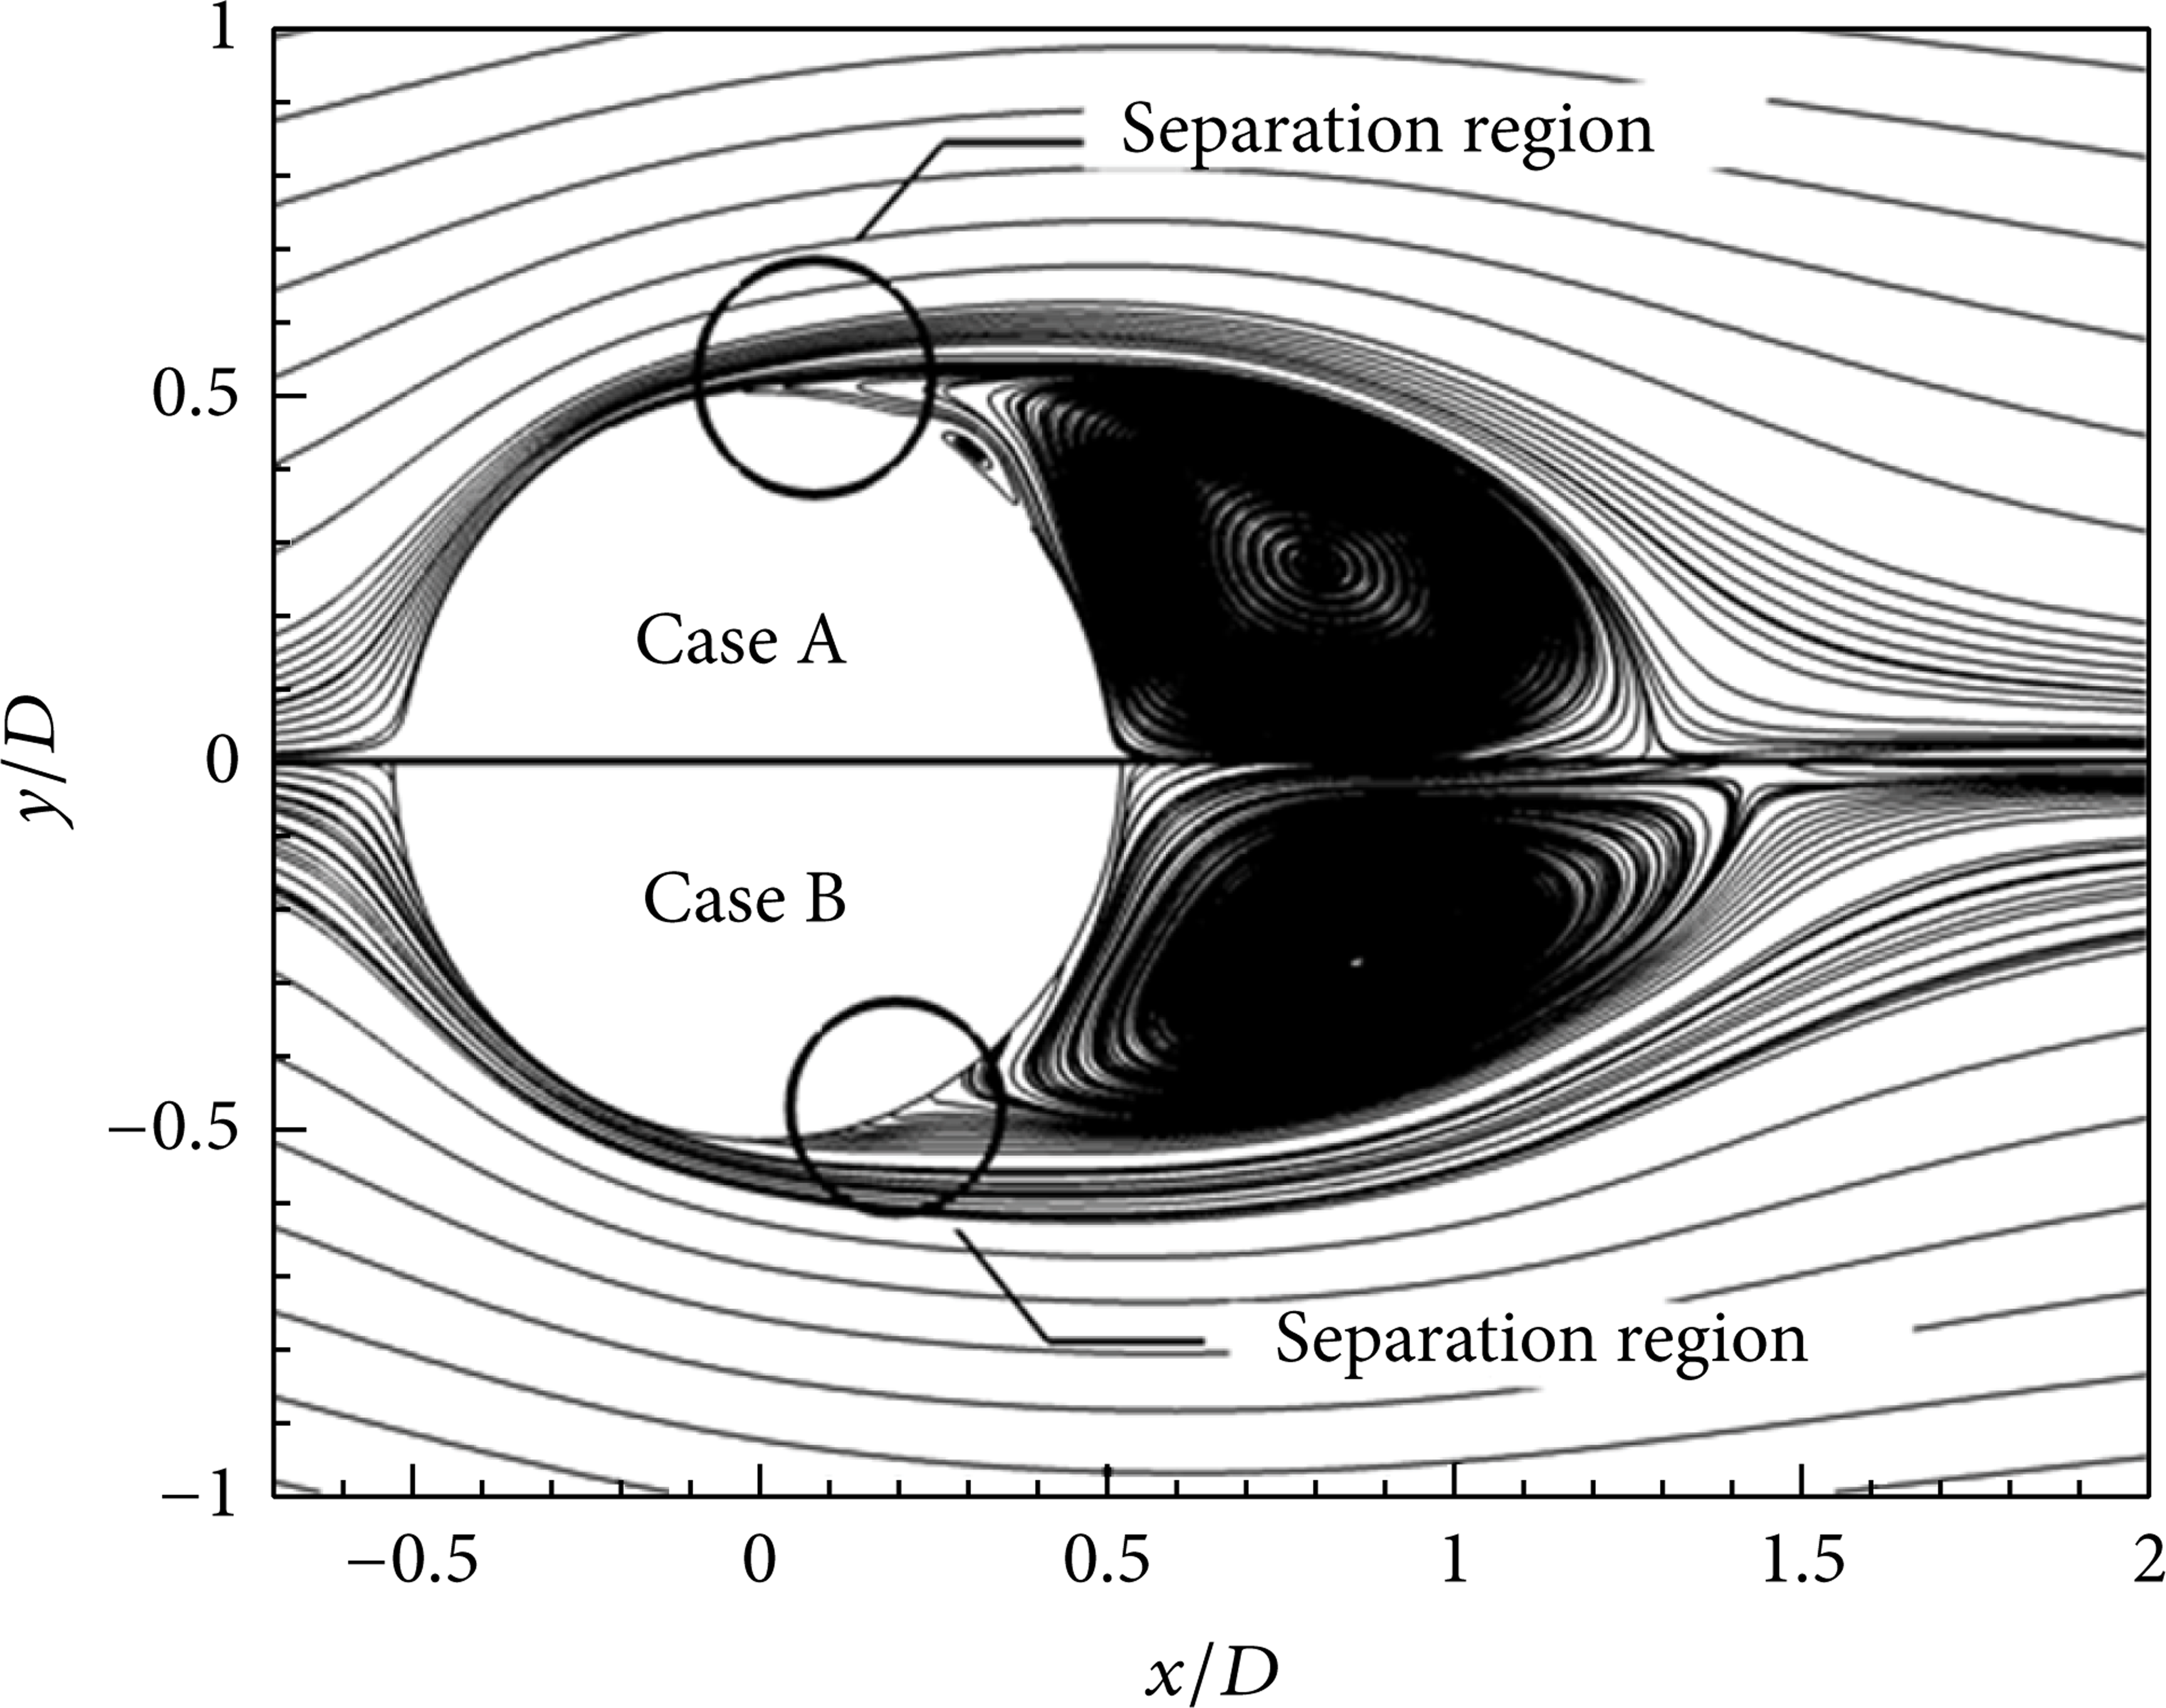
Time-averaged streamlines for the smooth cylinder flow, and the U-grooved cylinder flow, plotted in the midspan plane
Although this increase in the L r size was also reported in the flow visualization performed by Lim and Lee [10] in a water channel, their experimental conditions presented a blockage of 25%, which turns out to be a fairly high value, if it is considered that the limit value for experiments free of such effects is commonly of 10%. Also, it is interesting to note that Lim and Lee [11], in a complementary work subsequently performed using the PIV technique to the flow over a U-grooved cylinder at the same Reynolds number, reported a reduction of approximately 8.3% in L r , which decreased from a value of 1.2 to 1.1, due to the effect of the cylinder grooves. Even though the PIV results appear to be the most persuasive, the L r reported by Lim and Lee for the smooth cylinder flow turns out to be more than twice the 0.5 value reported by Cantwell and Coles for the same case, which states an important difference that defines the need of more detailed studies.
Figures 8 and 9 present the “u” and “v” velocity component for Cases A and B, obtained from the vertical line x/D = 1, located in the midspan plane z/D = 1, in comparison with Cantwell and Coles experimental data for the same Reynolds number. From Figure 8, it could be seen that the velocities obtained for the two studied cases were very similar, presenting good agreement with the experimental data. Apparently, the grooves did not cause significant changes in this parameter, in contrast to Figure 9, where the effect of the grooves was reflected in an attenuation of the normal flow velocity, in particular, within the recirculation zone (−1<y/D<1). This can be understood as a decrease of the mean kinetic energy present in the recirculation bubble of the grooved cylinder when compared to the smooth cylinder flow, which could be related to the alignment effect and the movement of the aforementioned separation point. Apparently, the U grooves not only elongate the recirculation bubble, but also modify the energy exchange of its inner zone.

Streamwise velocity component obtained from the vertical line x/D = 1 located at the midspan z/D = 1.

Normal velocity component obtained from the vertical line x/D = 1 located at the midspan z/D = 1.
The “x” and “y” turbulence intensities, obtained along the y = 0 line, located at the midspan in plane z/D = 1 are shown in Figures 10 and 11. From both figures, it is possible to note that Case A results were overpredicted, especially in the recirculation zones located in the rear of the cylinder in the range 0<x/D<3. According to the B2 model of Breuer [15] (LES with C s = 0.1), apparently, the 64 elements uniformly distributed along the span-wise coordinate were not sufficient to adequately capture the “x” and “y” turbulence intensities. Moreover, referring specifically to the turbulence intensity in the “y” direction, Benhamadouche and Laurence [24] conducted a numerical study of the flow over an array of cylinders, using the LES and RANS techniques, comparing the response of both models with experimental data and DNS, in a domain of 1D of depth, with 20 nodes equally spaced along it. In their simulations, were also presented overestimated curves of the turbulence intensity in the “y” direction. It seems that when the nodal distribution in the depth direction is not fine enough, the turbulence intensities, especially in the “y” direction results, are overpredicted in the recirculation zones. Considering the fact that this was the only parameter that was overpredicted for Case A LES results, and taking into account that other important parameters as separation points, pressure distributions, oscillation frequency, and drag and lift forces were adequately predicted, the simulation was considered useful, and it was used as a comparison reference.

Turbulence intensities in the “x” direction for the two studied cases, measured in the wake center-line (y = 0).

Turbulence intensities in the “y” direction for the two studied cases, measured in the wake center-line (y = 0).
For Case B, however, considering that the discretization in the “z” coordinate was increased significantly from 64 to 560 elements, the LES model was able to provide information more consistent with the experimental flow behavior observed. From the curves, a significant attenuation could be seen in the turbulent fluctuations for both components along the entire trail, when compared to the experimental results. Furthermore, it is interesting to note that the distribution of the “x” turbulence intensity obtained in the recirculation zone presented a flattened shape. It seems that the distribution of turbulent fluctuations in such direction suffered a significant decrease due to the grooves presence when compared to experimental data. This confirms the idea about the existence of a strong alignment effect induced by the lateral walls of the grooves, which is also reflected in a damping of the turbulent intensities along the entire trail wake.
Regarding the dimensionless Reynolds stresses, which were obtained in the vertical line at x/D = 1, located in the midplane z/D = 1, as shown in Figure 12, the numerical response of Case A showed, again, a good agreement with respect to the experimental values. Also, from the peculiar shape of the curve obtained for Case B, the alternation between positive and negative values, between the Reynolds stresses, could be related to the elongation of the recirculation bubble, which already has been mentioned. Apparently, the same vertical line located at x/D = 1 was immersed in a different region of the recirculation bubble, where the flow suffered attenuations of the turbulent stresses, this being an indicator that not only the mean kinetic energy was decreased in the recirculation bubble, but also the flow turbulent energy suffered an important decrease.

Mean time nondimensional Reynolds stresses, obtained in the vertical line x/D = 1.
Figure 13 shows a comparison of the scaled local skin friction coefficients, obtained in the upper half of the central periphery of the smooth cylinder, with respect to the values obtained from the valley and peak of the central groove. From the figure, it can be seen that the first transitional bubbles for Case A started to form at θ ≈ 80°, which is close to θ ≈ 72.5 ± 2.5° reported by Kim and Mohan [20], and θ ≈ 77° of the Cantwell and Coles experiment.

Local scaled skin friction coefficient obtained from the upper half of the central peripheral line for Case A, and the peak and valley of the central U-groove.
Regarding Case B, the values obtained in the valley and tip indicated a reduction of the frictional forces magnitudes, this decrease being more accentuated in the valley. Furthermore, the separation angle was different for the two curves extracted from the groove, being that while the flow is separated by approximately θ = 65° on the groove valley, in the tip, a different phenomenon occurred, since the flow was separated at θ = 93° while, at approximately θ = 110°, it suffered a new reattachment. Such flow reattachment that occurred at the tip of the groove appears to be indicative of the presence of a recirculation bubble near the first separation point, which is a characteristic phenomenon of the critical flow regime. Apparently, between the valleys and the peaks of the grooves, there is a distinctive interaction between the transitional mechanisms, proper to the subcritical and critical flow regimes.
This peculiar behavior suggests that while the reducing effect can be obtained either with anisotropic roughness walls or with walls with three-dimensional roughness (knurling [5], sand paper [6]), the transitional mechanism seems to be different. Besides, the peculiar way in which the separation occurred in different angular positions, for the valley and the tip of the grooved cylinder, is conjectured to be a particular characteristic of certain cross sections (U, V or in form of a microchannel, etc.), which plays a key role in the performance of the grooves as flow control devices, considering the fact that these initial perturbations, that are formed in the cylinder near-wall regions, are subsequently transported along the wake and will define its behavior.
Figure 14 shows the time history of the drag “C d ” and lift “C l ” coefficients of the two studied cases, in terms of the characteristic time T = tU∞/D. From the C l signals for Cases A and B, respectively, the presence of the grooves caused a decrease in the magnitude of the lift forces formed in the periphery of the cylinder. While the oscillations of the lift coefficient for Case A reached maximum and minimum values in the range −1<C l <1, for the case of the U-grooved cylinder, the values oscillated in the range −0.55<C l <0.55. Similarly, the history of the coefficient of drag experienced a significant decrease in both magnitude and amplitude. While for the case of the smooth cylinder, this parameter ranged from 0.9<C d <1.4, for the case of the U-grooved cylinder, the oscillation was maintained between 0.9<C d <1.1.
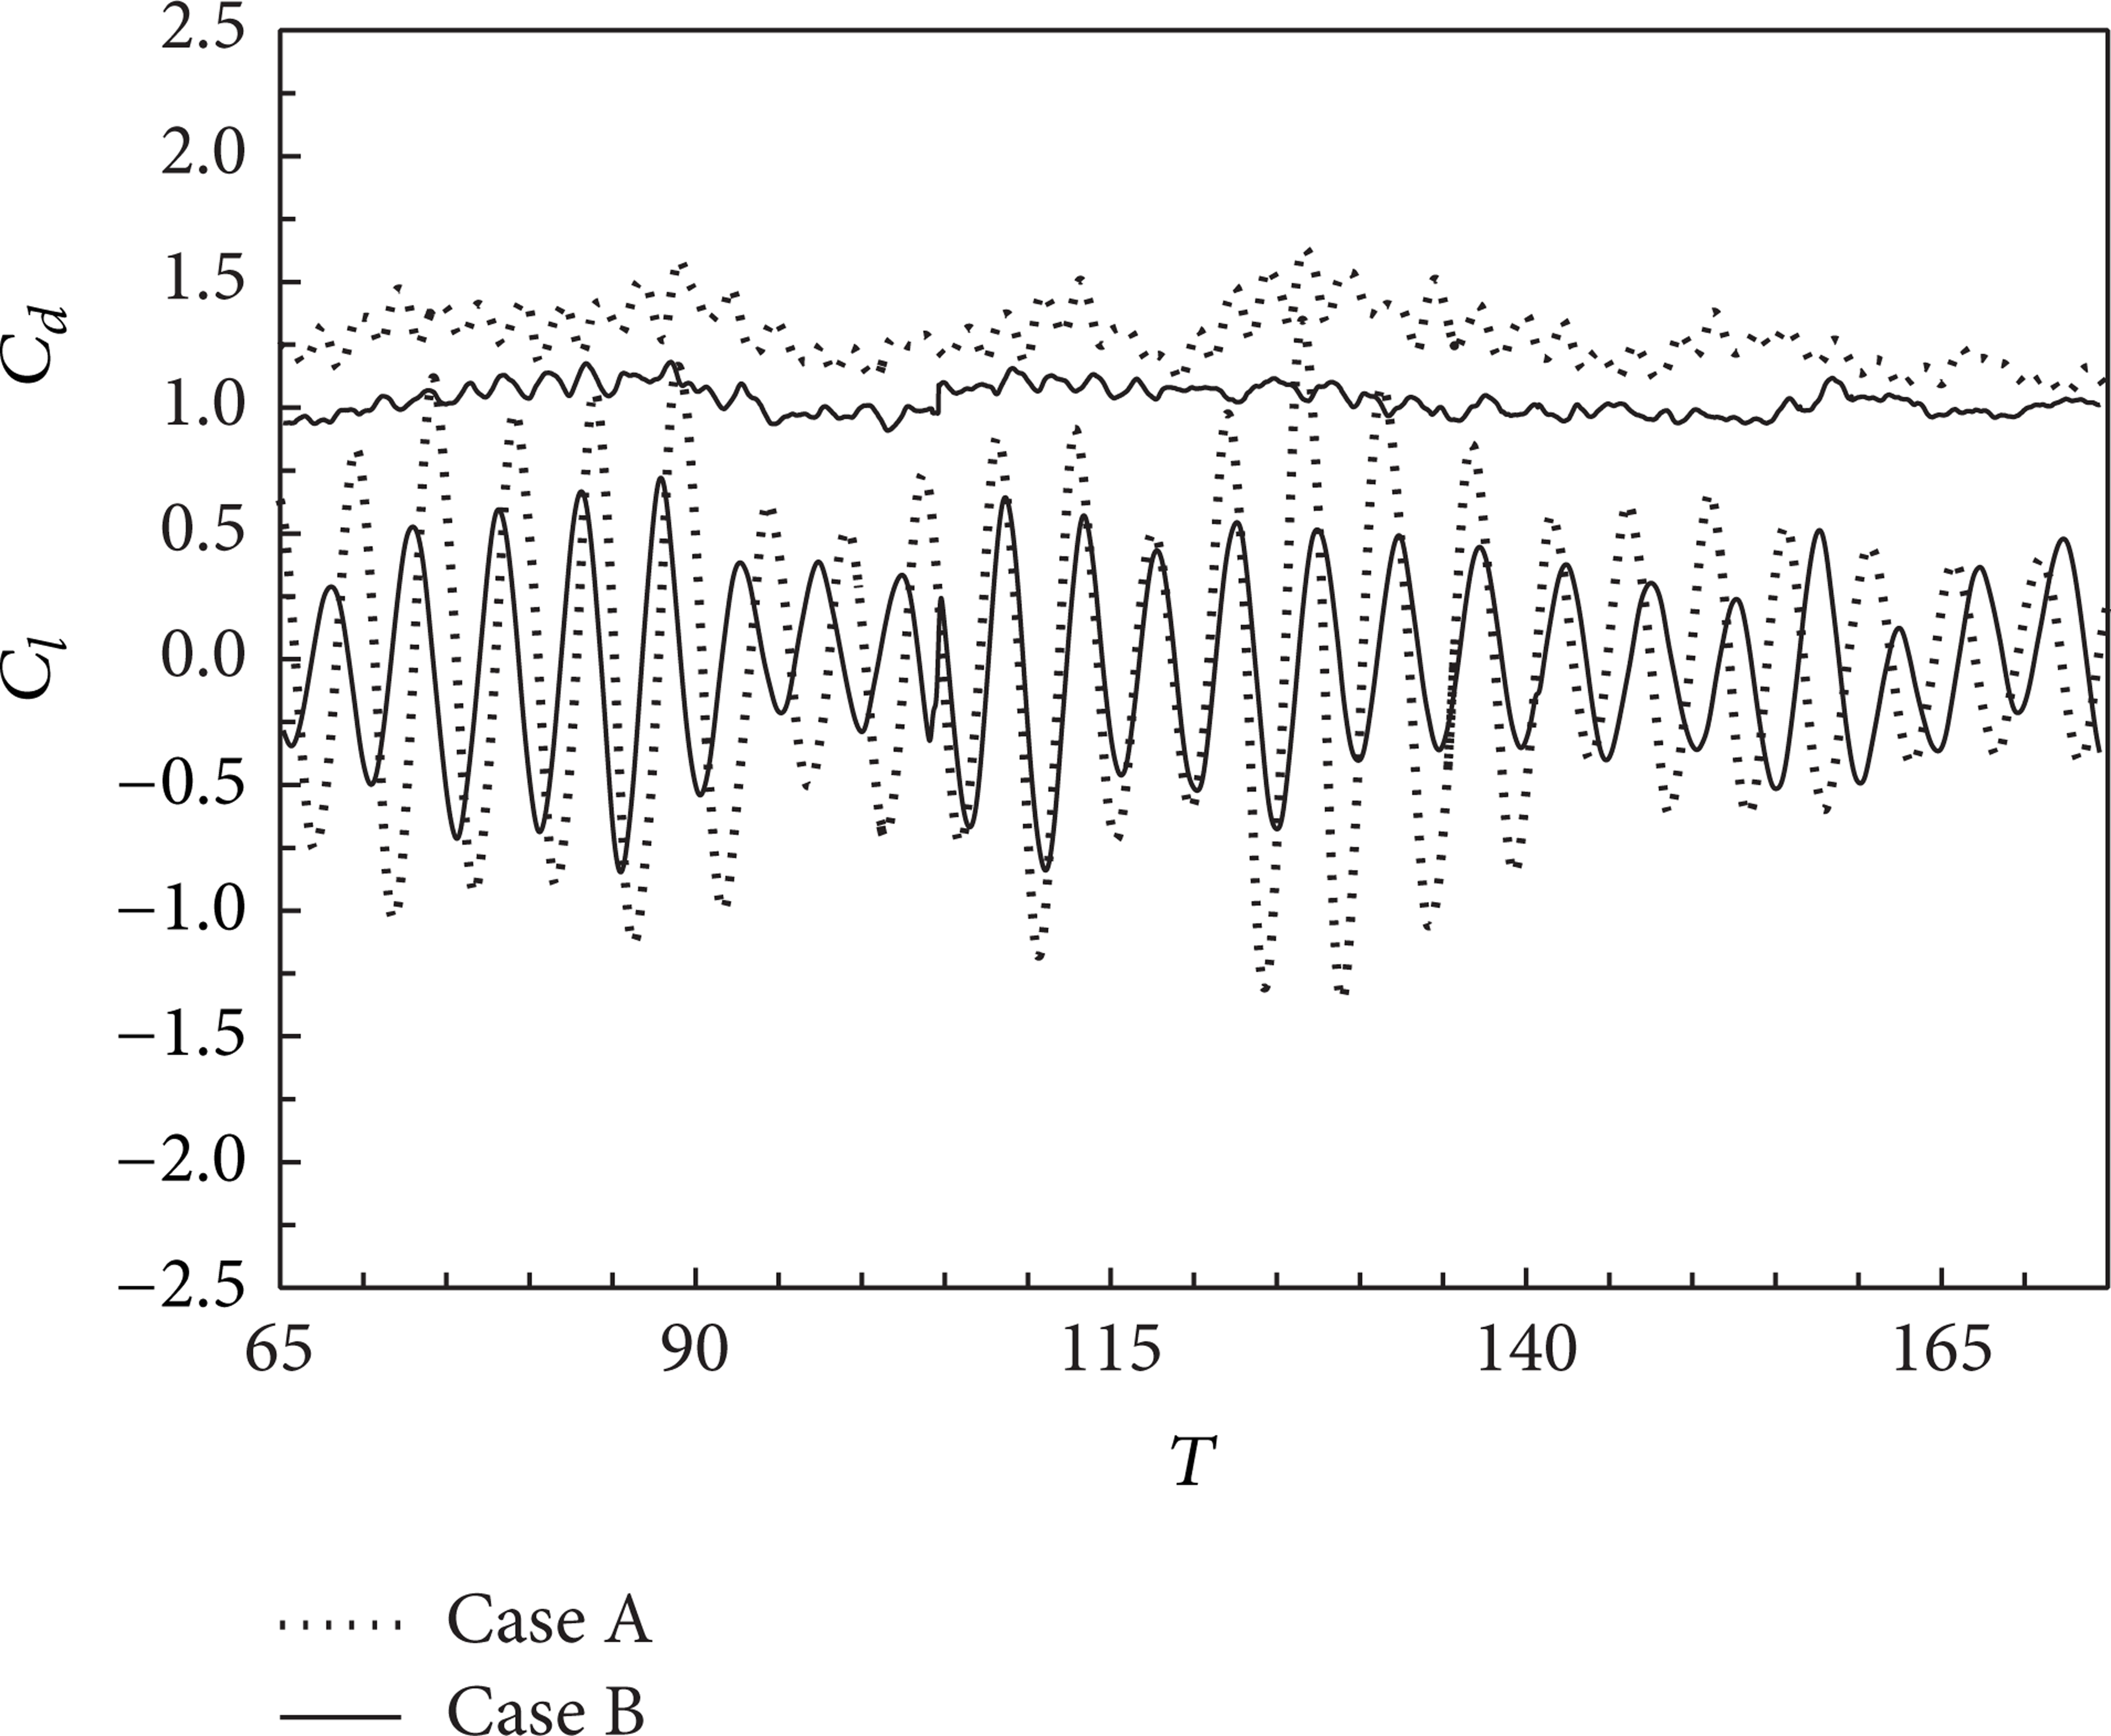
Temporal history of “C d ” and “C l ”, versus the characteristic time T for the smooth cylinder flow and the U-grooved cylinder flow.
Regarding parameters such as the time-averaged
Drag, lift, and static base pressure coefficients obtained for Cases A and B, versus other experiments and numerical simulations.

Figure 15 shows the nondimensional static pressure coefficient C
p
distribution along the cylinder periphery resulting from a temporal and spatial average performed in the peaks and valleys of the five central grooves for Case B, versus the smooth cylinder case. The curve obtained for Case A presented an overall good agreement with the experimental data of Cantwell and Coles, and LES results of Kim and Mohan. The separation angle deduced by the inflection point of the pressure coefficient curve for Case A was θ = 82°, which resulted to be similar to the value obtained in the curve of the scaled skin friction coefficient for the flow over a smooth cylinder, presented in Figure 13. In relation to the values obtained for the rough cylinder flow, the curves obtained for both the valleys and the tips presented an important pressure recovery in the rear of the cylinder (

The power spectral density of the lift coefficient plotted as a function of the Strouhal is shown in Figure 16. The maximums of the PSD signals for both cases were presented at approximately at St = 0.2. Apparently, the grooves did not affect the main oscillation frequency of the primary vortical structures. This appears to be contradictory to the increase reported for Lim and Lee in [10] from St = 0.185 to St = 0.22 due to the U-grooves presence. Considering such differences, and the fact that authors as Achenbach and Heinecke [5] and Ko et al. [8] have in turn informed an increase of the Strouhal number when there is a transition between subcritical and critical regimes of flow, it could be mentioned that the LES model, although presenting approximate values to those obtained experimentally, was not able to capture the apparent increasing effect of the St induced by the grooves presence.

Power spectral density of the lift coefficient C l for the smooth and U-grooved cylinders.
As an attempt to capture the events and structures of the vortical structures in near-wall zones, Figure 17 shows the contour map of the x-vorticity defined by (ω x h/U∞) and the (v,w) velocity vectors of the 6 central grooves positioned in z-y plane normal to the flow direction, located in x = 0, for the nondimensional times T = 158.1, T = 158.7, T = 159.3, T = 159.9, T = 160.6, and T = 161.1. In the figures, the formation of flow packages of medium sizes that interact with those formed in the middle parts of the valleys could be observed, rotating in different directions. As these packets move outwards, they leave valleys and collide with each other, near the groove peaks, forming large elongated flow structures, which subsequently suffer attenuations, in what would seem to be an intermittent cyclic phenomenon.

Maps of x-vorticity (ω x D/U∞) and (v,w) velocity vectors at 6 consecutive nondimensional times.
Although, for this plane, the flow impinges normally on the grooves, similar to the flow over a flat plate with riblets, it would be expected that the flow structures formed within the cylinder grooves resemble the flow structures reported in the drag reduction phenomenon over a flat plate with riblets (i.e., vortical structures located in the groove peaks and which rotate in opposite directions, as reported by the DNS of Choi et al. [25]); however, at least for these Reynolds number conditions and geometrical dimensions, this was not the case. Apparently, the drag reduction mechanism in a U-grooved cylinder is more related to a delay in the separation point, and an early transition to the critical flow regime, than to a repositioning of the vortical structures in near-wall regions.
Regarding the flow structures, Figures 18 and 19 present the results of the λ2 criteria of Jeong and Hussain [26] colored with the velocity magnitude, for Cases A and B, respectively. For the flow over a smooth cylinder, the image depicts the laminar flow formed in the cylinder front part, which is separated in subsequent positions, giving rise to a strong recirculation zone in the rear, and the formation of the unsteady turbulent wake, characteristic of the subcritical flow regime. In relation to the flow structures present in the U-grooved cylinder flow, Figure 19 shows how the laminar region formed in the cylinder front part is extended and the flow is aligned due to the grooves lateral walls being posteriorly separated in different positions along the periphery, forming a “v” form separation point pattern which is absent in case A. As these flow packages are transported and interact with the recirculated flow of the rear part of the cylinder, a wake composed of smaller secondary vortices is formed. Such behavior seems to be consistent with that reported in the flow visualization performed by Lim and Lee [10] for the flow over a U-grooved cylinder, at the subcritical regime.

Flow structures obtained from the λ2 criteria, colored with the velocity magnitude for Case A.

Flow structures obtained from the λ2 criteria, colored with the velocity for the U-grooved cylinder flow.
Finally, as a general summary of what is described in the previous sections, Figure 20 shows the main differences found between the flow over a grooved cylinder and the flow over the smooth one. Initially, there is an increase of the laminar region present in the front part of the grooved cylinder that delays the flow separation causing hence an elongation of the recirculation region, in what is thought of as a characteristic conferred by the lateral walls and concave valleys of this kind of grooves. Also, its results interestingly point out the distinctive “v” separation point pattern formed on the surface of the grooved cylinder, which is not present in the smooth cylinder. This is believed to be caused by the early flow separation in the valleys, and the retarded separation in the crests present in this kind of grooves. These transitional flow packages, when totally separated, interact with the recirculated flow near the rear part of the cylinder and cause a decrease of the mean kinetic energy and turbulence intensities of the wake, in what would seem a distinctive transitional mechanism. Finally, from the temporal flow evolution shown in Figure 18, it could be said that the drag reduction seems to be more related to a static base pressure recovery of the cylinder rear part, than to a blowing effect and a redistribution of the flow structures near the grooves.

Distinctive characteristics of the Case B flow.
4. Conclusions
In this paper, a comparative numerical study of the subcritical flow over a smooth circular cylinder and a U-grooved circular cylinder at Re = 140,000 is presented. The grids were composed of hexahedral elements, disposed in a structured way, their sizes being of 2.58 and 20.7 million cells for the smooth cylinder flow and for the U-grooved cylinder flow, respectively. The implemented technique was the large eddy simulation, in order to solve the Navier-Stokes equations in their unsteady and incompressible forms, as an attempt to reproduce numerically the drag reduction by grooves, in a boundary layer affected by an adverse pressure gradient.
For the smooth cylinder flow, the numerical code was able to reproduce the main features of the subcritical regime, such as the formation of a boundary layer composed of a laminar zone at the front of the cylinder, a recirculation zone in the rear, and a turbulent wake. In turn, flow parameters as velocity components measured at different positions, oscillation frequencies, recirculation lengths, static pressure distribution in the periphery of the cylinder, and drag and lift coefficients were properly predicted.
Regarding the U-grooved cylinder flow, parameters such as the drag coefficient, lengths of recirculation, the transition from subcritical to critical flow, and the formation of a wake formed by secondary vortices smaller sizes were predicted satisfactorily by the LES technique. Apparently, the U-grooves cause an elongation in the recirculation bubble, a decrease of turbulence intensities in the “x” and “y” directions in the entire trail wake, and a pressure recovery in the cylinder rear, which is reflected in the movement of the separation points downstream the cylinder, causing hence the drag reduction. Further, from the manner in which the flow separates at different angles for both valley and peaks, forming “v” patterns is conjectured a distinctive transitional mechanism, different to that conferred by tridimensional roughness. The evolutions of the flow structures formed on the grooves seem to indicate a drag reduction mechanism more related to a shifting downstream of the separation point, and an early transition to the critical regime, than to a repositioning effect of the vortical structures in certain regions of the wall, typical of the drag reduction by riblets in flat plates.
Footnotes
Nomenclature
Conflict of Interests
The authors declare that there is no conflict of interests regarding the publication of this paper.