
Abstract
For understanding the mechanism of frog swimming under water and designing a frog-inspired swimming robot, kinematics of the frog body and trajectories of joints should be obtained. In this paper, an aquatic frog, Xenopus laevis, was chosen for analysis of swimming motions which were recorded by a high speed camera, and kinematic data were processed in a swimming data extraction platform. According to the shape features of the frog, we propose a method that the frog eyes are set as the natural data extraction markers for body motion, and kinematic data of joint trajectories are calculated by the contour points on the limbs. For the data processing, a pinhole camera model was built to transform the pixel coordinate system to world coordinate system, and the errors caused by the water refraction were analyzed and corrected. Finally, from the developed data extraction platform, the kinematic data for the analysis of swimming mechanism and design of frog-inspired robot were obtained.
1. Introduction
For adapting to the water environment and missions under water, bionic propulsion technology has been paid close attention in recent years. Analyses on different underwater propulsion technologies are of great importance and practical value for improvement of underwater propulsion and development of underwater robots [1]. A better understanding of underwater propulsion mechanism leads to a high performance robot design, so the kinematic data collection of bionic subjects is a basic task. Data extraction methods vary according to different experimental subjects. In [2], top view information was collected from a high speed camera to analyze the S-start movement of Danio rerio. Therefore, only 2-dimensional data were extracted for analysis. In [3], the high speed camera obtained the joint information of cockroach from two different views by using a mirror. In [4], six uniform distribution cameras were utilized to capture the marker motions on gait appliance for human lower limbs, and the method is complicated in comparison to other 3-dimensional data extraction methods. Presently, there are mainly two data extraction methods for frogs. One is focused on the 2-dimensional data extraction. In [5], only a lateral view of frog was needed to obtain the data for frog movement. In [6], the frog motion was treated as a planar one, so information in only top view was needed and the kinematic data of the frog swimming process could be easily obtained after correction. The other one is 3-dimensional data extraction. In [7], the joint angles were directly measured from the side and top views, so this method is not efficient when a lot of frames need to be processed. In [8], on the research of frog jumping mechanism, the projected coordinates of the joint markers in the images were determined by the reference object, so the 3-dimensional coordinates were obtained. The 3-dimensional coordinates can also be calculated by the coordinate information from two different figures of the same marker through stereo imaging [9].
Frog has strong limbs and flat and subacute body, which aid in drag reduction and powerful propulsion during swimming. The length of hind legs accounts for a large proportion of the whole body length, and limbs develop imbalance that hind legs are stronger than forelegs which can be neglected during propulsion. The webbed feet increase the propulsion areas for feet to swim fast. Frog is a famous amphibious creature which can jump and swim excellently by the same propulsion mechanism of hind legs, so it is meaningful to study the motion mechanism to realize locomotion ability in unstructured fields. In frog swimming, joints rotate in a large range, and because of the multilimbs movement, the key markers in limbs or joints may perform a repeated route. Frog swimming is a unique motion mode in comparison to traditional underwater propulsion modes and is less understood. Therefore, to improve the current situation and as the data extraction software attached with the high speed camera is not able to get all kinematic information (the attached software only offers the absolute distance between markers), in the paper, the data extraction platform was built to collect and process marker data automatically and directly from the original data in the pixel coordinate system. The swimming kinematic data were extracted according to the key markers. And the pinhole camera model and refraction process were established to correct marker data. The processed experimental data were obtained for the frog swimming mechanism analysis and further development of swimming robot.
2. Materials and Methods
The propulsion phases are explosive moments in both jumping and swimming movements of frog with the characters of transient, short propulsion duration, and large scale of joint movement. To obtain the kinematic information such as body velocity and joint trajectories, the whole movements of frog swimming were filmed with a high speed camera. Then the markers data were processed in the data extraction platform to get the reliable kinematic data for mechanism analysis of frog swimming.
2.1. Animal Experiment
Frog filmed in the experiments is an albino breed of the aquatic frog, Xenopus laevis. The frogs were bought from a local market in Harbin. This kind of frog is good at swimming and is an ideal experimental subject. Temperature is an important environmental factor that affects the performance of the frogs [10, 11], so they were kept in an aquarium under indoor temperature conditions to make them perform stably. The high speed camera is the type of MS50K5.4B from MEGA SPEED Corp and was set at 400 frame s−1 during experiments.
The experimental arrangement is shown in Figure 1. The camera is in front of the aquarium to obtain the lateral view of frog, and a mirror is set 45 degree in the aquarium to get the top view.

Schematic diagram of experimental arrangement.
The frog was put in the aquarium of 500 mm × 335 mm × 400 mm; water depth was 60 mm. According to the experimental arrangement, the mirror was 45 degree from the bottom of the aquarium, and the camera was 1110 mm in front of the aquarium. Two 60 W LED light sources were used in experiments.
Five frogs marked from 1 to 5 were measured and the parameters are listed in Table 1. As previously mentioned, the forelimbs are neglected, so the frog is divided into parts of body, thigh, calf, foot, and the 4th toe (most species have a longest 4th toe [12]), shown in Figure 2.
Kinematic parameters of frogs under study.

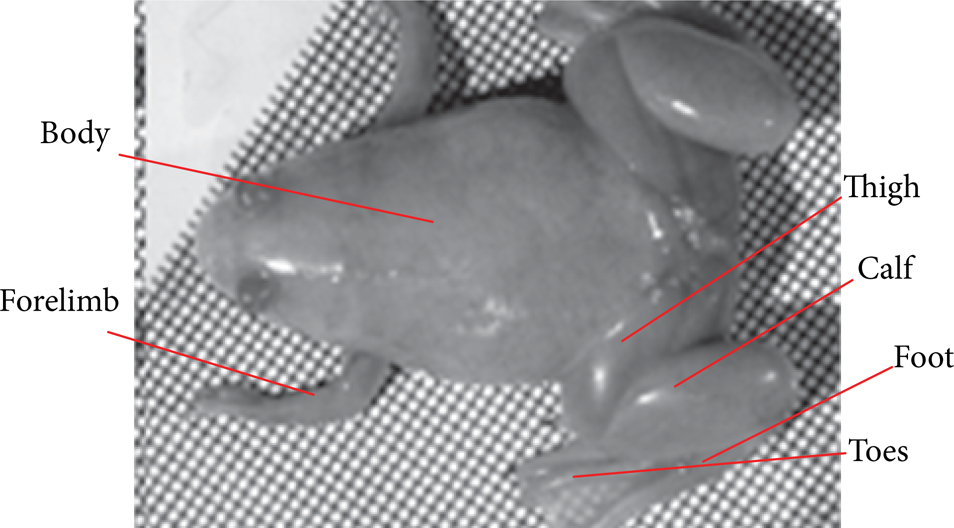
Snapshot of Xenopus laevis.
The swimming process is shown in Figure 3 and the joints almost rotate in a plane though the whole body may change the advance angle.

Frog swimming process.
2.2. Pinhole Camera Model
In this paper, we utilized the pinhole camera model [13, 14] and the correction of refraction error to improve the extraction process.
The pinhole camera model describes the mathematical relationship between the coordinates of a 3-dimensional point and its projection onto the image plane [15]. According to the principle of camera imaging, the pinhole camera model was established in Figure 4, and we could utilize this model to build the relation between points in 3-dimensional space and in the image plane. In Figure 4, the point p in image plane was to be transferred to the 3-dimensional space via the pinhole camera model which involves four coordinate systems [16], the pixel coordinate system (PCS), the image coordinate system (ICS), the camera coordinate system (CCS), and the world coordinate system (WCS). In ICS, the origin O P was defined as the intersection of the image plane and the optical axis of the camera. The origin O P was generally located at the center of the image if the production errors of camera are not taken into consideration.
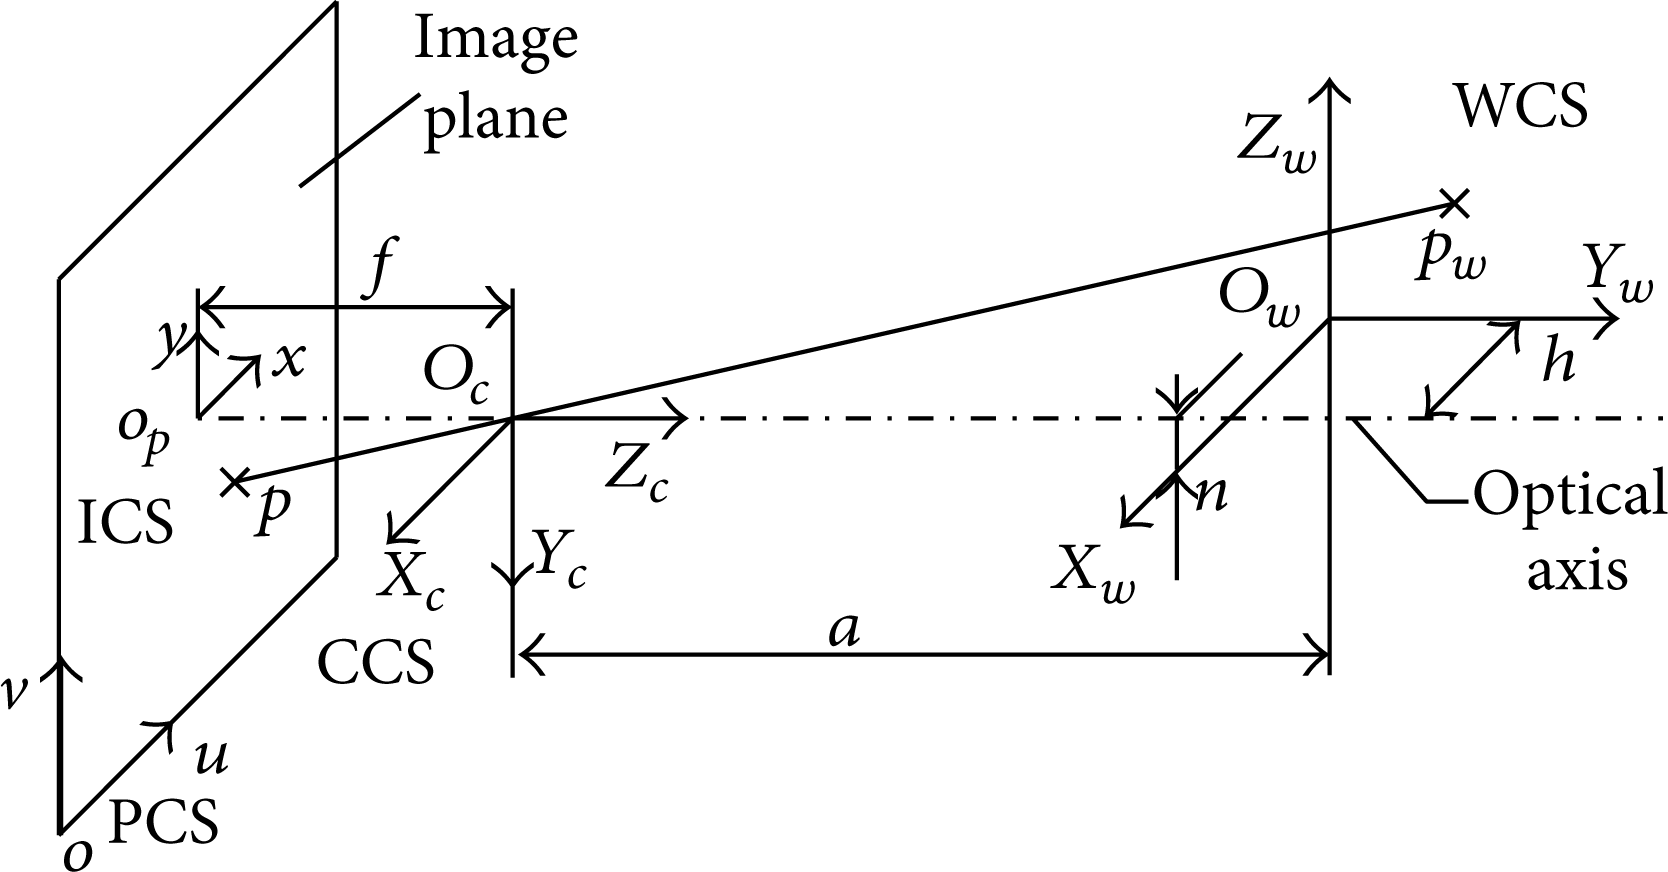
Pinhole camera model.
All images captured during the experiment were stored in computer and presented in PCS. The image process needs data transformation from PCS in which data were obtained directly to WCS in which we analyze frog swimming mechanism. Then transformations between the four coordinate systems will be established as follows.
Step I: Transformation between PCS and ICS. As shown in Figure 5, we define the origin coordinates of ICS as (u0,v0) in PCS, so the relationship between coordinates of one point in PCS (u,v) and ICS (x,y) are listed as follows:

where Δx and Δy are the pixel width of CMOS in x and y directions, respectively. Equation (1) can be expressed as follows by using homogeneous coordinates:

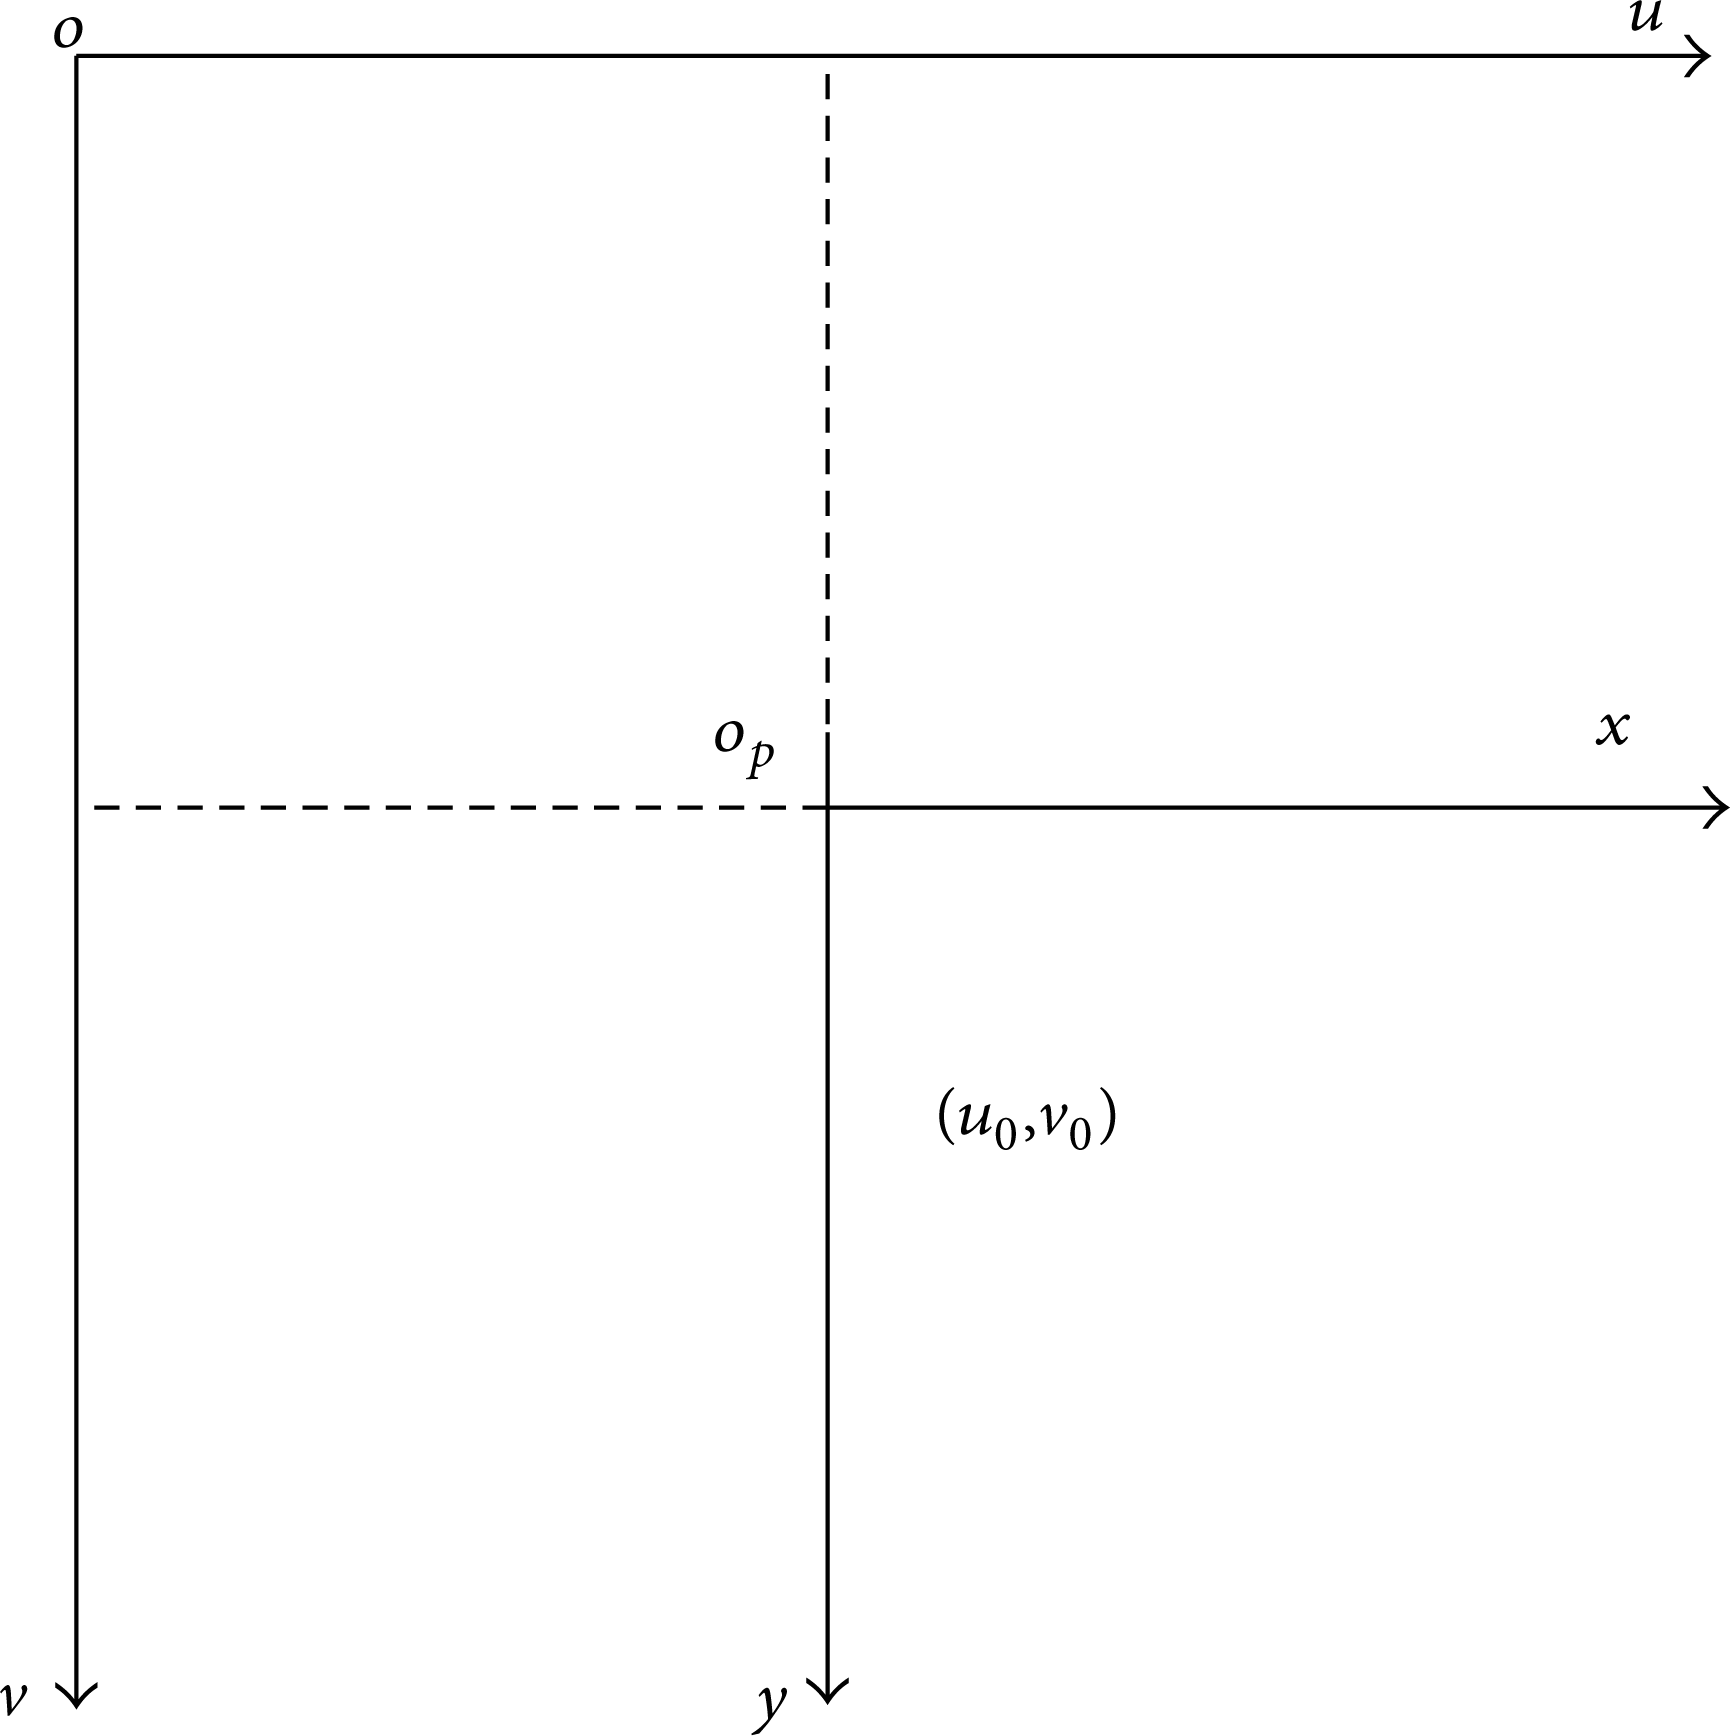
The relation between PCS and ICS.
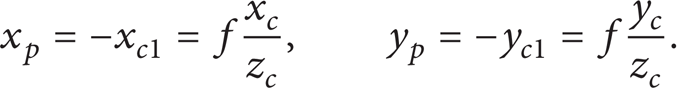
Step II: Transformation between ICS and CCS. As shown in Figure 6, we set the origin of CCS (X C ,Y C ,Z C ) at the center of the camera's lens. The X C -axis and Y C -axis of CCS are parallel and in the opposite directions with the x-axis and y-axis of ICS, respectively. So the Z C -axis could be obtained by the right-hand rule. Now, we can find point p(x p ,y p ,z p ) in ICS which responded to the point p c (x c ,y c ,z c ) in CCS. According to the proportional relationship, the coordinates of p(xc1,yc1,zc1) in CCS are presented as follows:
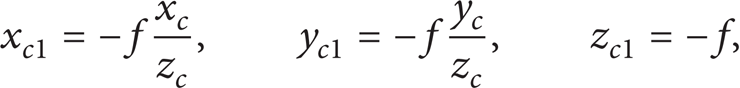
where f is the focal length of the camera.
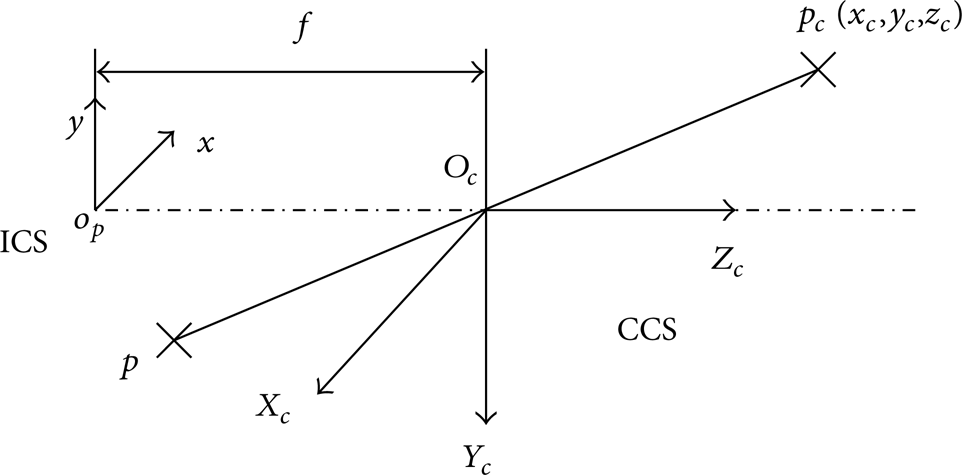
The relation between ICS and CCS.
As shown in Figure 6, the coordinates of point p in CCS and in ICS represent the same point, so according to the corresponding relation between CCS and ICS, the equations can be obtained as follows:
The mapping of object from the 3-dimensional space to the image plane is the transformation from multipoint to one point [6]. The depth information is lost in the process of imaging [17]; that is why the coordinate information of the point in WCS cannot be completely determined only by one corresponding point in image plane. However, we can still get the coordinate information of each limb marker of the frog in WCS via two views information. The points in the virtual top view and the real lateral view of the frog can be simultaneously obtained, as shown in Figure 7. So the coordinates of two points in PCS, which is determined by the same marker of the frog, can be obtained from the images.

Image captured by high speed camera.
As shown in Figure 8, point B is assumed as the one marker of the frog in the water, and point A is its image in the mirror. The coordinates of point A and point B in CCS are (x Ac ,y Ac ,z Ac ) and (x B ,y Bc ,z Bc ), respectively. So the slope of the line determined by point A and point B is −1, which is displayed as follows:


The lateral view of the system.
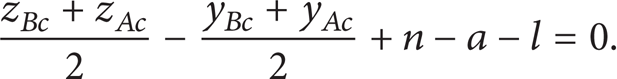
From Figure 8, we can also find that the midpoint C between point A and point B must be in the plane identified by the mirror. The equation of the plane in CCS is denoted as

The coordinates of the point C in CCS are ((x Bc + x Ac )/2, (y Bc + y Ac )/2, (z Bc + z Ac )/2). Substituting the coordinates of point C into (6), the following equation can be obtained:
Set up the mappings’ coordinates of point A and point B in ICS as (x1,y1) and (x2,y2), respectively; the following equations could be obtained through (4):

From the above equations, the coordinates of the markers A and B in CCS can be obtained through (5), (7), and (8), as follows:
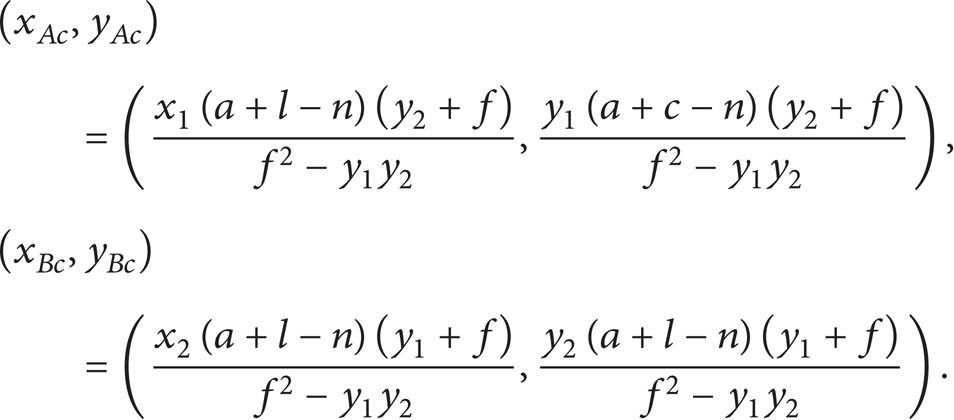
Marker A is from the top view, presenting information along Xc and Zc axes and marker B is from the lateral view, indicating the Xc and Yc value of the point on frog. Therefore, the coordinates of point p c (x c ,y c ,z c ) in CCS can be written as

Step III: Transformation between CCS and WCS. The WCS is built to describe the position of objects in the real environment (including the position of the camera). As shown in Figure 4, the origin of WCS (X w ,Y w ,Z w ) is placed at the foot of the aquarium, and the directions of the axes are chosen to make the coordinates of each marker of the frog positive. All these settings are benefit to the data after processing.
To establish the transformation between CCS and WCS, two matrices, R and T, are introduced. These two matrices are used to indicate the rotation and translation between two coordinate systems. The homogeneous coordinates of point pw in CCS and WCS are

where,
Through all these steps above, the marker data of the frog in the swimming process can be obtained. However, the above mentioned process is analyzed without consideration of light refraction in different medium. Therefore, apart from making the transformation between different coordinate systems, the refraction error produced by different media should be corrected.
2.3. Correction for Refraction Error
During the experiment, we detect that the overall size of the frog in the water is slightly larger than that obtained in the specular reflection. To explain this phenomenon better, a larger size reference is observed just as shown in Figure 9. It is produced not only by the reflection which can be analyzed by the pinhole camera model but also by the refraction caused by different media. The pinhole camera model has been elaborated in this paper, so the error produced by different refraction media will be discussed.

Size error occurred from different views.
According to the light propagation, inverse deduction is carried out to analyze the phenomenon mentioned above. As shown in Figures 10 and 11, firstly, the assumption is made that θ1 = θ2, so the angles of refraction must satisfy the equation α1 = α2, since the light spread through the same media such as the air or glass. Secondly, according to the law of refraction that determine the relation between refraction angle and incidence angle when the light spread cross different media, γ1>γ2 can be deducted because of the same angles of incidence but different media (air in Figure 10, water in Figure 11), and then we can conclude that d1>d2; finally, a confliction occurred that the real reference size should be unchanged; that is, d1 = d2, so the first made assumption should be corrected as θ1<θ2 and therefore g1<g2, and the expression of the point should be x1<x2, according to the law of similar triangles. Thus, these results will be consistent with the experimental consequences. To get a more intuitive result, Figures 10 and 11 are superimposed in one Figure, just as shown in Figure 12, where the effect caused by the different refraction media is more obvious.

Optical path 1.

Optical path 2.

Superimposed optical path 1.
Next, the images of reference which are obtained through the water and specular reflection will be analyzed, respectively. And only the data in x-axis direction in ICS will be analyzed; the data in y-axis direction can be obtained in the same way.
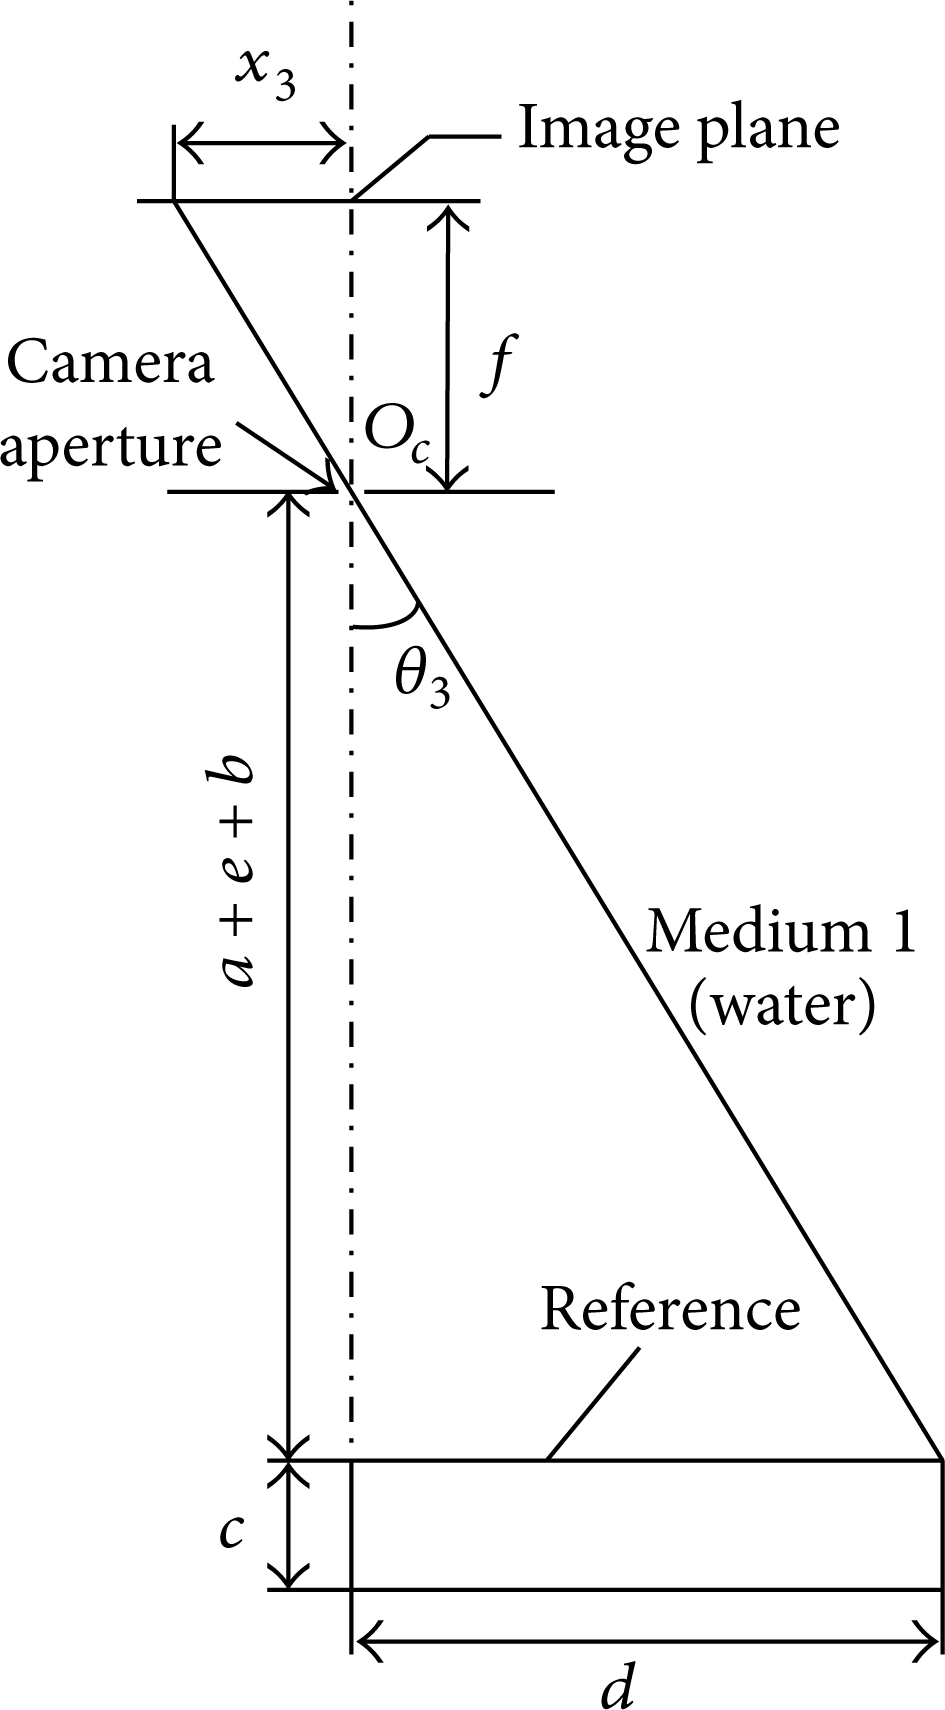
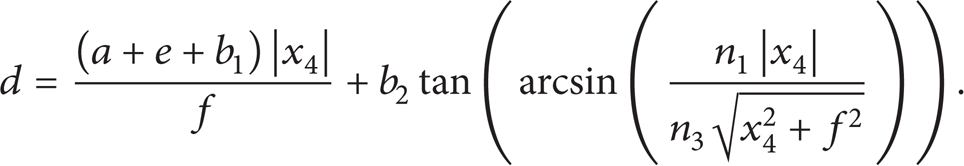
2.3.1. Image Analysis under Water
As shown in Figure 11, the total length of the reference is composed of three segments in d2 direction:

where
Considering that a + b ≫ e, γ2>α2 and θ2>α2, it can be expressed as
According to the law of refraction,

where n1, n2, n3 are the refractive indexes of medium 1 (air), medium 2 (glass), and medium 3 (water), respectively.
Further simplification can be obtained as follows:

Because of

According to the geometric relationship in Figure 13,

No refraction effect.
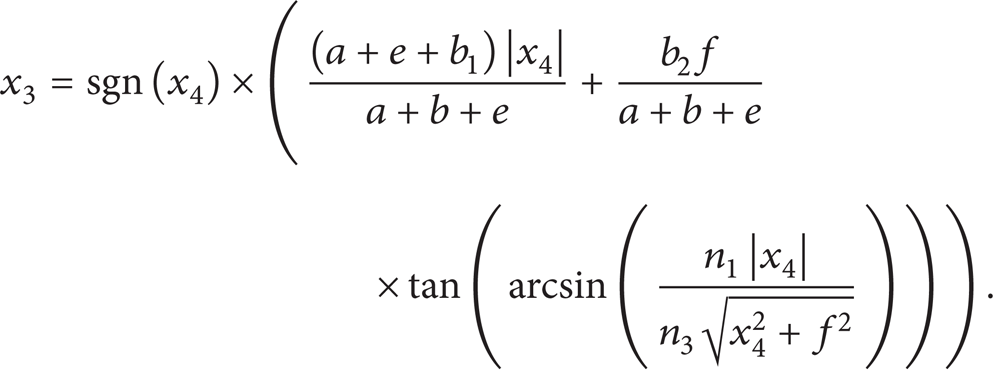
By combining (15) and (16), we get

Although the introduction of refraction error makes the size of coordinate value different in ICS, it does not change the sign of coordinate value. So the sign of x3 is same with x2, and the specific expression of x3 is expressed as follows:

2.3.2. Image Analysis from Mirror
From the above analysis, the effect caused by the refraction of the aquarium glass is so small that this effect will not be taken into consideration when analyzing images obtained through the specular reflection. The simplification of optical path is shown in Figure 14. The total length of the reference is composed of two segments of optical path in d4 direction:

where

Simplification of optical path.
According to the law of refraction,

Further simplification can be obtained as follows:

Because of
According to the geometric relationship in Figure 13,

By combining (22) and (23), we get

Considering the same situation with (18), the specific expression of x3 is as follows:
The superimposed optical paths through the specular reflection in both cases are shown in Figure 15.

Superimposed optical path 2.
According to the (18) and (25), the coordinates of the same point from different views in ICS can be obtained through the data collected from images such as x2 and x4. So far, the correction of the refraction error caused by different media was analyzed.
In this paper, the method of obtaining the 3-dimensional coordinates of points in the images which are captured from the high speed camera consists of the following three steps.
Transform the point coordinates from PCS to ICS.
Correct the refraction error caused by different media in ICS.
Transform the coordinates which are corrected from ICS to WCS to obtain the 3-dimensional information of each marker during the swimming process of the frog.
2.4. Processing of Kinematic Data
The data extraction for forelimbs is neglected as previously mentioned, so kinematic process for the other parts is conducted. In order to achieve the whole kinematic information of frog swimming, the swimming position and locomotion of the body and trajectories in joints are needed. Unlike some kinds of frogs, Xenopus laevis has a pure color body without black pot or other markers in skin. For making markers represent body and joints, the eyes are chosen to serve as the natural markers for body locomotion and position. But it is difficult to set a reliable and remarkable marker in joints, so some researchers made artificial markers in joints by attaching or embedding color spots in skin [18]. Since a common marking technique could affect the behavior of the animals [19], a method using contour points on the limbs is proposed to calculate joint trajectories in this paper. The results will be more reliable as the contour points are easier to mark and there are more points for markers on limbs. Therefore, kinematic calculation in this paper is based on markers on eyes and markers of contour points on limbs. The joint trajectories can be obtained from the limb slopes which is determined by the morphology of the frog and can be calculated both by coordinates in ICS and in WCS, so joint kinematic calculation does not need the transformation from ICS to WCS.
The edge detection method was utilized in this paper to define the frog contour (Figure 16). The method used Canny edge detector [20] to extract boundary line between the object and the background in the image. Canny edge detector which has good edge detection performance achieves the contour by looking for local maximum of the image gradient which is derived by first derivative of Gaussian function. Double-threshold method was used to detect strong and weak edges, and the weak edges were treated as contour output only if they were connected to the strong edges [21]. Therefore, this method can partially reduce the noise interference and can also keep a good balance between the noise removal and edge detection [22]. The method of Adaptive-neighborhood histogram equalization [23] was used for image enhancement to obtain the contour of the frog's eyes. All these steps can be processed in MATLAB.

Schematic diagram of joint angles.
As previously analyzed, the information about x and y axes in WCS could be obtained from the top view and information about x and z axes from the lateral view. Besides, the limbs and joints could be treated as planar due to their kinematic characters. The joint trajectories can be calculated from the top view when the frog performed a horizontal swimming. The inclined swimming can be calculated with the horizontal projection and then solve the inclined swimming problem from the lateral view. Take the thigh, for instance, we first calculate the limb slope. The number of points to envelope the thigh is preset by the platform, and the number will influence the computational accuracy and calculation quantities. As shown in Figure 16, two lines, a and b, are fitted for each contour line of the thigh, and line c is defined as the average value of slope of a and b. The thigh slope k3 is then defined equal to c.
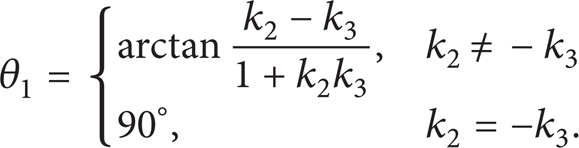
In Figure 17, the eyes of the frog is set as point 1 and point 2, and the slope of the line through the two points is defined as k1. The body position is perpendicular to the line k1, so the slope of body k2 can be calculated. The hip joint angle θ1 defined by the angle between body and thigh is calculated by the expression below:
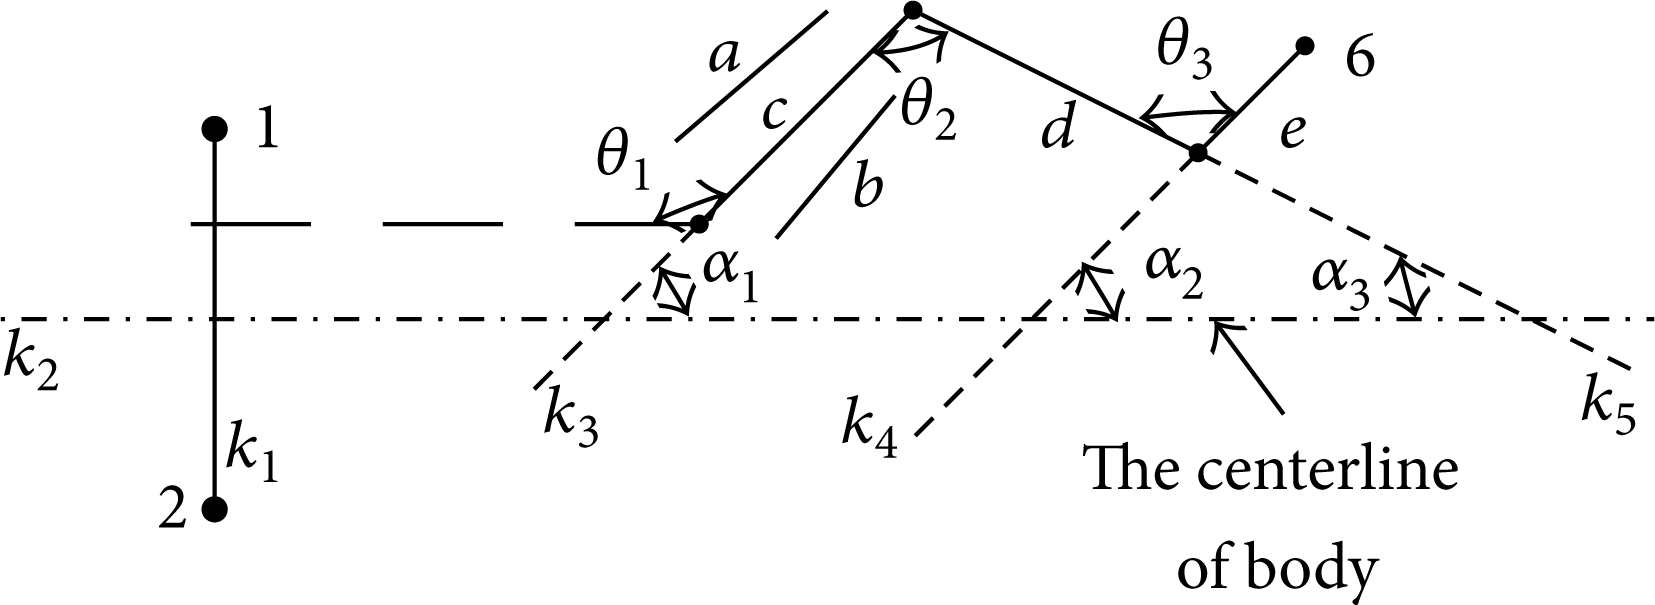
Joint angles definition for calculation.
According to the relation between θ1 and α1, the following equation can be obtained as follows:

The knee and ankle joints defined by the angles between thigh and calf and calf and foot, respectively, are calculated as below:

According to the geometrical relationship in Figure 17, the knee and ankle joint can be expressed as

2.5. Data Extraction Platform
After obtaining the experimental data from video, every marker's coordinates in PCS need to be transformed and corrected using the method mentioned above. A data extraction platform is built up in this paper to calculate the body velocity and joint trajectories, and the relevant parameters in the data processing can be modified. By using this platform, all the work of the data acquisition and processing can be managed effectively. And the specific workflow is shown in Figure 18. This platform consists of three modules including data input, output, and graphic display. As to the original data, the markers’ information of the frog in PCS will be imported to the platform after data storage. Then, by using the camera model and the methods for calculating the body velocity and joint trajectories, uncorrected coordinates of the frog can be obtained. Meanwhile, more accurate coordinates can be obtained after correction of fraction error. The uncorrected and corrected data will be exported for further analysis. At last, the relevant curves can be displayed on the graphical user interface.
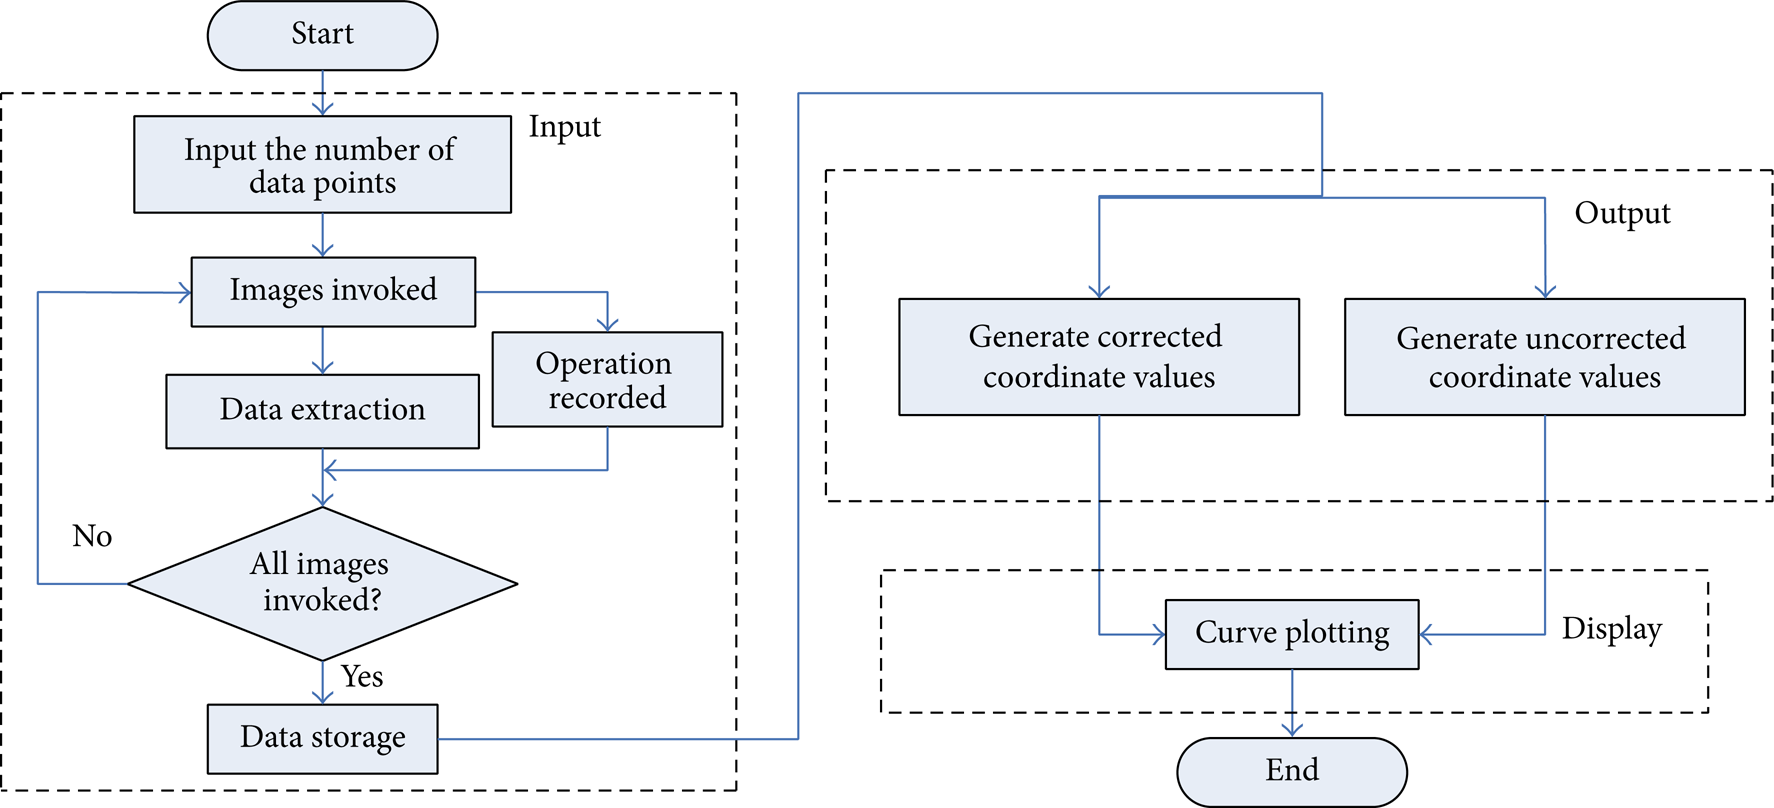
Flow chart of data extraction platform.
As shown in Figure 19, all the calculation works of this platform are conducted in MATLAB, and also the graphical user interface is built up by using GUI from MATLAB. This interface is divided into three parts which is consistent with the structure of the flow chart in Figure 18. In the input module, the number of data points can be adjusted according to the actual situation. After setting all parameters, image will be processed frame by frame to get the coordinates of the data points in PCS. And these coordinates, as the input information, will be used for the further analysis. In output module, the uncorrected and corrected coordinates can be exported after calculating through this platform, and all these data can be used in the display module.

Graphical user interface of data extraction platform.
Using this platform for the experimental data acquisition and processing has two main advantages: the first is easy to operate; this platform can make most of the work done automatically, which will greatly improve the efficiency of the data acquisition and processing; the second is that the number of data points can be adjusted according to the actual situation in processing the experimental data, this step could build the balance between the execution efficiency of the program and the accuracy of the result.
As one case of frog swimming information is shown in Figure 20, the random error cannot be avoided when data collected, especially after gradient, so the curves drawn by using these data have a big gap with the ideal ones. Therefore, the method of curve fitting needs to be used to obtain a smoother trajectory curve. Considering the method of curve fitting is not the point in this paper and many fitting methods have been built up as a toolbox in MATLAB; more specific analysis about the curve fitting will not be discussed in this paper.

Curves for body kinematic data.
3. Results and Discussion
The kinematic information in joints can be directly calculated from marker data in ICS that was extracted from film. That is because the joint angle can be computed directly from the relative position between limbs. The error curves of joint trajectories in WCS are shown in Figure 21. The errors in joint trajectories from one swimming case present a low level than those in body trajectory shown in Figure 24. Therefore, joint kinematic calculation does not need the transformation from ICS to WCS.

Error curves of the joint trajectories.
From the data extraction platform, the motion data of joints, which will be used for frog swimming analysis, can be obtained. As shown in Figures 22 and 23, the curves of frog motion are displayed with the help of the curve fitting tool in MATLAB. Due to the data extraction platform, the work to deal with the kinematic data from observation experiments becomes time saving and efficient. Therefore, the mechanism analysis of frog swimming which is based on the collected kinematic data can be successfully carried out.

kinematic curves of slow swimming motion.

kinematic curves of fast swimming motion.

Error curves of body trajectory.
The body velocity is an important index to value the swimming performance, which is calculated from the data extracted from markers in frog eyes. And Figures 22(b) and 23(b) are the body velocities from both slow and fast swimming. The fast swimming experienced a short propulsive duration, which means that swimming performance may be improved by intense extension of legs. So motion mechanisms can be analyzed based on the data extracted from the built platform.
From Figure 22(a), the ranges of joint trajectories and other kinematic information during the whole frog swimming period are presented. And the propulsion period of a fast swimming motion was also extracted, shown in Figure 23(a). The swimming process is commonly divided into three phases [7]: propulsion phase, gliding phase, and recovery phase. The propulsion phase is the most important phase for frog swimming mechanism analysis. In the paper, the data extracted and corrected can provide reliable materials for further studies. In propulsion phase, ankle joint rotates much faster than the others, indicating that the webbed-feet play an important role in frog swimming. And in gliding phase, joints almost remain constant to reduce the consumption of energy. After recovery phase, frog shows a ready position for the next swimming period.
From Figure 24, the errors are determined by the effect of refraction which is relative to the displacement between the object and the optical axis. In other words, the refraction errors increase with the displacement between the object and the optical axis. So the above mentioned method is necessary to correct the refraction error.
4. Conclusion
In this paper, the swimming trajectory of Xenopus laevis was obtained by the high speed camera. In order to transform the coordinates from PCS to WCS, the pinhole camera model was established. Meanwhile, the errors caused by the water refraction were analyzed and corrected so as to get more accurate coordinate information. Since the frog has a pure color body without markers in skin, the eyes are chosen to serve as the natural markers for body locomotion and position. The contour points on the limbs are collected to calculate joint trajectories, because the outlines of the frog make a fine distinction from the environment. The contour points can be collected easily. Finally the data extraction platform was built to get most of the work done automatically. Using this platform, we can get all the kinematic data which can be used to analyze the swimming mechanism of the frog and to design an inspired frog.
Conflict of Interests
The authors declare that there is no conflict of interests regarding the publication of this paper.
Footnotes
Acknowledgments
The authors thank the support of the following agencies: the National Natural Science Foundation of China (51005052); Harbin Institute of Technology Research; Innovation Fund (HIT.NSRIF.2009016); State Key Laboratory of independent topics (SKLRS201001C), and the Project Supported by Development Program for Outstanding Young Teachers in Harbin Institute of Technology no. HITQNJS.2008.014.