
Abstract
In this work a study of the influence of cutting speed and feed on different geometric deviations (straightness, parallelism, roundness, and circular run-out) of dry turned UNS A97075 (Al-Zn) cylindrical bars has been carried out. The experimental data have revealed a low sensitivity to change of these deviations with cutting speed and feed, within the range of cutting parameters evaluated. In addition, several parametric models have been developed from the experimental results. These models allow predicting the behavior of these deviations as a function of cutting parameters applied. In order to do this, different parametric models (potential, exponential, and polynomial) have been tested. For all analyzed geometric deviations, the exponential model has shown the best fit to the experimental data.
1. Introduction
The aeronautical industry has highly special characteristics that give it a strong strategic interest [1]. Aluminium alloys have been traditionally used in this industry, mainly as structural elements in aircraft, due to their excellent ratio density-mechanical strength [2–4]. Different forming processes are used to manufacture these parts. Among them, machining is commonly used [5].
Nevertheless, in recent decades new materials are being utilized for the manufacture of aircraft parts (carbon fiber reinforced polymer, fiber metal laminate, metal matrix composite, nonmetal matrix composites, titanium alloys, etc.) [6, 7]. These materials have better mechanical properties than the aluminum alloys traditionally used. However, most of them have difficulties in forming, essentially in machining, which are still mostly unsolved [8, 9]. In addition, it should be noted that aeronautical projects for commercial aircraft usually have a minimum lifetime of 20 years. As a result, structural parts of these aircraft are still made of aluminum alloys in a high percentage [10]. In this regard, recent studies are focused on the improvement of the mechanical properties of aluminum alloys by adding new alloying elements or by using new heat treatments [11].
On the other hand, the increase in energy prices in recent years, coupled with the enactment of new laws on safety, health, and environmental protection, calls for the use of sustainable manufacturing technologies [12]. This requires, first, minimizing or eliminating toxic and/or environmentally harmful substances, reducing waste, and increasing its recyclability. Furthermore, it should reduce the number of steps in the manufacturing processes, which normally result in a reduction of the energy consumption and the volume of waste generated (in the case of the manufacturing processes in the aircraft industry). Thus, it aims to improve the energy, economic, and environmental performance of manufacturing processes [13].
Cutting fluids have been traditionally used in machining. However, their high toxicity and negative environmental impact make it necessary to minimize or eliminate their use [14–16]. Furthermore, in the case of machining of aluminum alloys, the difficulty of recycling the waste products (mixture of aluminum chips and cutting fluid) must be taken into consideration [17]. In addition, aluminum alloys are frequently machined in combination with other materials such as CFRP (carbon fiber reinforced polymer), which do not have a good performance under cutting fluids [18, 19]. For all the above, the current trend in the machining of aluminum alloys is performing these processes in the total absence of cutting fluid (dry machining). As a result, the toxicity of the waste is reduced and the recyclability is increased [20, 21].
However, dry machining causes very hard conditions during the cutting process which lead to a limit situation in both the tool and the workpiece, giving rise to significant deviations from the dimensional and geometrical quality requirements. Consequently, the functional performance of the process is decreased [22–24]. This situation makes it necessary to find new combinations of cutting parameters and tools to improve the performance of these processes in all facets (functional, economic, energy, and environmental) [11, 13].
One of the most important requirements applicable to machined parts is related to the surface integrity (SI), due to its effect on functionality, longevity, reliability, and manufacturing cost [25, 26]. Machining causes surface alterations which may include physicochemical and geometric changes [27, 28]. It is well known that these changes, although confined to a small surface layer, strongly influence the service behavior of manufactured parts—as fatigue and stress corrosion—and may limit the component quality or make the surface unacceptable. Consequently, SI concerns not only geometric aspects of surfaces but also metallurgical, chemical, physical, and mechanical characteristics and properties [29].
The physicochemical properties of the machined surface (microhardness, residual stresses, corrosion resistance, etc.) substantially affect the functional performance of single parts, whereas the geometric characteristics assume greater importance in the functional performance of coupled parts [30]. In this last case, high quality geometric requirements are often required, both microscale (surface roughness) and macroscale (shape, size, and orientation) [31, 32].
Most studies focus on the analysis of the behavior of the roughness as a function of the input variables to the process. These microscale deviations are commonly evaluated through arithmetic average roughness, Ra [33]. On the other hand, there is a lack of studies focusing on the analysis of geometric deviations (GD), despite its importance [34]. The parameters used to evaluate GD are diverse, depending on the shape and the functionality of the machined parts (straightness, flatness, roundness, cylindricity, parallelism, perpendicularity, angularity, Symmetry, etc.) [35].
These studies usually obtain parametric models which predict the value of these deviations as a function of the input variables to the process. This is really important in dry machining, because the upper bound of these deviations is normally obtained under these conditions [16, 36]. In agreement with the above, it should be noted that parametric models for the roughness are commonly obtained by most researchers, whereas parametric models for GD are rare [34, 37].
Both analytical and empirical methods are used to analyze the roughness [32, 38]. Most analytical methods take into account only geometric and cinematic aspects of machining. Thus, simple analytical models which allow predicting Ra as a function of cutting parameters and tool geometry are obtained [39–45]. Other analytical studies focus on obtaining algorithms that allow a graphical 2D or 3D simulation of the topography of the machined surface [46–48]. However, analytical studies are complex and require the application of a set of simplifications which usually lead to inaccurate results. Because of this, empirical studies are widely used. These are more expensive and take longer time than analytical studies but lead to more reliable results [49, 50].
Taylor models tend to be the most usual in empirical studies. So, potential models are frequently obtained from experimental data. These models usually predict Ra value as a function of cutting speed (v), feed (f), and cutting depth (a p ), as shown in (1) (where K, x, y, and z are constants), for a given tool and fixed lubrications conditions [51]:

More complex models are usually obtained by adding other input variables, such as tool geometry or the mechanical properties of machining material [52]. Polynomial models, normally obtained by using design of experiments methods, are also frequent [53–58].
Potential models, similar to (1), usually show a good fit for aeronautical aluminum alloys. In this regard, some researchers suggest removing the cutting depth from (1), due to its small influence on Ra, in machining of UNS A92024 (Al-Cu) and UNS A97050 (Al-Zn) alloys [37, 59].
As previously mentioned, research that provides parametric models for GD is limited, despite its high importance in functional behavior of coupled parts. In [34], an exponential model is suggested for some GD, as a function of cutting speed (v) and feed (f), in dry machining of UNS A92024 (Al-Cu) and UNS A97050 (Al-Zn) alloys, as shown in (2) (where C, K ij , and y are constants):

It should be pointed that model from (2) has not been contrasted with other aluminum alloys and its generality should be checked. This lack of models requires further research in this direction, especially in dry machining of aluminum alloys for aeronautical purpose. On one hand, the quality requirements in this industry are very high. On the other hand, dry machining leads to large deviations from the geometric specifications.
Thereby, in this work, a study of the influence of cutting parameters on GD obtained in dry machining of UNS A97075 (Al-Zn) alloys is performed. It should be pointed that no similar studies have been found in the literature for this alloy—despite being long used in the manufacture of structural components for aircraft—and those found for other alloys are limited. In addition, a set of experimental parametric models has been developed for GD. These models allow predicting, with a certain degree of approximation, the value of some GD as a function of cutting parameters applied (v and f). Finally, the experimental results and the models have been compared with those obtained in similar researches of aeronautical aluminum alloys.
2. Experimental
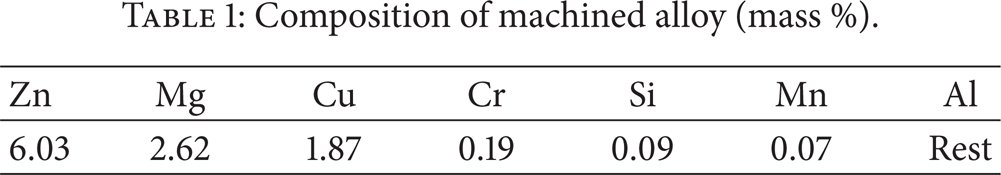
Different machining tests were performed with test pieces of UNS A97075-T6 (Al-Zn) alloy. The mass percentage of the main elements contained in the tested alloy is shown in Table 1.
Composition of machined alloy (mass %).
In the context of aircraft manufacturing, there are coupled parts placed in critical areas which may cause fatigue failure. A large number of these components exhibit a cylindrical shape [60, 61]. Geometrical deviations play a critical role in their assembly and mechanical behavior. In order to analyze some GD of these parts, cylindrical test bars (150 mm long and diameters between 30 and 60 mm) were used.
The machining operation selected was parallel horizontal turning, due to the fact that it is easy to perform, it minimizes the geometric variables of the process, and it allows the cutting speed to remain constant. Turning tests were conducted in a CNC machining center (model Eclipse EMCO); see Figure 1(a). All tests were carried out with a constant axial machining length, L = 150 mm; see Figure 1(b). The tools utilized were TiN covered WC-Co turning inserts with ISO KCMW 11T308FN M identification. Tool geometry is indicated in Figure 1(c). Aiming to ensure the same initial conditions, each test was performed using a new tool.

(a) CNC horizontal lathe. (b) Cylindrical test bars with L = 150 mm. (c) Tool geometry.
In order to assess the influence of the cutting speed (v) and feed (f) on GD, the aforementioned tests were carried out using different combinations of these cutting parameters values (Table 2). These values are commonly used in machining of these alloys for particular aeronautical applications [62]. In this context, it must be pointed that although low cutting speed is not recommended for machining aluminum alloys, these alloys are often used hybridized with other materials in which this low cutting speed is required.
Cutting speed (v) and feed (f) values applied in the turning tests.
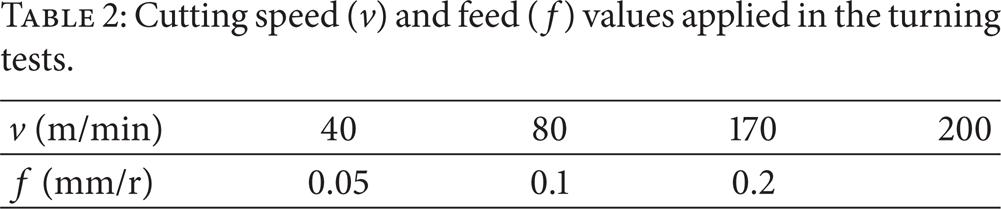
Previous research has shown the limited influence of the cutting depth (ap) on GD obtained when these alloys are machined [34, 37, 51, 59]. Due to this, its value remained constant in tests performed, with value of ap = 1 mm.
Machining tests were carried out using techniques with low environmental impact, in order to maximize the environmental performance. However, this kind of test presents a high aggressiveness for both the workpiece and the tool.
As previously mentioned, a large number of parameters are used to evaluate GD. Cylindricity is one of most important GD to take into account in the functional behavior of cylindrical coupled parts. In addition, this GD can be evaluated through a combination of other GD, such as straightness, parallelism, roundness, and circular run-out. Straightness and parallelism are evaluated longitudinally to the axis of the workpiece, whereas roundness and circular run-out are evaluated transversally (Figure 2).

Some geometric deviations in cylindrical parts (adapted from [35]).
Due to all aforementioned, straightness, parallelism, roundness, and circular run-out were evaluated at the end of machining tests. For this purpose, a form measuring machine, model MAHR MMQ-44, was used (Figure 3). Straightness and parallelism were evaluated on four equidistant generatrices of the test bars (G1–G4), Figure 4(a), whereas roundness and circular run-out measurements were made at different equidistant sections (C1–C6) along L (Figure 4(b)). The results were expressed as the mean value of the measurements.

Geometric deviations measurement device.
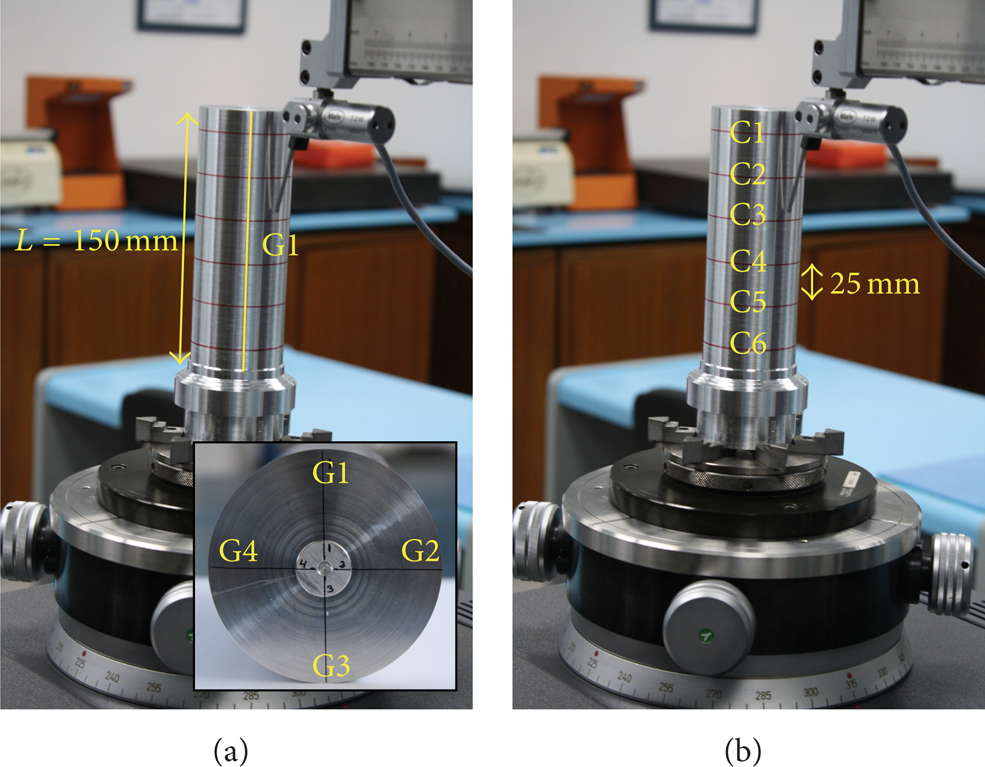
(a) Straightness and parallelism measurement on four equidistant generatrices (G1–G4) of the test bars. (b) Roundness and circular run-out measurement at six equidistant sections of the test bars.
The profiles data obtained were mathematically analyzed using the Software Form PC MAHR V4.28.7 SP5. Straightness was evaluated through the parameter STR. Its value was calculated as the distance between two parallel lines (D max -D min ) which delimit an area containing all points of the profile and which are parallel to the least squares regression line (Figure 5(a)). The parameter selected to evaluate parallelism was PAR. Its value was calculated as the distance between two parallel lines (X max -X min ), which delimit an area containing all points of the profile and which are parallel to the workpiece axis (Figure 5(b)). Roundness was evaluated through the parameter RON. Its value was calculated as the difference between the radiuses of two concentric circumferences (J max -J min ) which delimit an area containing all points of the profile and whose centers coincide with the center of the least squares regression circumference (Figure 6(a)). Circular run-out was evaluated through the parameter CRO. Its value was calculated as the difference between the radiuses of two concentric circumferences (R max -R min ) which delimit an area containing all points of the profile and whose centers coincide with the rotation center of the workpiece (Figure 6(b)).
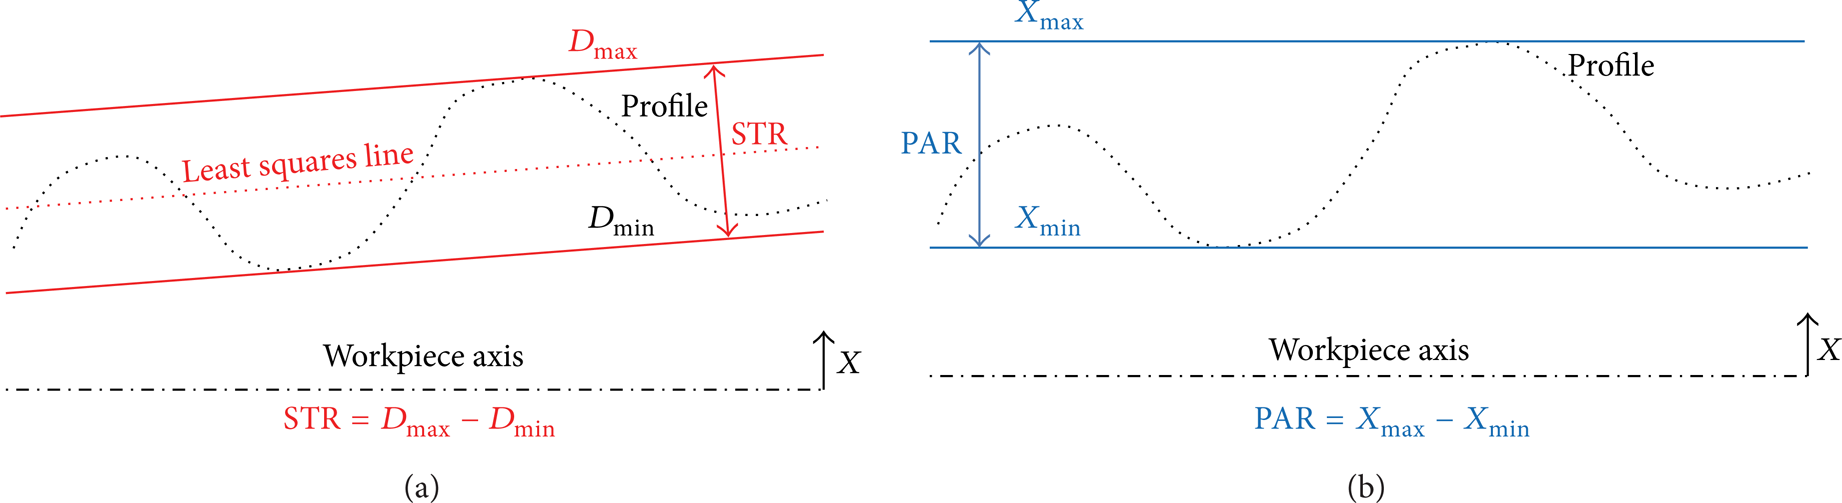
(a) Straightness and (b) parallelism evaluation of the profile obtained.

(a) Roundness and (b) circular run-out evaluation of the profile obtained.
3. Results and Discussion
The experimental data are presented and discussed in this section. First of all, an analysis of the evolution of STR(v,f), PAR(v,f), RON(v,f), and CRO(v,f) has been performed. For this purpose, GD which are longitudinally measured (STR and PAR) have been analyzed together. On the other hand, GD which are transversally measured (RON and CRO) have been grouped.
In addition, several parametric models have been developed from the experimental data. Different models (potential, exponential, and polynomial) were tested, in order to obtain which better fits to the experimental data. These models allow predicting the value of these GD as a function of v and f, for different values of those tested and within the range studied.
3.1. Straightness and Parallelism
Figure 7 shows the experimental data of STR as a function of v, for each f applied. It can be observed that STR shows similar values and trends for f = 0.1 mm/r and f = 0.2 mm/r, whereas a dissimilar behavior is shown for f = 0.05 mm/r, mainly in the range of high v values analyzed (170 and 200 m/min). In this regard, the highest differences were found for v = 170 m/min.

Straightness (STR) as a function of cutting speed (v) for the indicated values of feed (f).
In terms of v, it can be noted that STR shows a marked trend to remain constant in the range of low v values applied (40 and 80 m/min), regardless of f. On the other hand, a different behavior is observed for higher v values (170 and 200 m/min), depending on the value of f applied. So, STR shows a trend to increase with v, for f = 0.1 mm/r and f = 0.02 mm/r, whereas a slight trend to decrease with v is shown for f = 0.05 mm/r.
In spite of the singularities indicated in the average trend, it can be said that, in general, STR shows a low sensitivity to change with f. This sensitivity is slightly higher with v, principally for high v values (170 and 200 m/min). In this respect, significant differences between STR and roughness (assessed in terms of arithmetic average roughness, Ra) can be noted. Thereby, a strong influence of feed on Ra has been found in previous research, for several aeronautical aluminum alloys [34, 36, 63–65].
These differences can be explained by how STR and Ra are measured. Firstly, previous studies have shown that Ra depends almost linearly on the feed, when tools with higher radius than cutting depth are used, in horizontal turning operations [64]. Secondly, STR is longitudinally measured, so it is not directly dependent on f, but on the height, h, of the machined mark on the workpiece surface (Figure 8). This height indirectly depends on f. Therefore, STR is less influenced by f than Ra.

Influence of feed (f) and height of machining mark (h) on STR and PAR.
Furthermore, previous studies, conducted in similar aluminum alloys, have demonstrated that Ra has a lower sensitivity to change with v [34, 36, 63–65]. However, this work has revealed that STR shows a slightly higher sensitivity to change with v, mainly in the highest values of v applied (170 and 200 m/min). It seems possible that these results are due to the accumulation of vibrations that occurs at high v values, coupled with high f values. These high v and f values result in higher instability of material adhered to the tool edge (built-up edge, BUE) during the machining process [34], which affects STR (longitudinally measured).
In addition, a low value of the standard error of STR can be observed. This is due to the fact that STR is obtained as the mean value of STR1 to STR4, longitudinally measured on 4 generatrices of the test bars. Consequently, all of them are affected in similar way by the chip fragmentation and BUE formation.
Figure 9 shows the experimental data of PAR as a function of v, for each f applied. It is apparent from this figure that PAR values are higher than STR values, as expected. Nevertheless, no significant differences have been found between PAR and STR behavior, as a function of v and f. Thus, it can be observed that PAR shows a low sensitivity to change with f, whereas this sensitivity is slightly higher with v, mainly in the highest range of v applied. In this way, it can be seen that PAR shows a trend to remain constant in the range of low v values tested (40 and 80 m/min), regardless of f. On the other hand, different trends are noted in the range of high v values considered, depending on f. So, a PAR increasing is observed when v increased, for f values of 0.1 and 0.2 mm/r. However, the opposite trend is observed for f = 0.05 mm/r. The reasons are similar to those exposed above for STR.
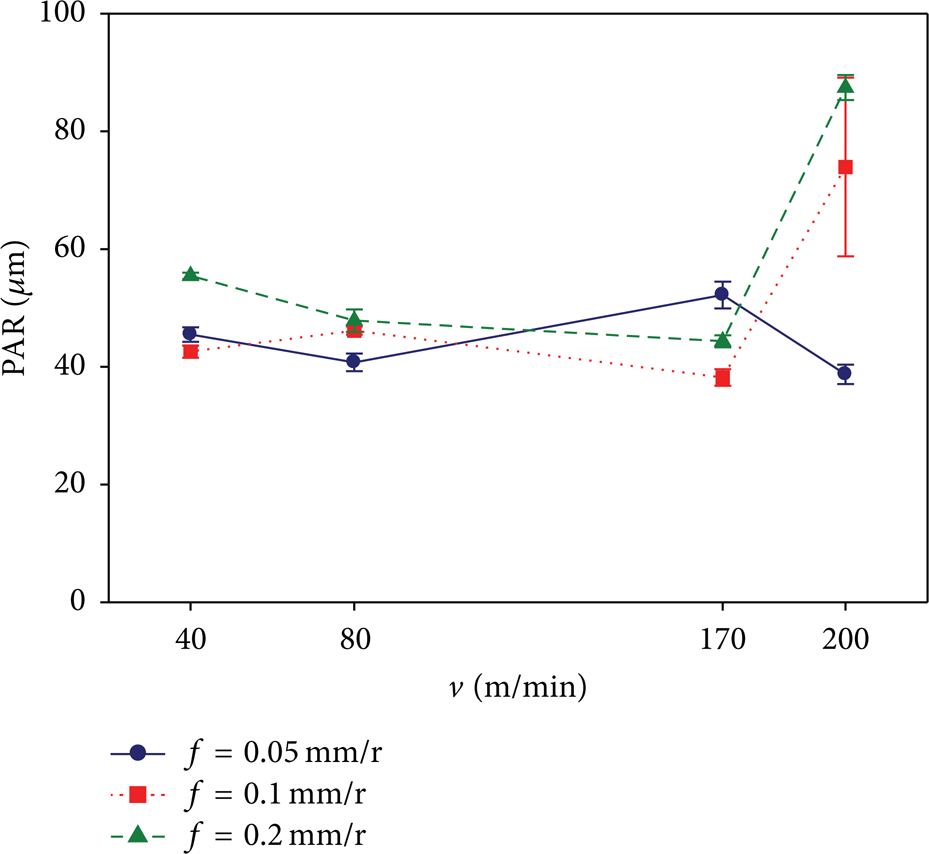
Parallelism (PAR) as a function of cutting speed (v) for the indicated values of feed (f).
In addition, a low value of the standard error of PAR can be observed, in general. These results can be explained in similar way to that exposed above for STR. Only for v = 200 m/min and f = 0.1 mm/r the standard error shows a high value, due to the accumulation of vibrations and the instability of material adhered to the tool edge, which usually occurs at high v and f values.
Finally, it should be noted that these results are consistent with previous research carried out on similar alloys, as UNS A92024 (Al-Cu) and UNS A97050 (Al-Zn) [34].
3.2. Roundness and Circular Run-Out
Figure 10 shows the experimental data of RON as a function of v, for each f applied.
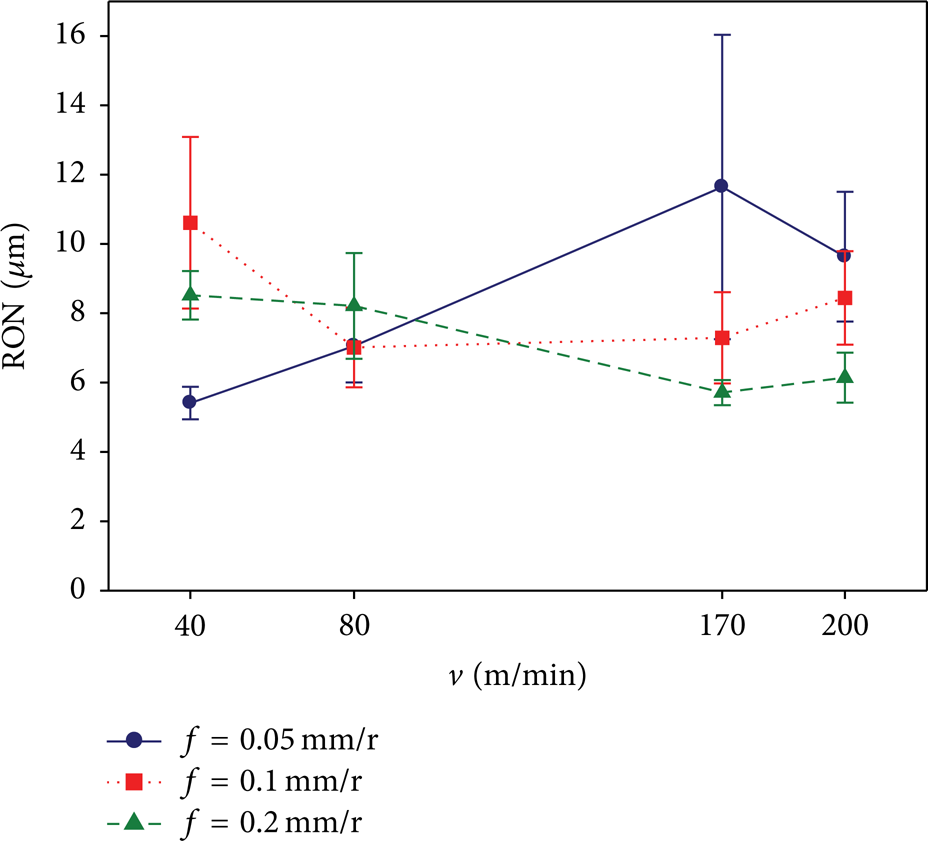
Roundness (RON) as a function of cutting speed (v) for the indicated values of feed (f).
From the first observation carried out on this figure, it can be deduced that RON values are lower than those obtained for STR and PAR. This result may be explained by the fact that RON is transversely measured, whereas STR and PAR are longitudinally measured. Due to this, RON is less affected by the chip fragmentation, as well as by the BUE formation and its instability. Thereby, it can be said that RON shows, in general, less sensitivity to change with v and f than STR and PAR.
So, for f = 0.1 mm/r and f = 0.2 mm/r, it can be seen that RON shows a general trend to remain constant, regardless of v. A higher oscillation of RON is obtained for f = 0.05 mm/r, depending on v used. A possible explanation for this might be that RON shows a higher sensitivity to change when a lower f (and consequently a lower height, h) is applied, mainly due to the chip fragmentation and BUE formation (Figure 11). Therefore, although the sensitivity of RON(f) is low, it can be said that it is slightly higher than the sensitivity of RON(v).

Indirect influence of feed (f) on RON and CRO.
On the other hand, in spite of the fact that RON shows a lower value than STR and PAR, it can be observed, in general, that the standard error of RON is higher than the standard error of STR and PAR. This fact can be explained taking into account that RON is calculated as the arithmetic average of RON1 to RON6, measured in C1 to C6 (Figure 4(b)). Due to this, the evolution of RON along L is affected by the chip fragmentation and the BUE formation, in similar way to the behavior observed in Ra in other researches [64, 66].
Figure 12 shows the experimental data of CRO as a function of v, for each f applied. As can be observed from this figure, CRO presents a similar behavior to RON, in both values and trends. Thus, the CRO values obtained are lower than those obtained for STR and PAR, whereas the standard error is higher. These results can be explained in a similar way to that exposed above for RON. Finally, it can be noticed that these results are similar to those found in previous studies carried out on UNS A92024 (Al-Cu) and UNS A97050 (Al-Zn) alloys [34, 67].

Circular run-out (CRO) as a function of cutting speed (v) for the indicated values of feed (f).
3.3. Parametric Model for Macrogeometric Deviations
As previously noted, it is useful to get models that predict the value of GD in terms of the cutting parameters. In this work, different parametric models have been developed from the experimental data. These models predict the behavior of the GD analyzed (STR, PAR, RON, and CRO) as a function of v and f. For this purpose, different models (potential, exponential, and polynomial) have been tested. For all these GD, the best fit was obtained for an exponential model as follows:

In (3), C, K11, K12, K21, K22, and y are constants. Table 3 provides the results obtained from the fit of this model to the experimental data.
Values of the coefficients obtained in the model (3).

It can be seen from the data in Table 3 that the value of coefficient C is very close to the average value of the GD analyzed (jointly considering all the tests performed). Therefore, the coefficient C sets the average trend line for each GD, in the range of the cutting parameters used (Figure 13). These results are consistent with the low sensitivity to change of GD(v,f), as previously discussed.
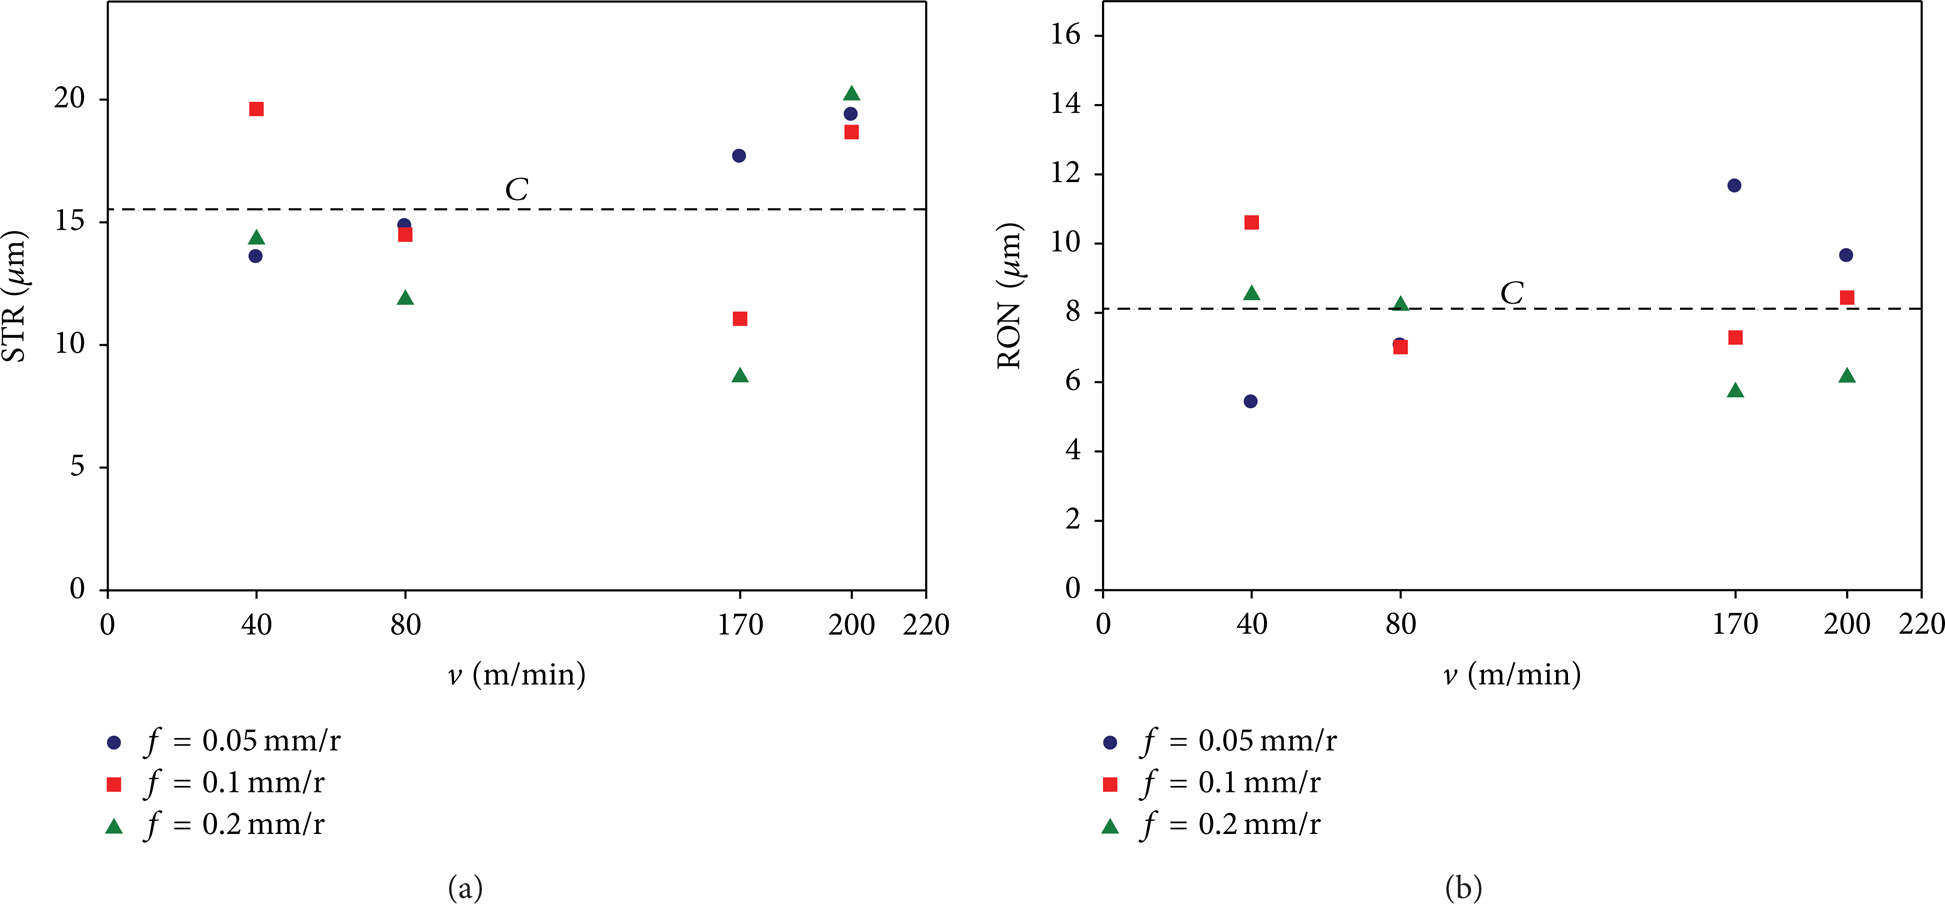
Value of C which indicates the average trend for (a) STR and (b) RON.
This general trend of GD to remain constant is modulated in the model by the f and v exponent values. Thereby, for STR and PAR, the v exponent values are higher than the f exponent values. This suggests a higher sensitivity to change with v, which is in agreement with the experimental data. On the other hand, these differences in the exponent values are not as large for RON and CRO, which indicates a similar sensitivity to change with v and f. Nevertheless, the f exponent value is slightly higher, which is in agreement with the experimental results. For all the above, it can be said that these models are, in general, consistent with the experimental data.
In Figures 14 and 15, the experimental data obtained for PAR and CRO, respectively, are compared with the results obtained using the parametric model (3).

Comparison between the experimental data and the model PAR(v,f).

Comparison between the experimental data and the model CRO(v,f).
From Figure 14, it can be seen that the parametric model for PAR presents a good fit in the range of low v values. On the other hand, higher differences can be observed in the range of high v values. This occurs similarly in the case of STR. This result may be explained, as previously mentioned, by how PAR and STR are measured, longitudinally to the workpiece. As a result, STR and PAR are strongly influenced by vibrations and instabilities of the process. Due to this, it is difficult to dispose of accurate models, mainly in the high range of v and f applied.
On the other hand, as it can be observed in Figure 15, the parametric model shows a good fit, both in the high and the low range of cutting speed. In contrast to what occurs with STR and PAR, RON and CRO are transversally measured, so they are less affected by vibrations, chip fragmentation, or BUE instabilities. Consequently, more accurate models can be obtained.
Finally, it should be noted that these parametric models are similar to those obtained by other researchers for similar aluminum alloys [34, 67].
4. Conclusions
One of the most important quality requirements applicable to machined parts is related to the surface integrity, due to its effect on their service behavior. In the context of the aeronautic industry, this is especially important when these parts are placed in critical areas of the aircraft structure.
The surface integrity concerns both geometric and physical-chemical properties. The geometric characteristics assume greater importance in the assemblage and functional behavior of coupled parts. The influence of cutting parameters on the surface roughness (microscale deviations) has been long studied, whereas there is a lack of researches of the influence of these parameters on geometric deviations (macroscale deviations), despite their importance. Thus, further studies in this direction are required, especially in dry machining, when the upper bound of these deviations is normally obtained.
In this work, an analysis of the influence of the cutting parameters (cutting speed and feed) on several geometric deviations (straightness, parallelism, roundness, and circular run-out), obtained in the dry machining of UNS A97075 (Al-Zn) test bars, has been made.
The experimental results have revealed, in general, a low sensitivity to change of these geometric deviations with the cutting parameters. This behavior differs from that observed by other researchers for roughness (evaluated in terms of Ra), where the feed has shown a predominant influence.
Notwithstanding, the straightness and the parallelism have shown a slightly higher sensitivity to change with the cutting speed. This is due to the fact that they are longitudinally measured, so their values are more influenced by vibrations, chip fragmentation, and BUE instability, mainly in the higher range of cutting speed. On the other hand, the roundness and the circular run-out are less affected by the aforementioned phenomena, because they are transversely measured. In this case, the highest sensitivity to change has been found at low feed values, when the height of machined mark is lower and far more sensitive to vibrations. Because of this, it can be said that the roundness and the parallelism show a slightly higher sensitivity to change with the feed.
In addition, a set of exponential parametric models have been proposed for STR(v,f), PAR(v,f), RON(v,f), and CRO(v,f). These models allow the prediction of these GD values as a function of cutting parameters applied (v and f), with a certain degree of approximation, in the range of cutting parameters tested. Finally, it should be pointed that these models are similar to those obtained by other researchers for similar aluminum alloys, so they can be thought as general for such alloys and it is left for further research to check their generality.
Conflict of Interests
The authors declare that there is no conflict of interests regarding the publication of this paper.
Footnotes
Acknowledgment
The authors thank University of Malaga-Andalucía Tech Campus of International Excellence for its economic contribution to this paper.