
Abstract
It is very important for drivers to obtain driving information easily and efficiently. There are many advanced devices used for driving safety assistance. Of these assistance devices, the head-up display (HUD) system can promote the reduction of driver's reaction time and improve spatial awareness. The drivers' attitude towards and preference for HUD system are crucial to design the functional framework and interface of HUD system. This study explored the relationships between drivers' attitude and HUD presentation image designs using stated preference data from questionnaire survey. The questionnaire included drivers' attitude towards the use of HUD and the preference for the information display zone and information display elements of the HUD. Contrastive analysis was adopted to examine the variations in drivers' attitude and preference for age and driving skills. According to the results, the participants have varying attitudes to HUD system, but most participants show relatively unified preference for the information display zone and information display elements. The results can also be used to customize a HUD presentation image which is in accordance with the drivers' feelings and preferences.
1. Introduction
Research shows that many traffic accidents are caused by human errors in longitudinal or lateral driving behavior [1]. With the development of information technology, there are many advanced electronic devices used for driving safety assistance [2]. The head-up display (HUD) system, which projects visual information into the driver's forward-looking visual field, is a conceptually ideal driver assistive system. The first HUD was originally developed in the Hawker-Siddeley Buccaneer in 1960, which was used to help pilots operate such aircraft more safely. In 1988, HUD technology was first introduced in the automobile industry by General Motors (GM) in Oldsmobile and Pontiac models. In recent decades, HUD has become an essential device in most luxury vehicles. For example, BMW's M series and X5 are both equipped with HUD. Automobile HUD presents important information to drivers such as speed, warnings, gas level, and position navigation. With the assistance of HUD, drivers can check important driving information from the front windshield instead of dashboard. Therefore, the HUD system can reduce the amount and duration for drivers to capture the display information from dashboard, while maintaining sight and attention on the road.
Nowadays, the HUD systems have drawn a lot of attention to design new ways and interfaces for representing vital information to the driver [3]. With the benefit from the development of computer science and information technology, the hardware of HUD system can provide plenty of presentation images and powerful functions. However, the complexity of driving behavior indicates that the design of HUD should be in accordance with the need and preference of drivers otherwise the HUD system cannot work well and even affect negatively. It means that the relations between the HUD system and drivers are crucial [4]. Therefore, such relations become a hot research topic in the files of traffic safety and vehicle design. Firstly, the previous research presented many benefits from the use of HUD system. As a result, HUD system may improve driving control and, therefore, driving safety. The application of HUD system can reduce drivers’ response time to emergency and make speed control more consistent [5, 6]. The contrastive analysis between HUD and HDD (head-down display) on the driving performance showed that the HUD can cause less mental stress for drivers and is easier for first time users to use [7]. Cheng et al. introduced a novel laser-based wide-area head-up windshield display to assist a driver to comply with speed limits. This research showed that the head-up windshield display can minimize deviation of drivers’ gaze direction without adding to unnecessary visual clutter. In addition, the augmented reality-based visualization schemes for longitudinal and lateral driver assistance in the head-up display (HUD) of cars can support driving performance; also it made most test drivers feel safer. On the contrary, some research reported that HUD is considered as an obstacle for driving [8]. The existing HUD may create confusion because of the inconsistent installation location and shape and the information offered; thus it increases the accident rate due to the driver's lack of visual focus [9]. During driving a car, drivers receive the information passed by HUD system and other assistance systems. But with more functionality, more and more information will be generated and make the driving environment very complicated; that makes it very difficult for the drivers to digest and respond to all of the information [10]. Therefore, researchers discussed the display elements and interface of HUD system. Tangmanee and Teeravarunyou [11] studied the superimposition properties between the guided arrow marked on the road and the guided arrow on the center of the driver's field of vision. This study can contribute a guideline for HUD design and road safety. Charissis and Naef analyzed the performance through driver tests using different focal levels for the projection of a full windshield HUD interface [12].
The literature review highlights the importance of integrating the driving information by optimum design of HUD interface. Additionally, HUD system has been more and more popular but not limited to luxury motorcars. Head up display with full-windshield range and active safety warning will be one of the most important advanced driver assistance systems (ADAS). It suggested that the human-centered interface is crucial for HUD system. The installation location and shape, the information offered, the imaging elements, and so forth, should be in accordance with drivers’ behavioral characteristics.
The aim of this study is to analyze the attitude to and preference for the use of HUD. The stated preference data are collected by questionnaire survey in China. Contrastive analysis is adopted to examine the difference in attitude and preference with different personal characteristics. This study is expected to give a better understanding of the use of HUD system and the potential improvement in the HUD interface. Additionally, the automotive industry in China has been the largest in the world measured by automobile unit production and sale. Against the background in the popularity of HUD system in China, analyzing some important behavioral characteristics of Chinese drivers is helpful to improve the HUD design in Chinese market.
The rest of the paper is organized as follows. The next section offers a brief overview of the stated preference survey. The succeeding section introduces the field survey for obtaining the stated preference data for the use of HUD system. Also the questionnaire is introduced in detail. The fourth section shows the results from the data analysis. The main point of this section is to indicate the attitude to and preference for HUD system in China. Subsequently, the fifth section discusses the potential application and improvement in HUD system according to empirical data. The final section presents some conclusions from this study and a tentative plan for future work.
2. Methodology
The SP survey conducted in this research was designed in parking lots in Beijing, China. The reason for adopting the SP data is the advantages and characteristics of SP data. While both revealed preference (RP) and stated preference (SP) data can be used to analyze preferences, there are certain advantages to using the SP data in this case. While using RP study, a limitation arises because only the final consumer choice can be obtained [11]. Therefore, it is difficult to ascertain how survey participants came to take their final decision. This complication occurs because the information and factors which can affect the decision making may not be fully known. On the other hand, the stated preference surveys overcome these complications because the experimenter controls the choices. In SP settings, the experimenter determines the choices by setting some hypothetical situations. While this may not reflect the respondent's actual choice because of the constraints on the choice set, it allows us to measure attribute differences between the presented alternatives [12]. In this type of survey each option is presented based on choices the respondent has already made. This allows for the presentation of choices that the individual can actually consider while removing alternatives that the respondent will surely not consider.
Two types of state preference questionnaire were used: (a) ranking and (b) stated choice. This was with the intention of examining how using different stated preference questionnaires impact on people's replies. In a questionnaire, the respondent simply chooses the answer in hypothetical scenario [12]. Then, the preference can be obtained and predicted according to the choice in such hypothetical situation. In the questionnaire, respondents must order the hypothetical situations in order of preference.
According to Wang et al. stated choice and stated preference methods are limited by a respondent's ability to understand the hypothetical situations [13]. Therefore, the hypothetical situation in the SP studies should have strong relation to the respondents’ daily experience to get rational model and accurate results.
In this research, the usage rate of HUD system is quite low. Therefore, the analysis of revealed preference lacks bases so we cannot draw reasonable conclusion. Additionally, the HUD system becomes more and more popular in China; the preference and perception for HUD system is important to design human-centered interface and analyze the market potential. The analysis is valuable for the development of HUD system, especially in the emerging markets.
3. Survey and Data
3.1. Survey Design
In order to obtain information on the preferences and perceptions of drivers on HUD system, a study was carried out where questionnaires were issued in real traffic conditions. It was decided to use a stated preference study and to explore the potential of pooling information from it. The questionnaire was divided into three parts and each respondent was required to complete both parts of the survey. The first part collected data on individual sociodemographic characteristics such as sex, age, and income as well as information on individuals’ driving experience. The second part contained an SP study, collecting information on the individual's attitude towards HUD system. The third part collected individual's preference for the HUD system, including the constituent element and interface design.
All of the questions were set as the type of ranking or stated choice. In the questionnaire, a series of presentation images were designed to give a better understanding of the display elements in HUD system. Before the survey, a pilot study was conducted to examine the rationality of the questionnaire. According to the pilot study, the questionnaire was modified. While conducting the survey, the questionnaire was distributed to the drivers near parking lots. The drivers were presented with a questionnaire, which they were asked to choose according to individual's preference and perception. During the survey process, each driver finished the survey with the help of an investigator.
3.2. Data Description
After the survey, a total of 545 drivers responded to the survey. The available sample contained data collected from 539 individuals. According to the survey, 35.06% of the respondents are female and 64.94% are male. The age distribution is in accordance with the average population in China, with the majority of drivers between 25 and 50 years of age. In terms of monthly income, 8.91% earn less than ¥1500, 50.83% earn ¥1500–¥4500, 29.50% earn ¥4500–¥9000, and 10.76% earn more than ¥9000. The distribution of driving experience (the length of obtaining driver's license) is fairly normal: 20.78% are new drivers who have obtained driver's license less than 1 year, 35.06% have obtained driver's license 1–5 years, 22.63% have obtained driver's license 5–10 year, and 21.52% are skilled drivers (longer than 10 years).
4. Empirical Results
4.1. Drivers’ Needs for Driving Information
The drivers’ attitudes towards HUD system are important to evaluate the application conditions of HUD system. Therefore, the questionnaire examines the drivers’ attitudes, including the familiarity with HUD system, the expectation for the function of HUD system and the attitudes to the effect of HUD on driving safety. From the SP survey, 63.08% of respondents reported that they know nothing about HUD system, while 17.63% indicated that they only hear about HUD system, and 12.06% indicated that they know the function of HUD system. Only 7.24% of respondents stated that they have experience in using HUD equipment. It suggests that the HUD system only gains less popularity among drivers in China. Additionally, the majority of respondents (87.8%) agreed that efficient information perception helps to improve driving safety. After learning the main principle and function of system with the help from the investigator, most respondents indicated that the HUD system, which projects driving information into the front windshield, is a conceptually ideal driver assistance device. Then the respondents gave the rank of driving information according to their driving experience as shown in Figure 1. From the results, the gap (distance from the leading car) is the first important driving formation. The driving speed ranks the second place. Most respondents rank the gap, driving speed, traffic condition, and speed of leading car very highly. It suggests that these four kinds of driving information are crucial for driving behavior. And this information should be considered for the information element firstly.

Ranking of driving information.
4.2. Drivers’ Preference for Presentation Images
Then, the preferences for presentation images were analyzed. The presentation images were designed into three kinds: (a) traditional speedometer shape, (b) character shape, and (c) figure with character as shown in Figures 2 and 3. According to the SP survey, for the presentation image of speed, 63.08% of respondents like the character shape as shown in Figure 2(b) and only 16.33% like the traditional speedo. Some of respondents stated that the speedo shape is too complex; however, the character shape is clear to show the speed information. It is similar that most respondents like the character shape as the presentation image of engine speed as shown in Figure 3(b).
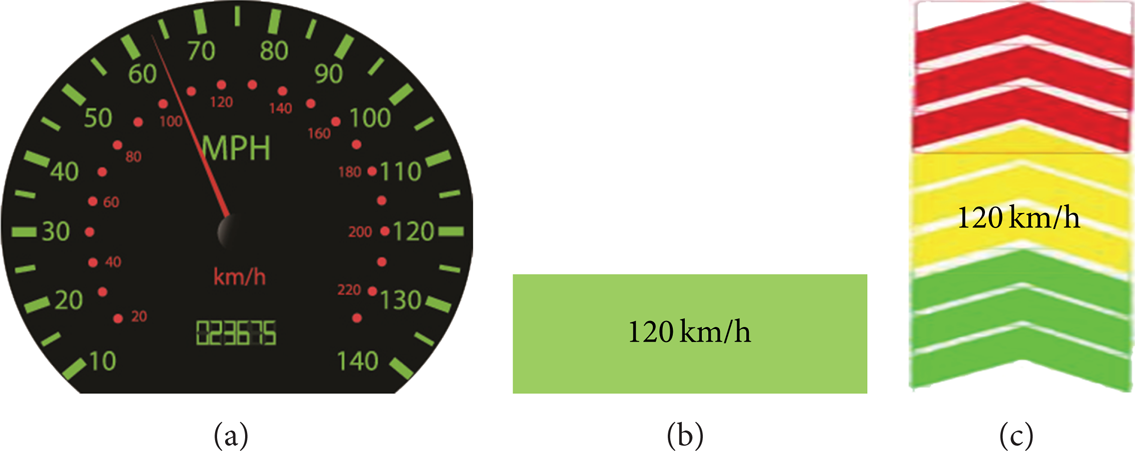
Preference for the presentation images of speed.

Preference for presentation images of engine speed.
Additionally, for the navigation information, most respondents stated that the arrow shape is more efficient to guide the driving route. They thought that the presentation images in Figure 4(b) (navigation information and traffic condition in the same map layout) may decrease reading efficiency. Sometimes, the navigation map is too complex to get the useful information efficiently. According to the previous research, the navigation arrows in the HUD system can give a direct visual impression for driver [11]. Though the shape of the guide arrow has no effect on driving performance and response time, the location of the arrows does. The guide arrow also did not distract experienced drivers. In the SP survey, the respondents preferred the arrow shape for navigation information. Such preference can increase the efficiency of HUD system for projecting the navigation information. This result is important for the designer and researchers to design simple and clear presentation element in HUD system.

Preference for presentation images of engine speed.
4.3. Drivers’ Preference for Display Zone
Another important survey in this study is the preference for the information display zone. Four zones in the front windshield were listed as images in a real driver's cab. The respondents indicated the most favorable display zone. The majority of respondents stated that zone C in Figure 5 is the convenient display zone. The second favorable zone is zone A. According to the external dimensions and visual characteristic of drivers, zone C is proper for projecting the necessary information. However, a disadvantage of zone C is that the position of zone C is in the center of the range of driver vision so as to increase the fixation time. The long fixation time on zone C may decrease the range of driver vision on road and external environment. Therefore, it is suggested that the full windshield range for HUD presentation is a rational choice for the advanced HUD system.

Preference for the information display zone.
5. Discussion
From the survey and analysis, the drivers’ preference for HUD system is shown. The design of presentation images can affect driver performance and safety. A crucial issue for the application of HUD system in China is that only a few people know the HUD system and its function. And many people cannot realize the effect of HUD on driving performance and safety. While designing the functional framework and interface, some basic principles should be considered. (a) The function of HUD system is to improve the cognition efficiency and accuracy. Unnecessary function may increase the workload of driver. (b) The information which meets the driving behavior can be projected into the windshield. Adequate information does not mean performance and safety. (c) The interface should be simple and legibility. Display elements including character, figure, and graph should be arranged on the basis of driver's preference. In brief, the HUD system should be designed on human-centered concept.
According to the results of SP survey, the functional framework can be divided into three parts. And seven kinds of information are considered as necessary elements of presentation image. The design of functional framework for HUD system is shown in Figure 6. Also an example of presentation image designs is shown in Figure 7. The example includes the designs of driving information and malfunction warning which use the results derived from the SP survey.

Function framework for HUD system.

Presentation image designs of HUD system: (a) driving information and (b) malfunction warning.
6. Conclusions
This study used stated preference data from questionnaire survey to explore the relationships between drivers’ attitude and head-up display presentation image designs. A questionnaire was designed to collect the driver's information. The questionnaire included drivers’ attitude towards the use of HUD and the preference for the information display elements and information display zone of the HUD. The results can be used to customize a HUD presentation image which is in accordance with the drivers’ feelings and preferences. However, the questionnaire design can be improved to get more information for driving behavior. Another important future work is to design the interface according to the preference and attitude of drivers. With the help of SP data, the human-centered HUD interface can be design and the HUD system can work efficiently.
Conflict of Interests
The authors have no conflict of interests regarding the publication of this paper. All authors have seen the paper and approved it.
Footnotes
Acknowledgments
This research was supported in part by the National Nature Science Foundation of China under Grants 51378062 and 71301010 and the Introducing Talents of Discipline to Universities under Grant B12022.