
Abstract
The response of a table to the impact of its driving hammer in the highly accelerated life test (HALT) system depends on, among other things, the location of the hammer, the presence of multiple hammers, and the angle at which the hammer is mounted to the table. The present study investigated the response of a table to a variety of impacts from different combinations of hammers. It began with a theoretical analysis of the forces of impact exerted by hammers which led to the calculation of the corresponding displacement. These theoretical calculations revealed the mechanics of the HALT system to help explain the working principles behind this complex system. Then a simulation model was built to check the accuracy of the theoretical results. Finally, the accelerations of a table in a real HALT system were measured. These data showed good agreement with the experimental results and computer simulation. The responses of HALT systems have not been investigated thoroughly to date. The current study can help equipment designers and end users better understand the working principles of this kind of systems. It can be considered a breakthrough in terms of improving the performance of reliability testing with this kind of system.
1. Introduction
Highly accelerated life test (HALT) for environmental stress screening (ESS) is widely used to ensure the reliability of electronic systems. It was developed specifically for solid-state electronics but can be applied to any product. Such tests apply both vibrational and thermal loadings simultaneously on test specimens. By applying stress through vibration accelerations, through thermal cycling, or together with power cycling, HALT can detect hidden defects in products still in the development stage [1, 2]. Further design improvements can then be made based on the test results.
In a real testing system of HALT as shown in Figure 1, the upper compartment is a thermal load chamber and its bottom is a vibration table excited by hammers driven either pneumatically or electromagnetically. Under different time periods in the test, the product is subjected to increasing stress levels of temperature and vibration (independently and in combination), rapid thermal transitions, and other stresses specifically related to the operation of product. Figure 2 shows an example of the typical vibration step stresses input to the HALT machine. The typical vibration step increments are 5 Grms and the dwell time at each level is a minimum of ten (10) minutes. The key issues for the test such as determining multiple failure modes and root causes, determining functional operating limits, and determining functional destruction limits all can be obtained.
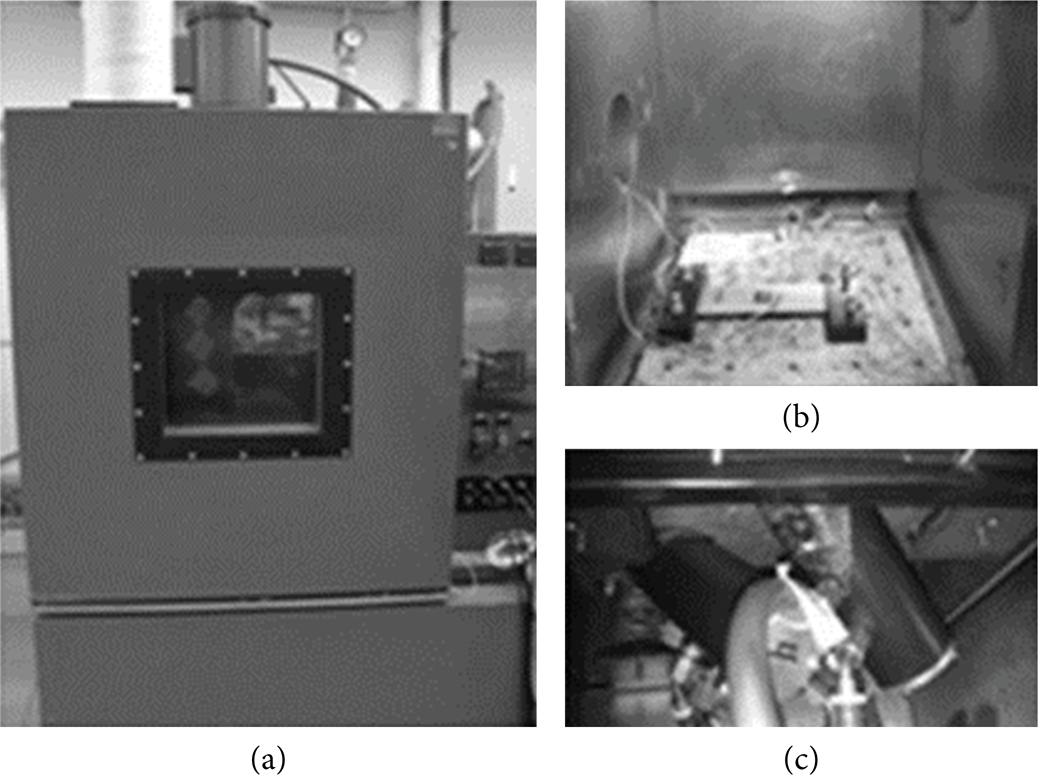
(a) A typical HALT machine, (b) test chamber, and (c) driving hammer.

A typical vibration step stress input in HALT.
There are four basic sources of vibration in HALT: (1) the electromagnetic shaker, (2) the hydraulic shaker, (3) multiple pneumatic hammers, and (4) the electromagnetic shaker combined with the skewed fixture. The first two are typically used on products undergoing uniaxial vibration testing. Multiaxial testing is generally performed by the latter two in reliability enhancement testing. Though most HALT systems utilize multiple pneumatic hammers to drive the table, this method has many disadvantages, such as poor table uniformity, an uncontrollable frequency spectrum, small low-frequency energy, and small displacement. The test loading is much different from the actual conditions in which the products operate [3–5]. Liu claimed that of these four sources of vibration, only the electromagnetic shaker combined with the skewed fixture—such as that developed by the author—can produce triaxial vibrations simultaneously [1, 6]. Later a more concrete design of the skewed fixture was developed by Sun et al. [7].
Knowing how a table moves under the impact of these hammers can help researchers make better choices when testing products. With developments in the miniaturization of the electromagnetic shaker into the electromagnetic hammer (also called electrodynamic [ED] hammer), it is now possible to use ED hammers in a HALT system. In addition to being more efficient than pneumatic hammers, ED hammers can control the individual impact frequency and force and can produce shocks at low frequencies [8].
Installing an ED hammer on a testing table can result in various combinations of motion. This study aimed to analyze the motion of a table when impacted by various combinations of hammers. Based on the results, further improvements to the performance and optimization of HALT system design can be achieved.
2. The HALT System Model
A typical HALT system consists of a table and the driving hammers beneath it. There are four hammers installed in the current system, numbered I, II, III, and IV, respectively. The response of the table is of interest because it can reflect many different excitation patterns on the test specimen. Therefore, this study explores the response of the table to the force of an individual hammer and multiple hammers simultaneously.
2.1. Theoretical Model
The HALT system considered here consists of a flat table mounted on a set of four springs and four hammers mounted underneath the table at different orientations as depicted in Figure 3. The force and frequency of impact of the hammers are triggered by a controller system.
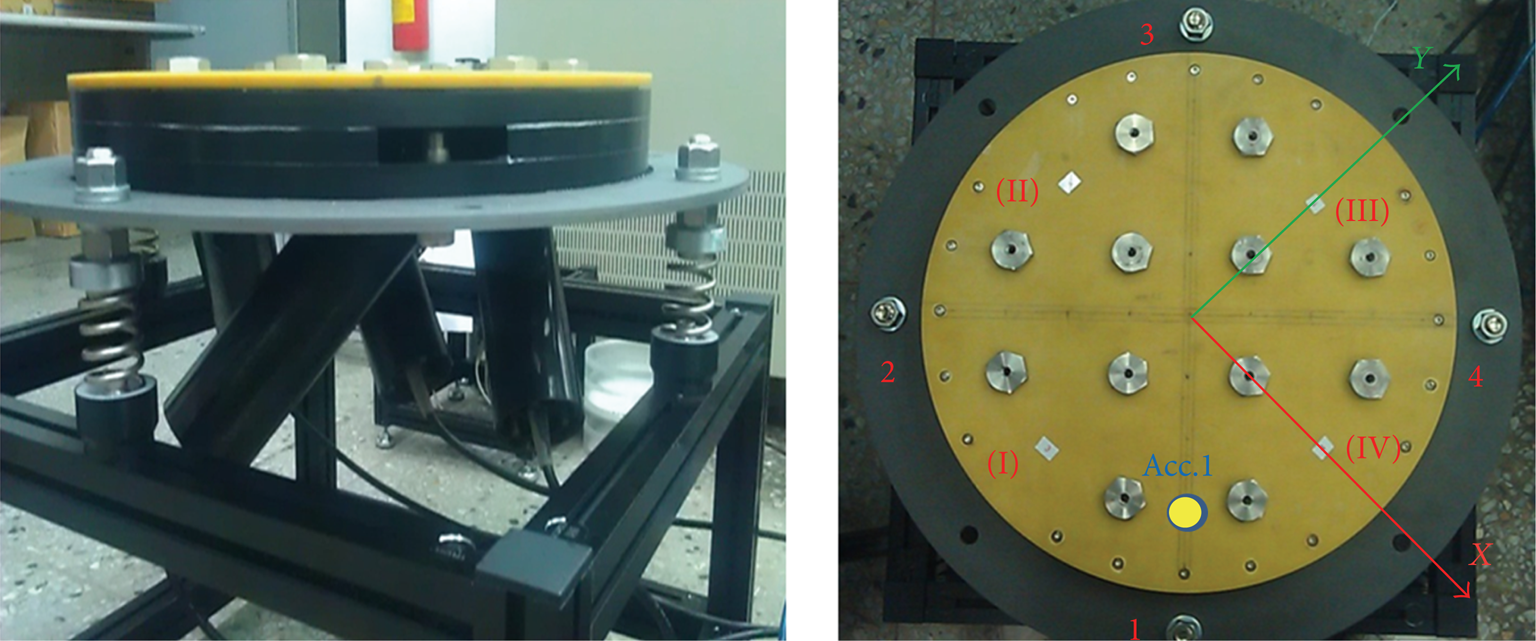
The construction of an electrodynamic hammer system with its table.
The first part of the study focuses on the response of the table (i.e., displacement, acceleration, and force) to various types of impact by the hammers (e.g., the impact of only one hammer or of multiple hammers simultaneously). Note that the forces of impact from the hammers are redistributed equivalently at each of the springs through the force analysis.
Figure 4 shows a coordinate system (OXYZ) with origin O located at the center of the table. The OXY plane coincides with the plane of the table. The x-axis starts from origin O and passes through the center of the contact area where hammer IV is located. The y-axis is orthogonal to the x-axis and passes through the center of hammer III. Finally, the z-axis is perpendicular to the plane of the table. The springs are arranged equidistant from one another on circle (O, R) (i.e., the circle centered at O with radius R). Similarly, the four hammers are attached alternately with the springs and lie on circle (O, r). The hammers are installed at angle α inclined to the plane of the table so that the forces exerted on the table also incline at this angle α to the OXY plane.

The coordinate systems defined in the hammer system.
2.2. A Single Hammer
Assume that hammer I exerts force
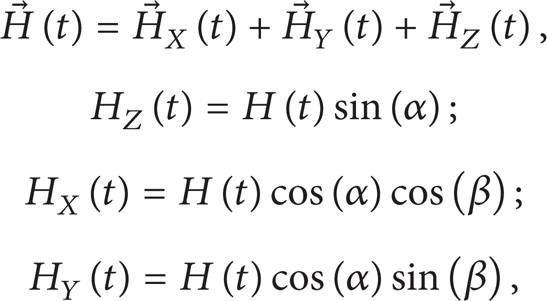
where α is the angle of force

Equivalent force system on springs.
Generally speaking, all forces are dynamic forces. For example,
Each of the components of force

where r is the distance of the hammer to the center of the table O.
To simplify the analysis of the displacement of the table, we replace each component of the hammer's force

where r is the distance of the hammer's force component

Similarly, in Figure 5(a) again, the force component

Therefore,

The force component

Calculating from (7) produces the following:

The moment component can make the table rotate about the z-axis and can be replaced by the four tangential forces that lie on circle (O, R) and at each of the springs, as indicated in Figure 5(b):
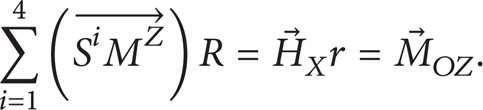
From (9), we can obtain

Again, the force of the spring that generates the moment,
or

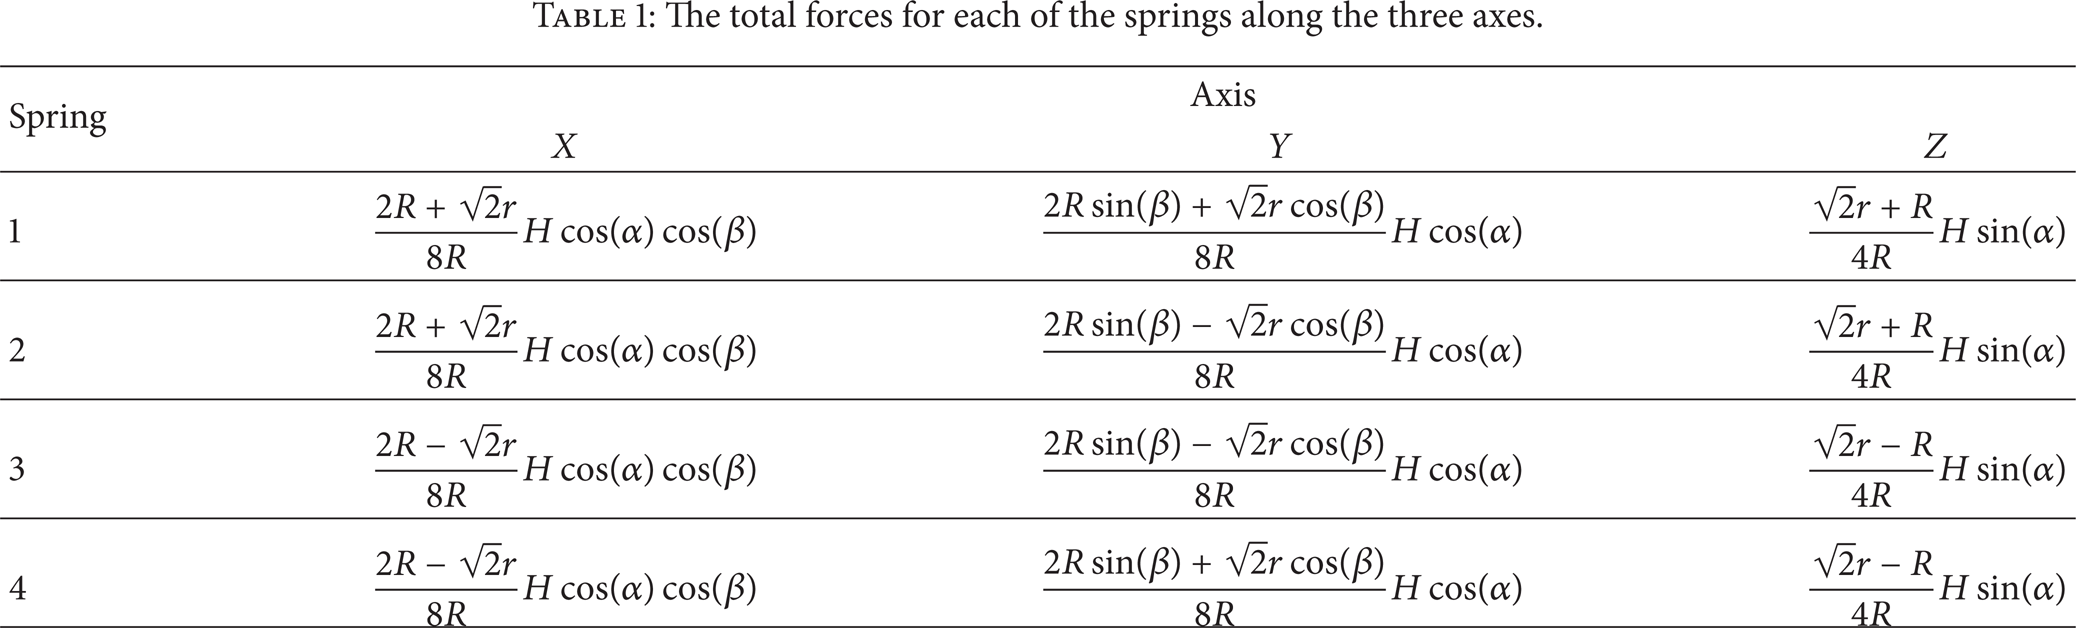
Based on the foregoing calculations for analyzing the effects on a table of the force from a single hammer, it is found that this hammer force with its equivalent components can be replaced by a series of forces (such as those causing translation, rotation, etc.) along each of the axes of coordinate system (OXYZ). Note that
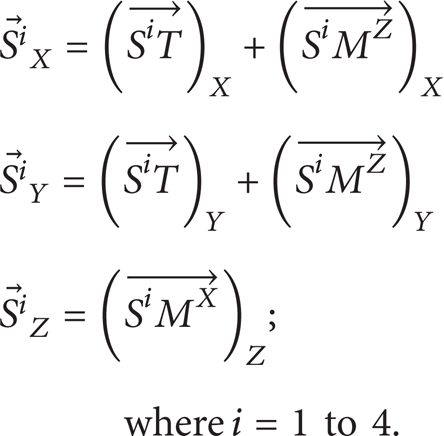
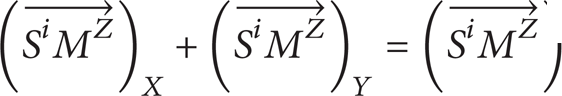
As can be seen in (13), the force of spring 1 along the X direction,
The total forces for each of the springs along the three axes.
The aforementioned analyses can be summarized as follows.
When a table is impacted by a single hammer (e.g., hammer II, hammer III, or hammer IV), the motion of the table can be analyzed in a similar way as for hammer I, except that the geometric relationship between the hammer and springs must be considered. For example, the force components on spring 1 resulting from the impact of hammer III are exactly the same in magnitude as those on spring 3 resulting from the impact of hammer I. However, they are pointing in opposite directions, except for those forces in the Z direction, as shown in Figure 6(a). Moreover, the force components on spring 1 resulting from the impact of hammer II are exactly the same as those on spring 4 resulting from the impact of hammer I but pointing in opposite directions, except for those in the Z direction (see Figure 6(b)).
Given a change in the direction of the force of impact (i.e., variation in angles (α,β)) resulting from the mounting of the hammers to the table, all force components on the spring will change.
To achieve the best output of the table, one needs to select the appropriate hammer location, contact angle of the hammer, and combination of hammers.
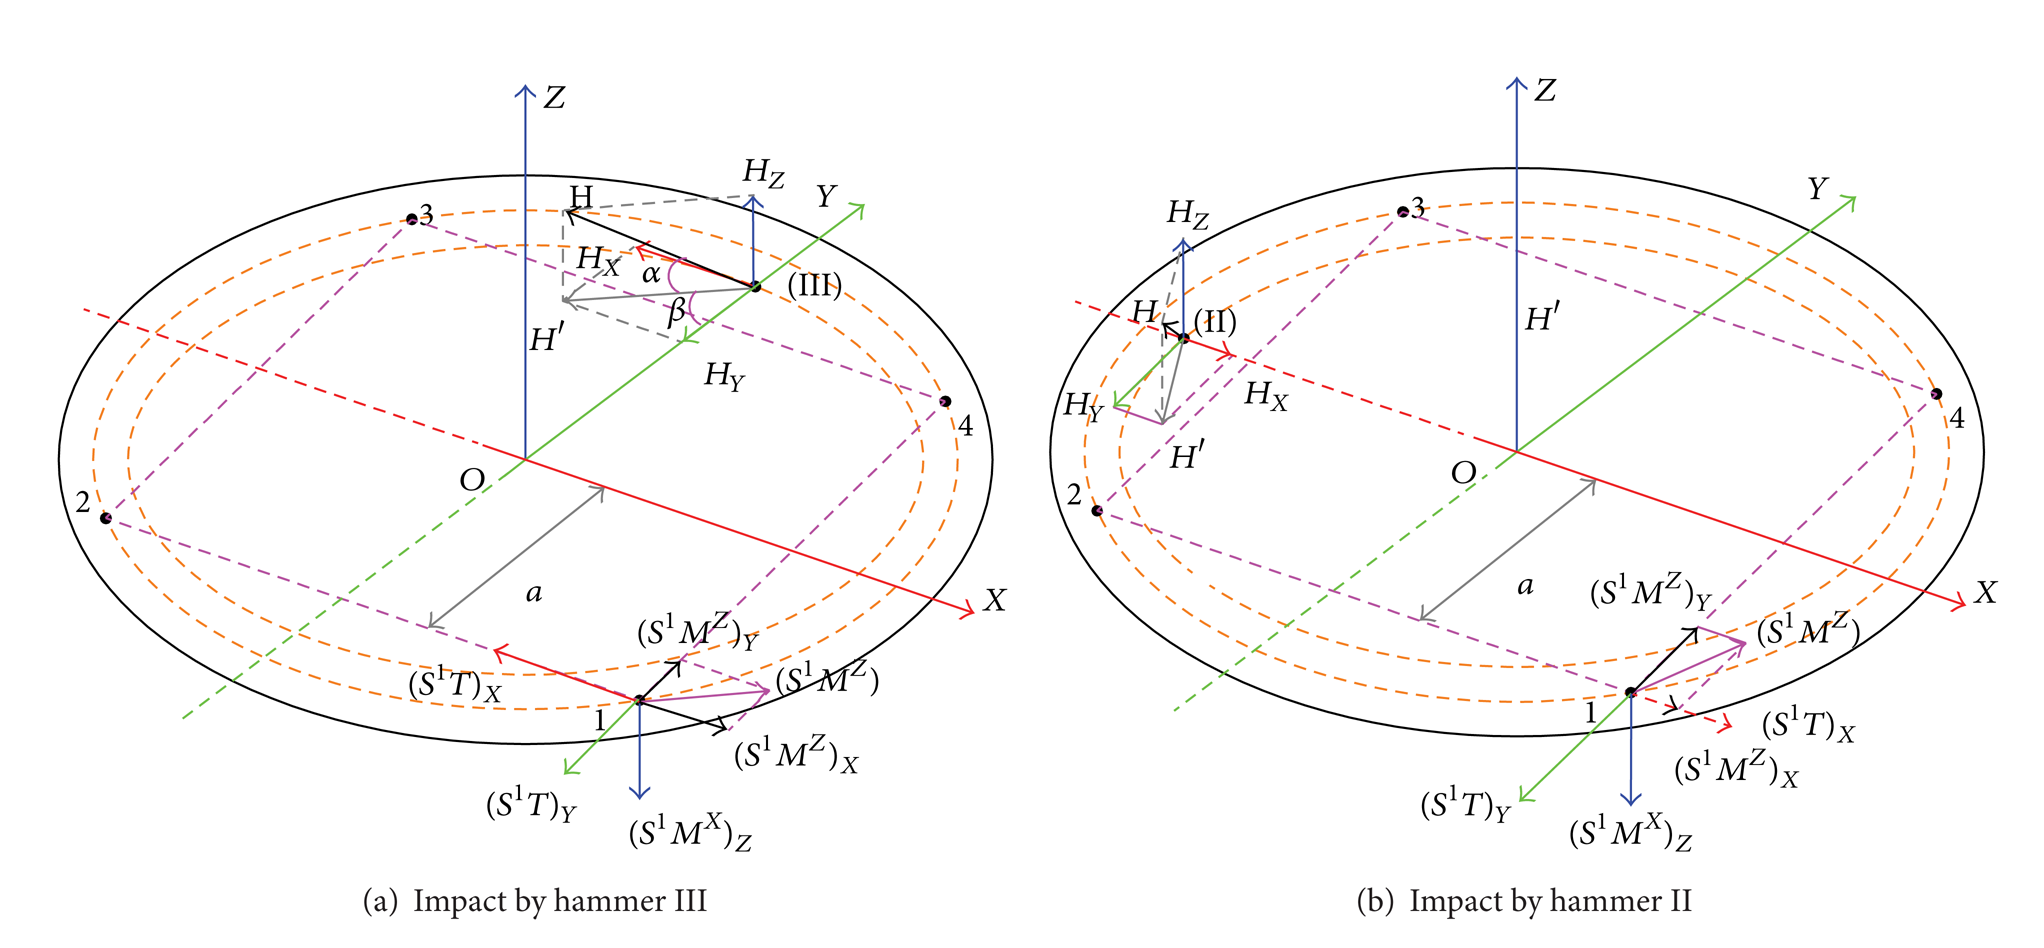
Force components at spring 1 caused by the impact of a single hammer.
2.3. Multiple Hammers
When the table is being impacted by the forces of multiple hammers simultaneously, then the total resultant force at a specific spring is not simply the sum of the forces of each individual hammer. It is necessary to consider the direction of corresponding forces that act on the same spring.
In theory, it is possible to vary the locations and angles of incline of the hammers mounted to the table for the greatest impact. However, in the real world, the hammers in HALT systems are usually fixed by the manufacturer, and it is not possible to change their positions or angle of contact. Figure 7 shows a typical installation of four equidistant hammers whose top surfaces make contact with the table lying on a circular path centered at O with radius r. The projected force of impact of each hammer on the OXY plane is tangential to circle (O, r) with angle of incline α = 45° pointing away from the table surface.

Forces of impact on the table from each of the four hammers.
2.4. Analysis of Table Displacement
The motion of the table impacted by hammers can be analyzed by calculating the displacement at each of the four springs caused by the force components discussed previously.
As shown in Figure 5, with regard to the motion of the table when impacted by hammer I, the force of impact of the hammer can be replaced with the resulting force components at all four springs. Therefore, the motion of the table can be determined by calculating the displacement of the four springs acted by these force components. From the analysis in the preceding section, the spring not only compresses along the Z direction but also is bent around the X and Y directions.
The deflection of the spring can be calculated using the following equation:
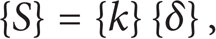
where {S} is the force matrix acted on the springs, {k} is the stiffness matrix of the spring, and {δ} is the deflection of the spring along the three axes.
The components of the deflection of a spring along the three dimensions can be calculated from the equations in Table 1 and (13). Nevertheless, one also has to consider the combined effects of the hammers on the deflection along the three axes.
Suppose that the bottom of the spring is fixed on a plane, where it attaches on a frame structure to support the whole system. As indicated in Figure 4, a coordinate system (O′-X′-Y′-Z′) is set on this fixed plane, with O′Z′ pointing in the same direction as OZ(O′Z′≡OZ) and O′X′ parallel to OX (O′X′//OX) and O′Y′//OY. Because the force components
To better describe the spring effects, we can use the physical principle for combining multiple springs [12–16] to transform the four springs, each with their various deflections, into one spring located in the center of the table. This transformed single spring has stiffness along the three axes that can be calculated by

or

where {k t } is the matrix of equivalent total spring stiffness with components in the x-, y-, and z-axes designated as (k t ) X , (k t ) Y , and (k t ) Z , respectively. {f(k i )} is a function of the stiffness matrix of each of the original four springs in the three axes (i.e., k X i , k Y i , and k Z i ), where i is the number of the springs (i = 1–4).
As shown in Figure 8, for the force along the x′-axis, the force components

The transformation of multiple springs into a single spring.
For example, for the motion of a table impacted by

If the deflection is small, the change in the length of the spring can be ignored. Then this lateral deflection makes the longitudinal axis of the spring rotate at an angle of
It is easy to calculate the deflection of the general spring positions through the center locations of springs A and B as indicated in Figure 8(c):

In this case of the motion of a table impacted by hammer I, the deflections along the z-axis for springs 2 and 3 are moving up, and the deflections of springs 1 and 4 are going down. In a similar way, when we consider the table being impacted by the translational force
Combining all deflection components along the directions of the three axes for the case of hammer I exerting a force
deflections along the X direction: δ1X = δ2X>δ3X = δ4X,
deflections along the Y direction: δ1Y = δ4Y>δ2Y = δ3Y,
deflections along the Z direction: δ2Z>δ1Z>δ3Z>δ4Z.
These analyses show that when a single hammer acts at different locations, it results in different force components along the three axes for a specific position on the table.
3. Simulation of a HALT System
The foregoing sections presented a theoretical analysis of the mechanics of a HALT system. The current section describes the use of the commercially available ANSYS Workbench software to create a HALT model to evaluate the theoretical model.
3.1. Simplified Simulation Model
The model consists of a flat table mounted on a set of four springs. All springs are fixed on the bottom of the table, as shown in Figure 4. The geometric dimensions of the table and springs are as follows:
table: diameter = 500 mm; thickness = 10 mm,
springs: outside diameter (D) = 50 mm; wire diameter (d) = 4 mm; number of active coils (n) = 10; total height = 100 mm.
The hammers and springs are equally spaced on a circle centered at O with a diameter of 200 mm. As shown in the figures thereafter, there is no hammer in the model; the hammers generating the impact forces were treated as impacting forces and replaced with a force that changes with time,
Consider a table impacted by single hammer acting at location I. For the sake of simplicity, we first calculate the deflections caused only by the vertical force component

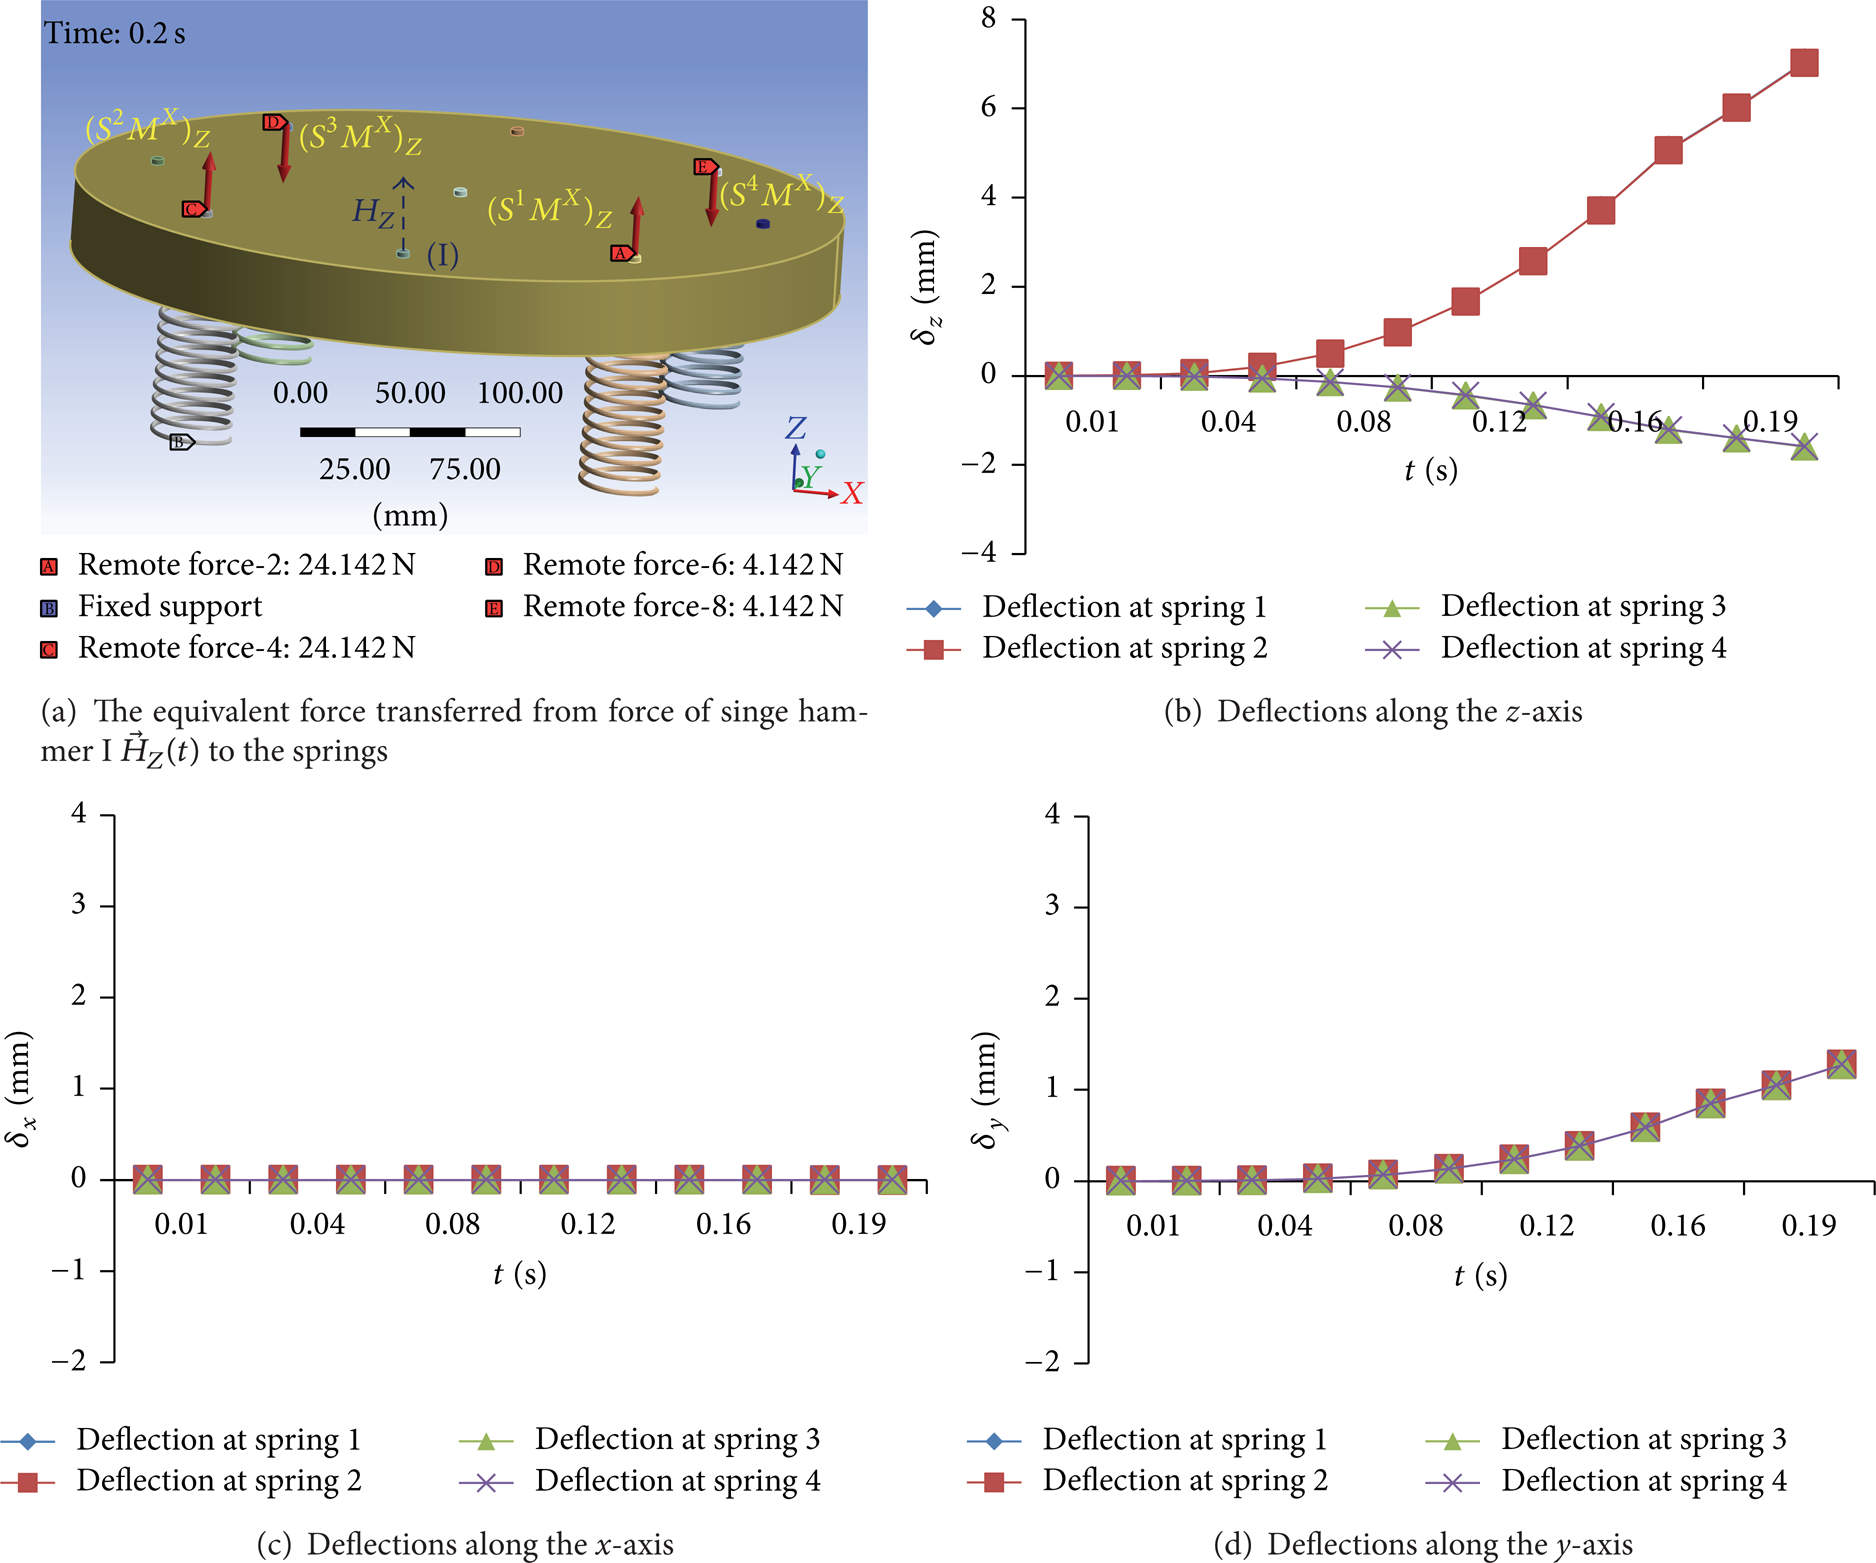
Deflections of the table at each of the four springs in the directions of all three axes resulting from
As can be seen in Figures 9(b), 9(c), and 9(d), the deflections along the three axes are exactly the same for these two methods of analyses. The figure shows the overlapping results from the two methods. It also shows that the exertion of vertical force
It generates deflections of the table along the z- and y-axes, as shown in Figures 9(b) and 9(d), but not along the x-axis, as shown in Figure 10(c). Also, Figure 9(b) shows the deflections along the z-axis at all four springs following the impact of force
Comparing the deflection values shown in Figure 9, one can conclude that there is no apparent movement of the table along the x-axis. Because the deflections along the x-axis are very small, they can be ignored.
The deflections along the y-axis increase gradually over time and have the same values at all four springs.

Deflections of the table impacted by
Similarly, consider the impact of another linear force component
Individual analyses of the motion of the table with
One can also apply two forces
Figures 10(b), 10(c), and 10(d) summarize the results for the deflections at all four springs along the three axes for comparison purposes.
Among the plots in Figure 10, the most noteworthy shows the deflections along the X direction. As indicated in Figure 10(c), δ1X = δ2X>δ3X = δ4X, and all deflections are positive.
For the deflections along the Y direction, shown in Figure 10(d), δ1Y = δ4Y>δ2Y = δ3Y; the deflections of springs 1 and 4 are positive, and those of springs 2 and 3 are negative.
As can be seen in Figure 10(b) for the deflections in the Z direction, δ2Z>δ1Z>δ3Z>δ4Z; the deflections of the table at springs 1 and 2 point upward, and the deflections at springs 3 and 4 point downward.
The deflections of all four springs are completely consistent with the explanations in the previous section. Thus, it can be concluded that the theoretical model accurately depicts the response of a table to the impact of hammers.
3.2. The Response of the table to Different Impacts: With a Single Hammer at Various Locations and with Multiple Hammers
In the theoretical analysis, it was shown that when a single hammer acts at different locations, the table responds differently at a specific fixed point. In this section, four separate cases of a single hammer acts at one of the four hammer positions (i.e., I, II, III, and IV) are considered. As indicated in Figure 4, the model of the HALT system contains four hammers arranged equidistant from another around a circular path around the center of the table. These hammers make direct contact with the table. At each moment of impact, the control of the hammer through the piston displacement inputs is identical. Figure 11 shows the differences in maximum acceleration along the z-axis at spring 1 for all four cases. For example, in Figures 11(a) and 11(d), the maximum accelerations are 14.059 and 27.39 m/s2 for hammers I and IV, respectively.

Accelerations of the table along the z-axis at spring 1 when acted on by each single hammer.
Figure 12 indicates that the maximum acceleration at spring 1 is 23.618 m/s2 when the table is impacted by hammers II and III simultaneously. Yet this acceleration does not exceed the 27.39 m/s2 of hammer IV impacting the table (Figure 11(d)).
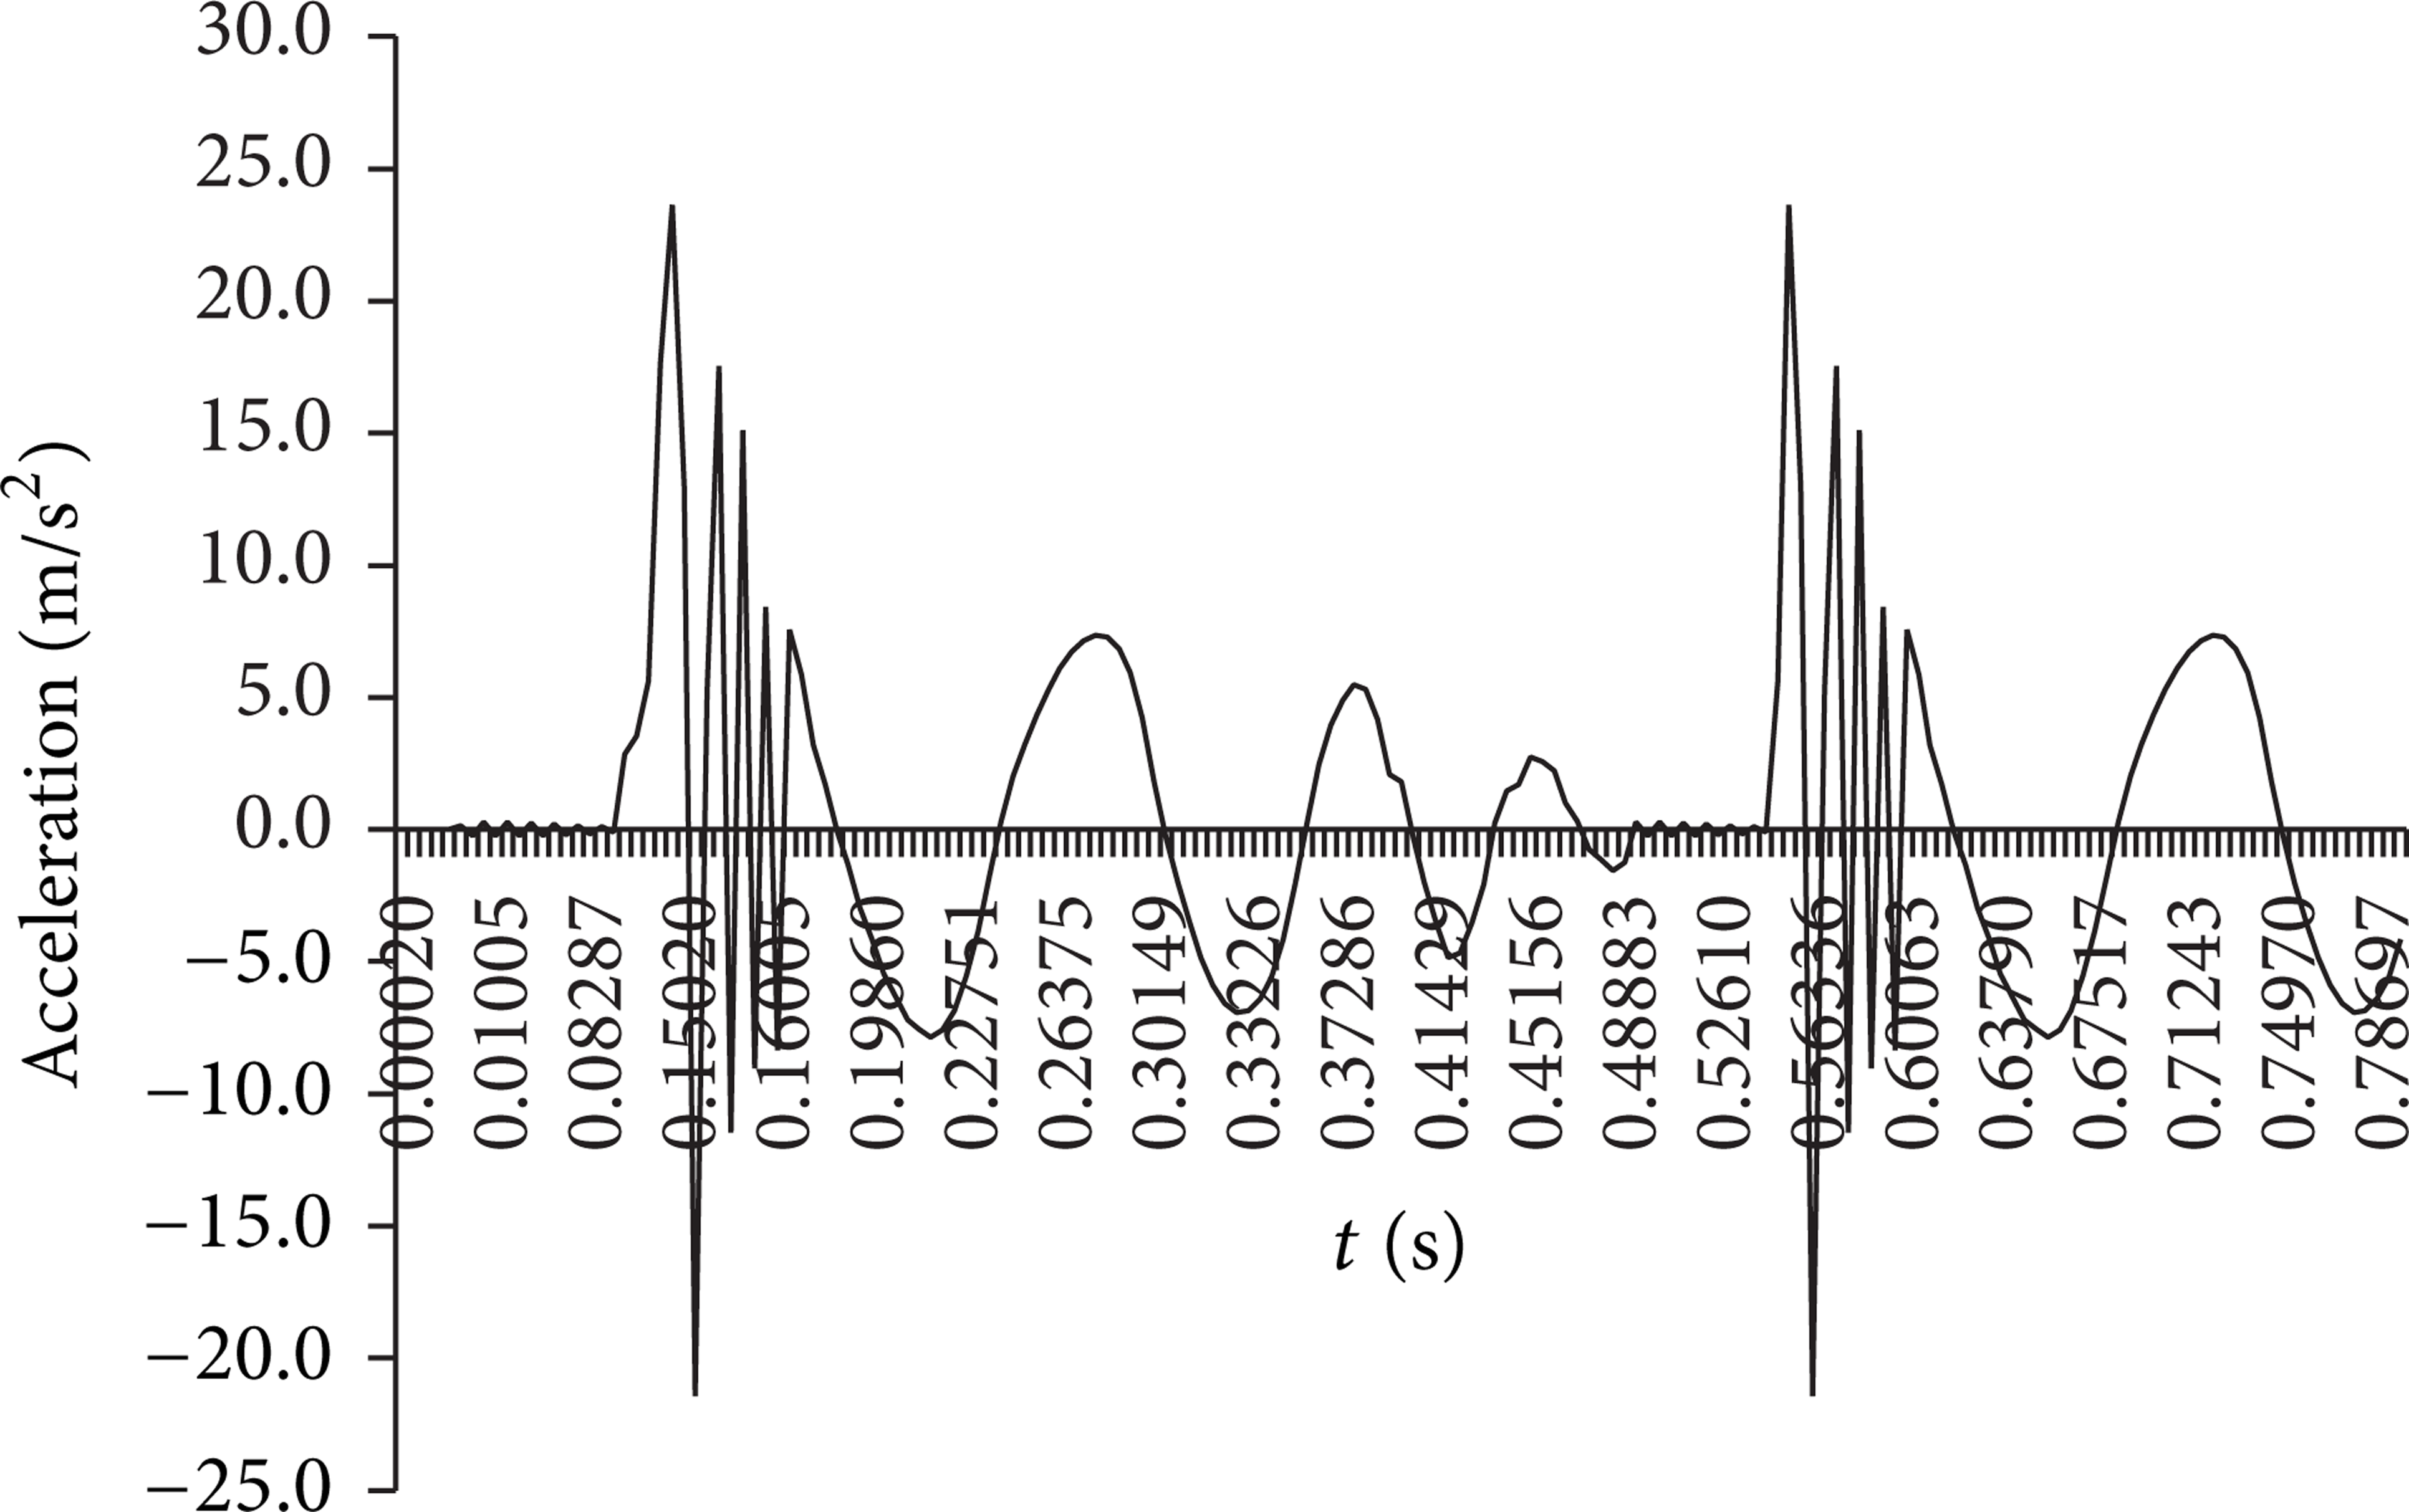
Acceleration of the table along the z-axis at spring 1 when impacted by hammers II and III.
4. Experimental Results
In the present experiment, a real HALT system designed with ED hammers was used to collect the test data. The system used was quite unique among existing HALT systems. Instead of using typical pneumatic hammers, it used ED hammers to produce the input shock pulses to the table. The hammers were arranged equidistant from one another around a circular path around the center of the table. The ED hammers were attached in direct contact with the table together with the controller system as shown in Figure 3.
During the test, all hammers were maintained at the same frequency and input power. The acceleration of the table was measured with an accelerometer on the z-axis of the table corresponding to (close to) spring 1.
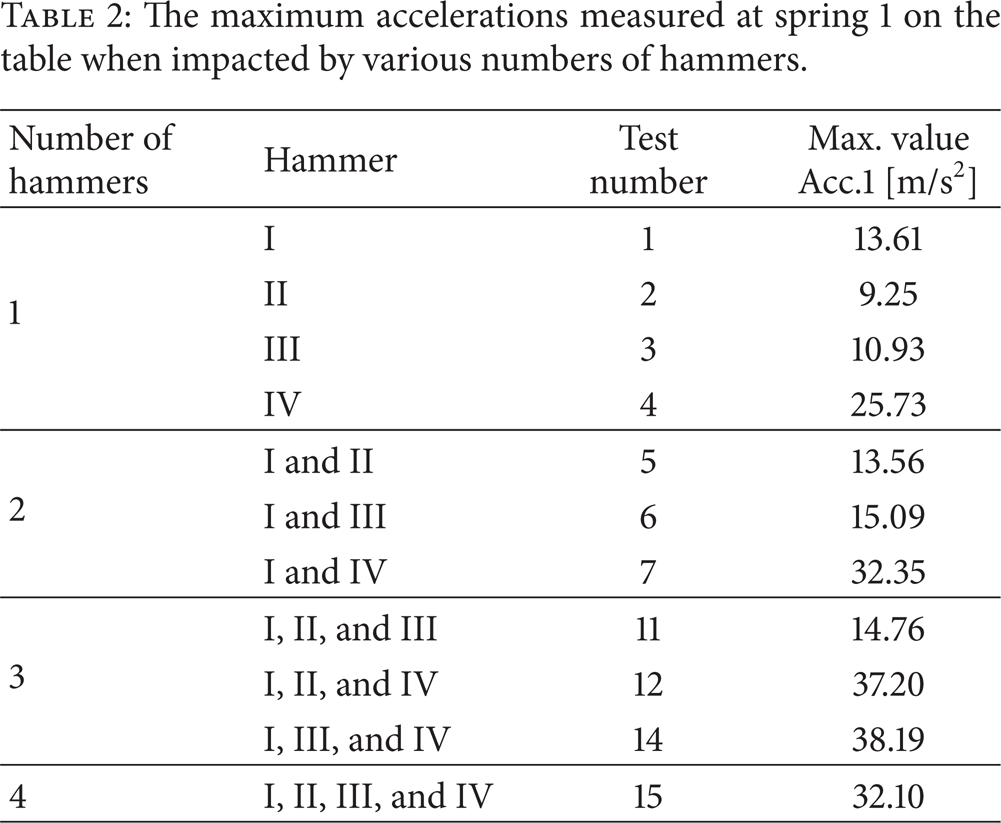
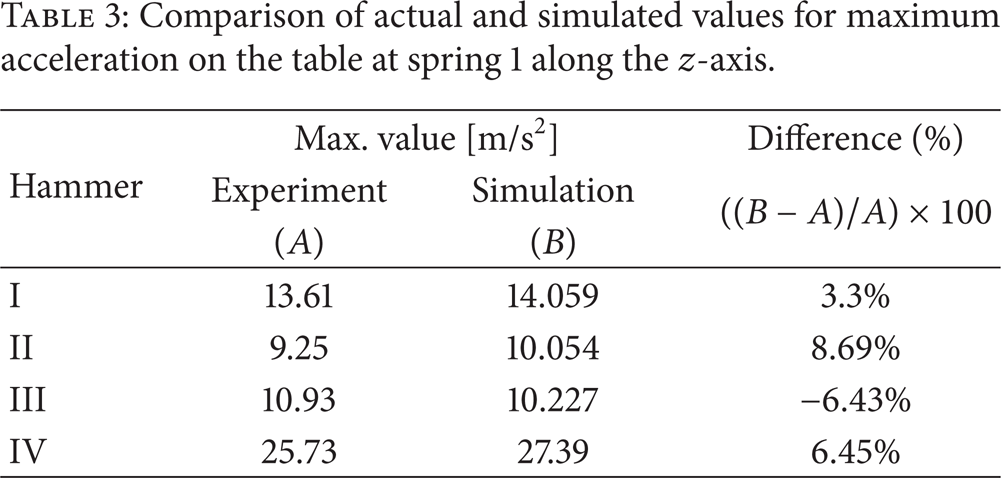
Table 2 shows the maximum accelerations measured on the table near spring 1 for (1) a single hammer (i.e., hammer I, hammer II, etc.), (2) a combination of two hammers (i.e., hammers I and II, hammers I and III, etc.), (3) three hammers acting simultaneously (i.e., hammers I, II, and III, etc.), and (4) all four hammers acting simultaneously (i.e., hammers I, II, III, and IV). The results from the experiment matched well with the theoretical results. For example, when the table was acted on individually by each of the four single hammers, the difference between the measured and simulated response at spring 1 ranged from 3.3% to 8.69%, as shown in Table 3.
The maximum accelerations measured at spring 1 on the table when impacted by various numbers of hammers.
Comparison of actual and simulated values for maximum acceleration on the table at spring 1 along the z-axis.
Note that using a combination of hammers did not necessary result in greater impact power. For example, test 4, which used only hammer IV, generated a maximum acceleration of 25.73 m/s2, almost twice the acceleration generated from using hammers I, II, and III (14.76 m/s2; see Table 2).
5. Summary and Conclusions
Exploring in detail the responses of a table to various combinations of hammers in a HALT system can illuminate the effects of different impacts on products during testing. In this paper, a theoretical model was created to analyze the impact of a hammer with equivalent spring forces mounted at four locations on a table. These spring forces were considered the exerting forces in a subsequent simulation. The influences of impact force (when the piston moves up and down inside the cylindrical hammer housing) and spring stiffness on the motion of the table were also examined theoretically. A finite element simulation analysis of the HALT system was conducted to test the theoretical calculations. The satisfactory consistency between the experimental and analytical results indicates that the theoretical method was correct. The corresponding methods can be used to investigate the responses of HALT systems in other applications, such as the design of system hardware and the prediction of test results before prototypes are made.
In the experiment, a real HALT system was impacted by either a single hammer or multiple hammers to measure the acceleration of the table at a fixed location near spring 1. Table 3 shows that the theoretical results agree well with the experimental ones. However, in the case of multiple hammers, the differences between the simulated and actual test results are much larger because it is hard to get two or three hammers to hit simultaneously, whereas those in the analysis are acting at the same time.
In addition, different locations on the table respond differently to specific types of impact. In the theoretical analysis for the case of hammer I, the displacements along the three axes at the four springs are as follows:
deflections along the X direction: δ1X = δ2X>δ3X = δ4X,
deflections along the Y direction: δ1Y = δ4Y>δ2Y = δ3Y,
deflections along the Z direction: δ2Z>δ1Z>δ3Z>δ4Z.
Even a single hammer acting at different locations will have different effects on the motion of the table at a specific point. This is because each hammer at each location has different force components along the three axes at the same location of the table. Figures 6 and 11 show that the values of the force components on the table are different at spring 1 when the table is impacted individually by hammer II and hammer III.
By choosing a logical combination of multiple hammers, one can test products more effectively. In this study, using a combination of hammers did not necessarily result in higher impact power. For example, as shown in Table 2, using two hammers (I and II) produced a maximum acceleration along z-axis at spring 1 of 13.56 m/s2 compared to 25.73 m/s2 when hammer IV alone was used.
In sum, different types of impact by different hammers generate different responses from a table. The forces of impact can be better controlled by choosing the appropriate combination of hammers. It is sometimes an incorrect thinking that using more hammers can always get stronger impact. However, in reality users never have the chance to switch between combinations of hammers. The present study provides designers of HALT systems with insights into the response of the system to enable them to optimize hammer mounting as well as the number of hammers in future designs.
Conflict of Interests
The authors declare that they have no conflict of interests regarding the publication of this paper.
Footnotes
Acknowledgment
The authors would like to express appreciations on the support from King Design Company both for the equipment and funding in this study.