
Abstract
This paper presented an analysis of the gear shifting performances of a multipurpose vehicle transmission in driving condition by Ricardo's Gear Shift Quality Assessment (GSQA) system. The performances of the transmission included the travel and effort of the gear shift lever and synchronizing time. The mathematic models of the transmission including the gear shift mechanism and synchronizer were developed in MATLAB. The model of the gear shift mechanism was developed to analyze the travel map of the gear shift lever and the model of the synchronizer was developed to obtain the force-time curve of the synchronizer during the slipping time. The model of the synchronizer was used to investigate the relationship between the performances of the transmission and the variation of parameters during gear shifting. The mathematic models of the gear shift mechanism and the synchronizer provided a rapid design and verification method for the transmission with ring spring.
1. Introduction
Transmission is one of the critical components of automobile and closely related to driving performance, riding comfort, and safety of the vehicle. Shift performance is the most important evaluation index of transmission and commonly concerns transmission design and improvement. The essential criterions for the operating quality of gear shifting are the shift force and travel of the gear shift lever. The gear shift mechanism plays an important role in the interface between the driver and the vehicle. Since the shift force of the driver is transmitted from the gear shift lever to the synchronizer sleeve by the gear shift mechanism, the design parameters of gear shift mechanism affect the shifting quality of the manual transmission [1]. The maximum resistance is synchronizing force when gear shifting. Parameters of the synchronizer are very important in defining objective shift quality assessment [2].
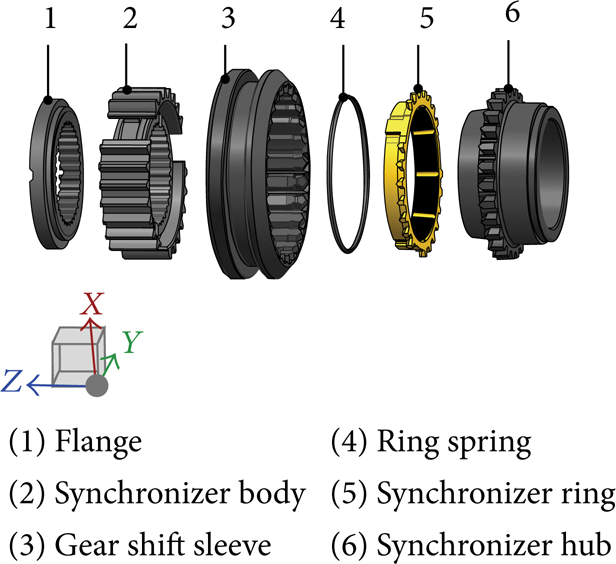
In order to understand and optimize the gear shift performance, many researches on gear shift mechanism and synchronizer have been carried out over the past years. Lovas et al. proposed a model to study the synchronizing process and eight main phases of synchronizer behavior had been defined in the model [3]. Hoshino developed a novel simulated technique for describing the synchronization mechanism for a heavy-duty truck gearbox [4]. In their works, the movement and contact force of the synchronizer components had been simulated with an analytical model using ADAMS. Abdel-Halim et al. derived theoretical performance equations from experimental results for multicone synchronizer and the equations have been used to demonstrate the potential improvements in shift quality for typical vehicles [5]. As we all know, the multipurpose vehicle (MPV) often runs under the condition of heavy load, so there are conflicts among the MPV's requirements and the parameters of synchronizer as single cone synchronizer is used in the transmission. In order to understand the shift performance of the transmission, the gear shift mechanism and the synchronizer must be analyzed together. The gear shift mechanism and the synchronizer studied in this paper are shown in Figures 1 and 2, respectively. It should be emphasized that there is a ring spring (part 4 in Figure 2) in the synchronizer. The ring spring is used to provide the presynchronization force that pushes the synchronizer ring to the synchronizer hub.

Gear shift mechanism model.
Synchronizer model.
The paper built mathematical models of the gear shift mechanism and the synchronizer which were used to describe the gear shifting performance and investigated the relationship between the parameters of the transmission and gear shift quality. In order to obtain the experimental data during gear shift, the Ricardo's Gear Shift Quality Assessment (GSQA) system was introduced to test the shift force and travel of the gear shift lever. This brought a way to describe the force and travel characteristics of the transmission. By analyzing the movement relationship between parts of the gear shift mechanism and the dimension chain of parts inside of the gearbox, a mathematical model of the gear shift mechanism was built using MATLAB. In terms of the travel of the gear shift lever, a travel map of it was drawn by the mathematical model. In terms of shift force, the lever ratio of gear shift mechanism was calculated by the mathematical model. According to the GSQA test data and the parameters of the synchronizer, a synchronizer model which was built by polynomial line fitting was presented in this paper. The synchronizer model brought a mathematical description of the synchronizing force against the slipping time when synchronizing. Investigating the mathematical models of the gear shift mechanism and the synchronizer provided a way to improve the transmission's shifting quality.
2. Shift Performance Test
2.1. Experimental Setup
In order to study the gear shift performance of the transmission, the Ricardo's Gear Shift Quality Assessment (GSQA) system was introduced to test the performances of the MPV's transmission. In order to obtain experimental data, a holding stand was set up with one side fixing on the floor and the other side fixing on the windshield glass by vacuum chuck, the force sensor was mounted on the gear shift lever of the gear shift mechanism, and meanwhile the angle sensor and the displacement sensor were mounted on the shore. Figure 3 shows the GSQA mounted on the MPV. The sensors of GSQA dynamically recorded the shift force and the shift travel of the gear shift lever in the process of the MPV's running. Three-dimensional force and travel of the gear shift lever were finally acquired by the sensors of GSQA. The precision of force recorded by GSQA was 0.01 N, the precision of displacement recorded by GSQA was 0.01 mm, and the sampling frequency of GSQA was 2.5 kHz.
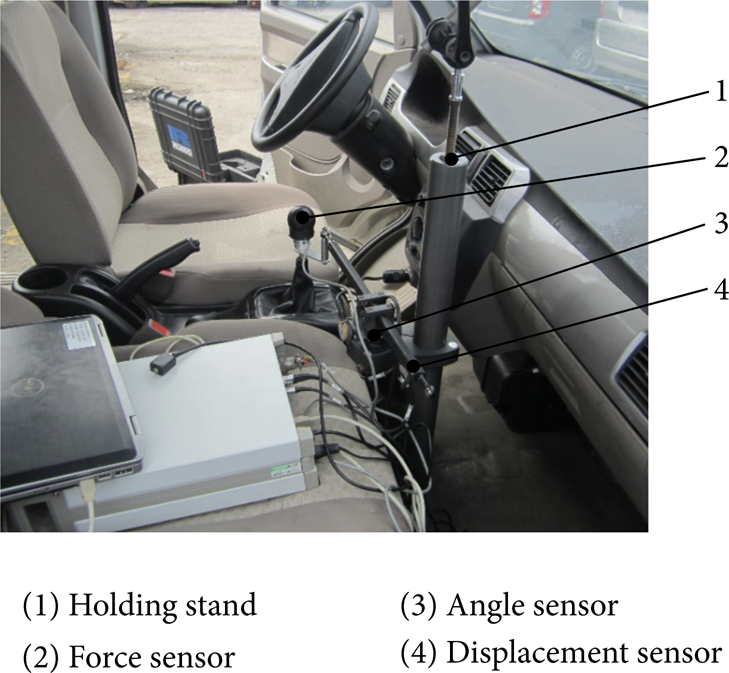
Device of GSQA system.
In order to get the test data, the GSQA test was conducted on a dry straight road and divided into eight groups. Four groups shifted up gear: 1st–2nd, 2nd–3rd, 3rd–4th, and 4th–5th, and the other four groups shifted down gear: 2nd-1st, 3rd-2nd, 4th-3rd, and 5th-4th. The GSQA test covered all the gears of the MPV's transmission in condition of driving forward.
2.2. Experimental Results
Figure 4 shows four shifting up groups of GSQA test curves and Figure 5 shows four shifting down groups of GSQA test curves. The force and travel shown in Figures 4 and 5 refer to the effort and travel of the gear shift lever, respectively. Figure 4(a) depicts the force-time curves and the travel-time curves when the transmission shifts up from the 1st to the 2nd gear. There are three peaks of the force curves in Figure 4(a). The first peak indicates the transmission quits from the 1st gear and the second peak indicates that the synchronizer is synchronizing the driven parts to realize synchronization. The presynchronizing phase is between the first and the second peak. The synchronizer ring and the synchronizer hub come into contact and work in the presynchronizing phase. When the driving and driven parts realize synchronization, the force on gear shift lever drops quickly. Then the synchronizer sleeve moves on and engages with the synchronizer hub, and the last peak (shown in Figure 4(a)) generates.
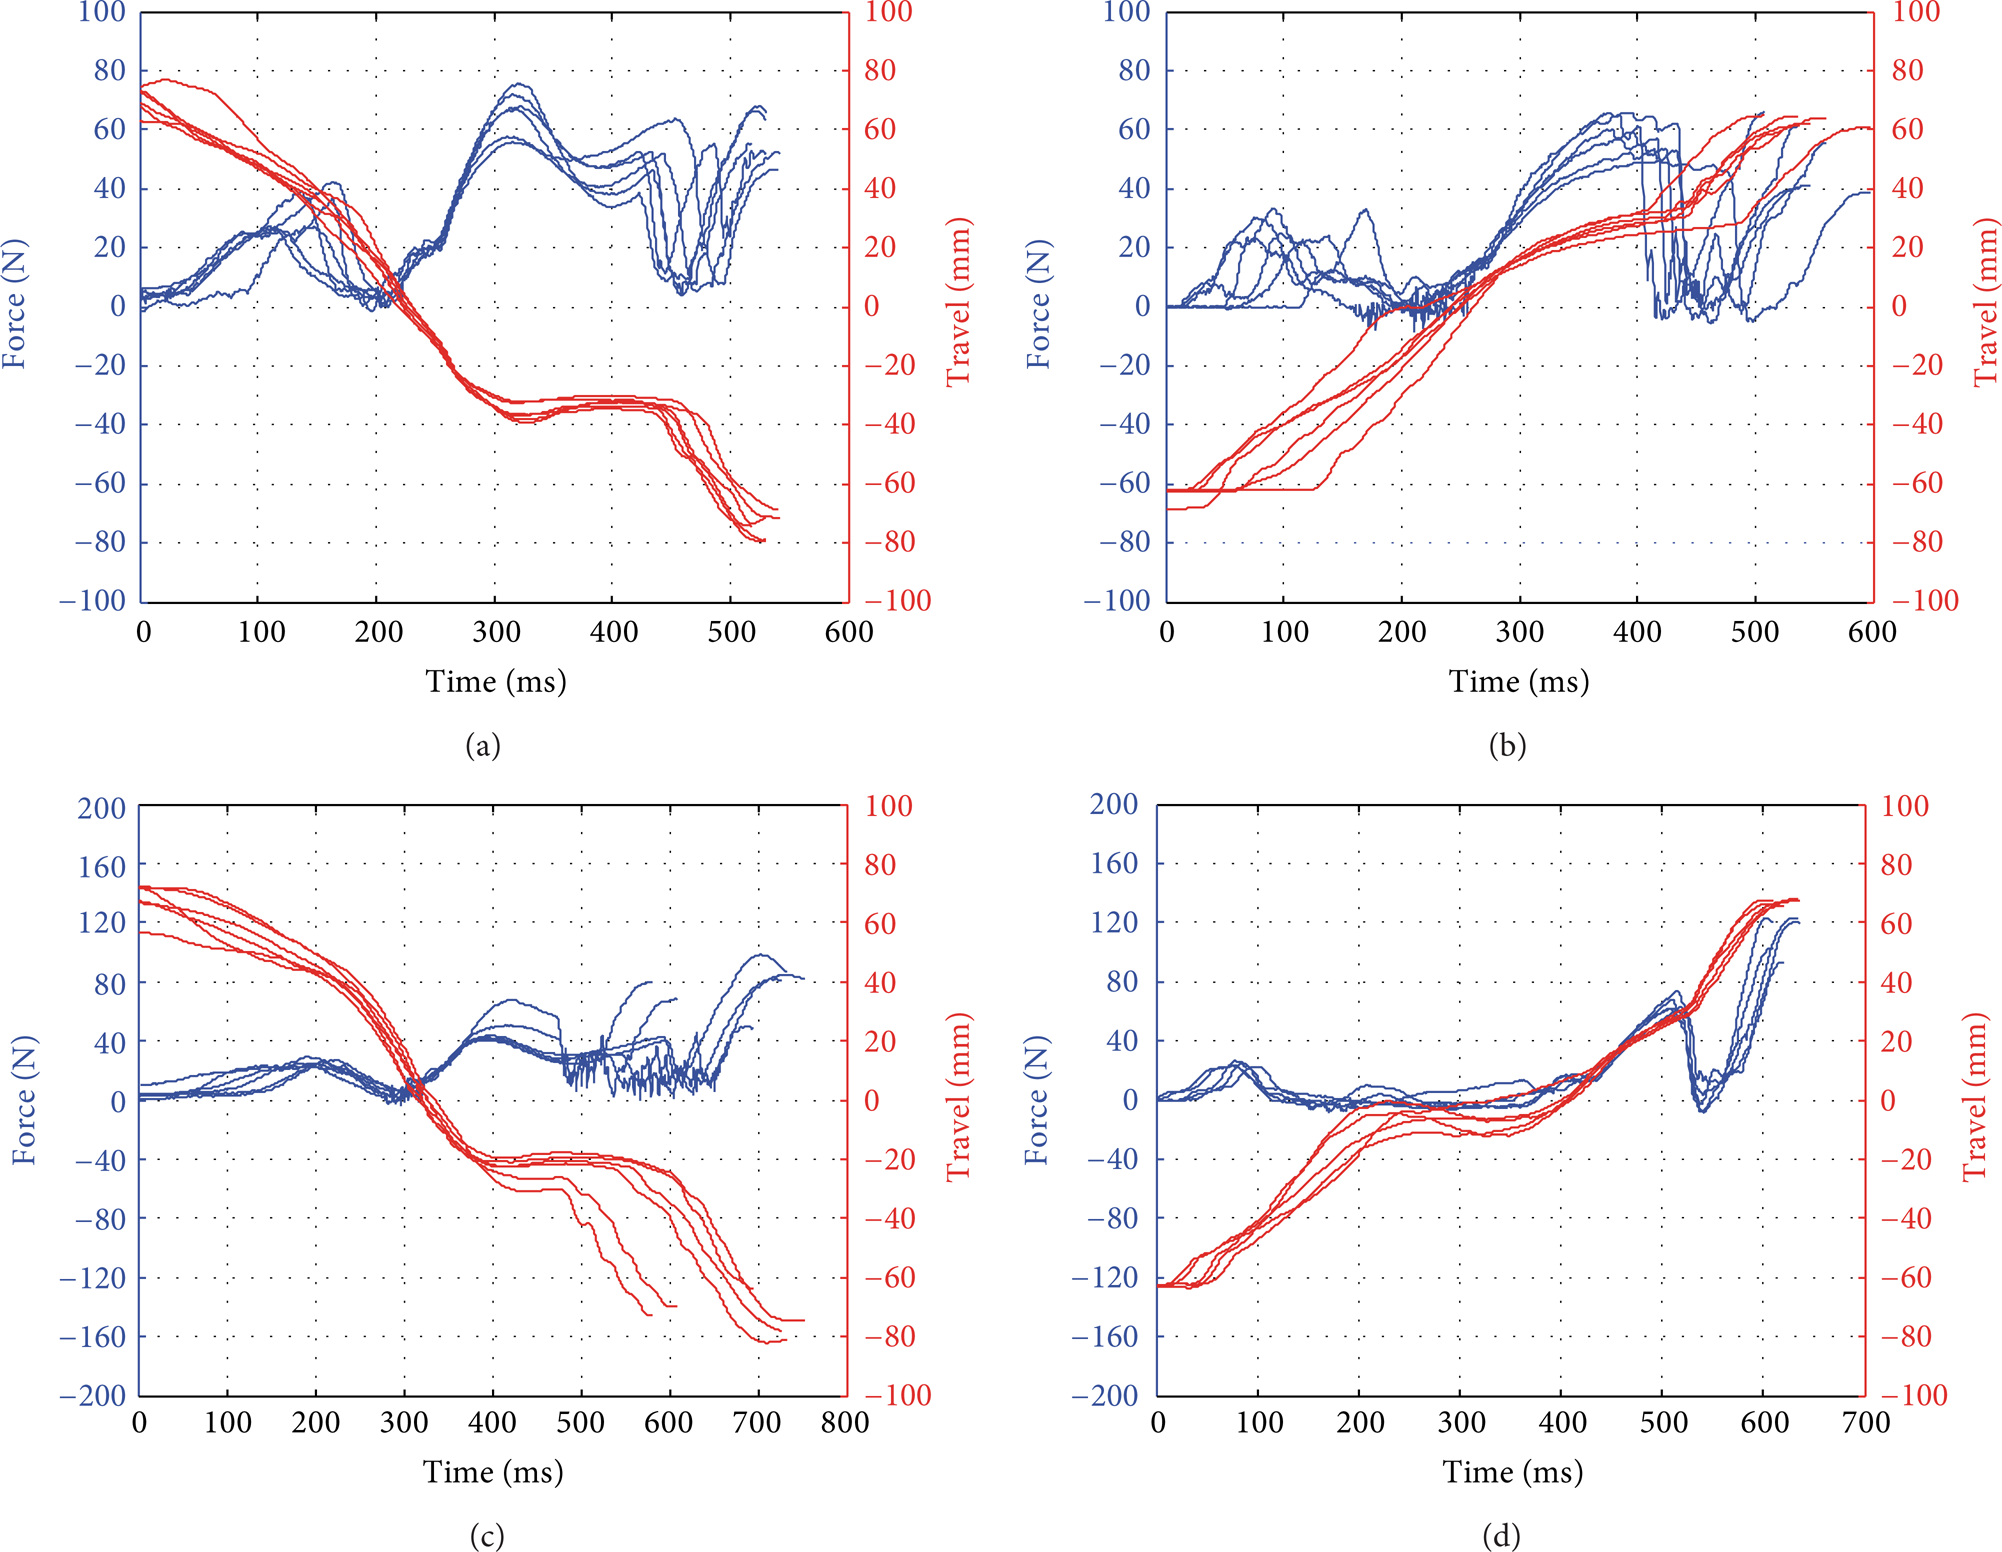
Curves of GSQA test when shifting up gear: (a) dynamic 1–2, (b) dynamic 2–3, (c) dynamic 3–4, and (d) dynamic 4–5.

Curves of GSQA test when shifting down gear: (a) dynamic 2-1, (b) dynamic 3-2, (c) dynamic 4-3, and (d) dynamic 5-4.
According to the GSQA test results, the end travels of the gear shift lever are shown in Figures 6 and 7; the forces on the gear shift lever are shown in Figures 8 and 9. The travels are distributed in ± 54–82 mm region (negative value represents the travel in negative X direction shown in Figure 1). The travel of the gear shift lever is decided by the gear shift mechanism and the stroke of the sliding bloke inside of the gearbox. It depicts that the shift forces when shifting down from the 2nd gear to the 1st gear and from the 3rd gear to the 2nd gear are significantly larger than other shifting groups in Figures 8 and 9. The shift force when shifting down from the 4th gear to the 3rd gear is the smallest.

Travel of gear shift lever when shifting up.

Travel of gear shift lever when shifting down.

Force of gear shift lever when shifting up.

Force of gear shift lever when shifting down.
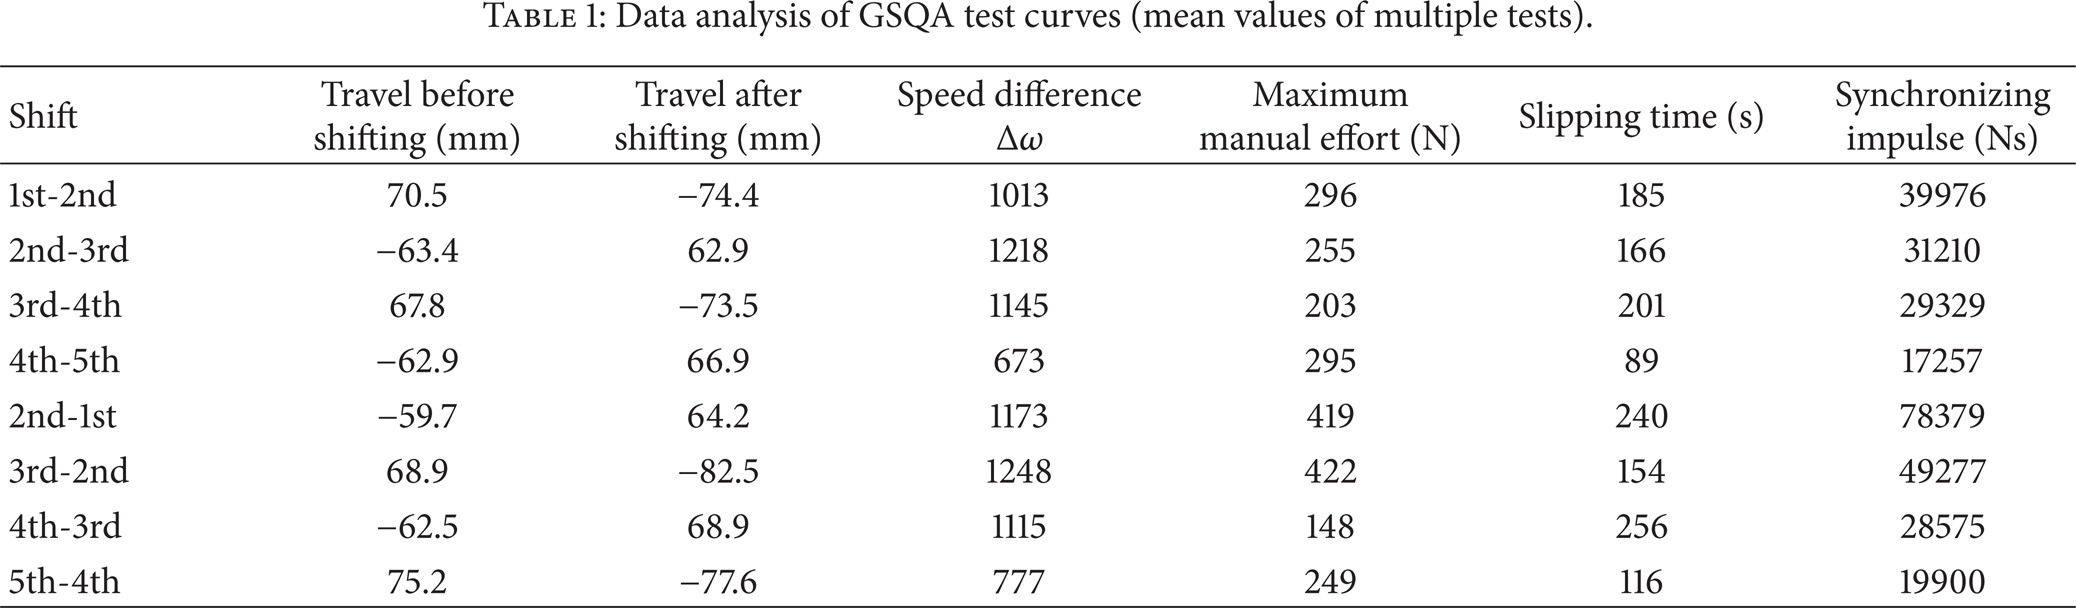
The mean values of each group of GSQA test are shown in Table 1 which contains travel of the gear shift lever, rotational speed difference, synchronizing force, slipping time, and synchronizing impulse. Because the difference between adjacent gear ratio and the moment of inertias of the 1st and the 2nd gear is larger, the two maximum values of the shift force occurred when shifting down from the 3rd gear to the 2nd gear as well as from the 2nd gear to the 1st gear. For this reason, the synchronizing impulses are larger than other groups of test corresponding test when shifting down from the 3rd to the 2nd as well as from the 2nd to the 1st.
Data analysis of GSQA test curves (mean values of multiple tests).
The standard values [6] of shift force on gear shift lever FH,perm and slipping time tR,perm (the rotational speed of the synchronizer ring and the synchronizer hub are different) are shown in Table 2. In terms of passenger car, FH,perm should be smaller than 120 N; otherwise it is hard to shift gear, and tR,perm should be shorter than 0.25's; otherwise it takes uncomfortable feeling when gear shifting.
Standard values for acceptable manual effort FH,perm and slipping time tR,perm.
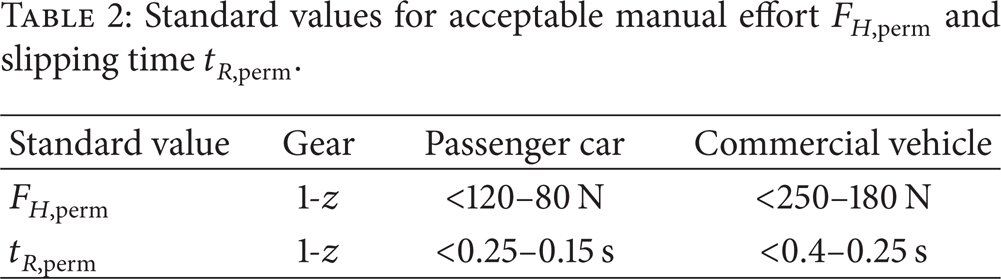
Figure 10(a) is the comparison of shift force and shift time of each gear in GSQA test. It can be seen that the shift force of lower gear is obviously larger than the shift force of higher gear. The average shift force is 82 N, 83 N, 29 N, and 40 N when shifting 2nd-1st, 3rd-2nd, 4th-3rd, 3rd–4th, respectively. The shift force is inversely proportional to the shift time. When downshifting form the 4th gear to the 3rd gear, the slipping time is 0.256's, exceeding 0.25's (the standard value) a little bit, but the manual effort is 29 N, there is adequate safety allowance. Figure 10(b) depicts that the shifting impulse of the 1st gear is significantly larger than the other gears. This is the reason why the shift force and shift time are very close to the standard values when shifting from the 2nd gear to the 1st gear. They may not meet the standard values in critical condition. The moment of inertias of the 1st gear and the 2nd gear are much larger than higher gears. The parameters of shift force, moments of inertias, slipping time, and speed difference mutually influence each other and finally decide the shift performance.

Summary of GSQA test curves.
3. Mathematical Models of the Transmission
The gear shift mechanism is used to transmit and transform the travel and force from the gear shift lever to the synchronizer sleeve. The synchronizer is used to realize synchronization by the friction parts. According to the kinematic and dynamic relations of transmission parts, the mathematical models of the transmission are developed in MATLAB. The mathematical models of the transmission contain the model of the gear shift mechanism and the model of the synchronizer. The former model can simulate the working process of the gear shift mechanism and finally draw the travel map of the gear shift lever based on the parameter of the transmission. The latter is used to calculate the performance of the synchronizer and describe the relationship between the design parameters of transmission and the performance of the synchronizer, such as the influence of friction coefficient and synchronizer cone radius on the synchronizer slipping time.
3.1. Model of Gear Shift Mechanism
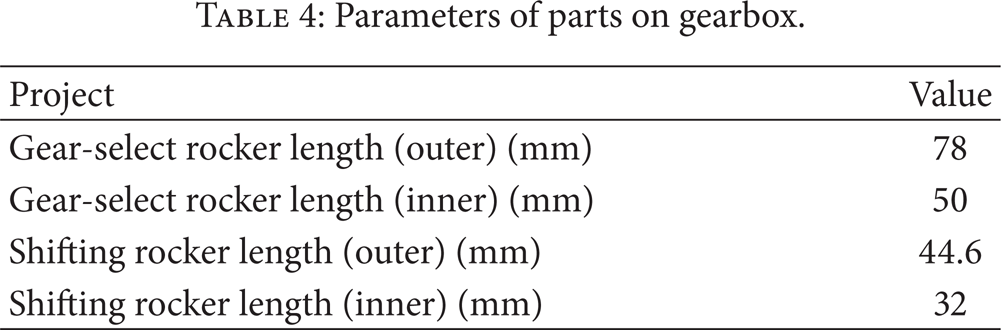
In this work, the transmission is equipped with five forward gears and one reverse gear. The final position of each gear is shown in Figure 11. The gear shift mechanism is an interface between the driver and vehicle. As the travel and force of the gear shift lever influence perceived comfort, these two factors are chosen as investigated objects in this work. In order to develop the mathematical model of the gear shift mechanism, the dimension chain of parts inside of the transmission and the dimension chain of gear shift mechanism must be clarified first. The stroke of the sliding block (Table 5) constrains the travel of the gear shift lever. The lever ratio of the gear shift mechanism is decided by the kinematic and dynamic relations of the transmission parts. It is noticeable that there are several connection joints on the gear shift mechanism; their structures determine the motion of the gear shifting process. The gear shifting process can be decomposed into three interrelated motions of components: (a) gear shift lever rotates around the rotation center in the selecting travel; (b) the linkage plate rotates around the spindle; (c) gear shift lever rotates around the linkage rod in the shifting travel. Figure 12 is the schematic diagram of the gear shift mechanism which demonstrates the model of gear shift mechanism. Table 3 shows the design parameters of parts of gear shift mechanism and Table 4 shows the design parameters of parts on gearbox. The data in Tables 3 and 4 show the input data which are used to construct the travel map of the gear shift lever and calculate the lever ratio of the gear shift mechanism.
Parameters of parts on gear shift mechanism.

Parameters of parts on gearbox.
Strokes of the sliding block inside of gearbox.


Gear distribution diagram of the transmission.
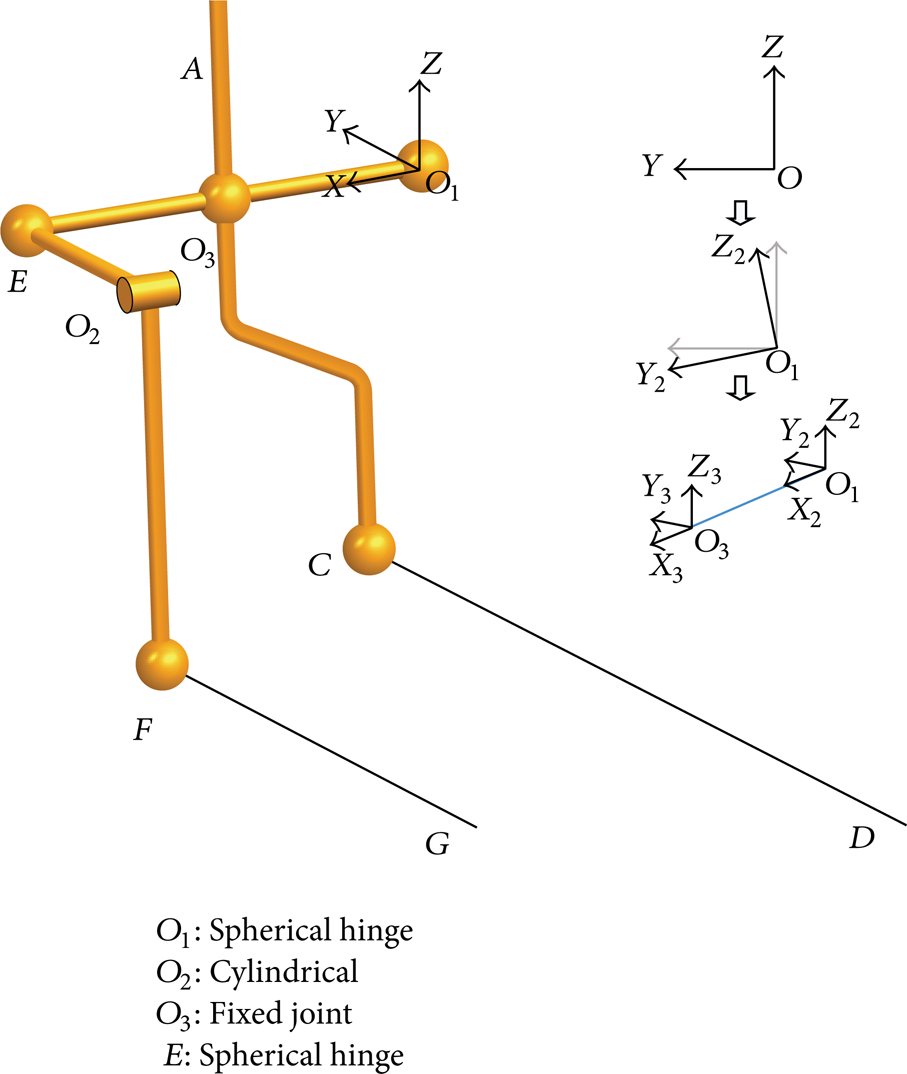
Schematic diagram of the gear shifting mechanism.
Figure 13 shows the schematic diagram of the gear shift mechanism's mathematical model. The travel map of gear shift lever can be derived from the strokes of the sliding block inside of the gearbox. The length of FG and CD (Figure 12) are obtained by sliding block strokes first. Then the selecting travel and shift travel are obtained by coordinate transformation and iterative computing which need to meet the length of FG and CD.

Schematic diagram of the gear shift mechanism model.
According to the coordinate transformation, the variation of the transmission cable length is shown in (2), where l0 is the mounted length of the selection cable and θ is the rotational angle of the linkage plate:

Because of the linkage plate and connecting rod (EO1 in Figure 12) connected by spherical hinge at point E, the movements of the two parts are dependent and the two parts have the same displacement at point E. After turning θ degree, the coordinate of point E is

The movement of point E in X-direction makes linkage rod rotate around the Z axle and the movement of point E in Y-direction makes gear shift lever rotate around the X axle. The coordinate transformation is shown in Figure 12. O1 is set as the coordinate origin of coordinate system XYZ and O2 is set as the coordinate origin of coordinates X21Y21 (plane coordinate system). The rotation of the linkage plate makes the coordinate system XYZ rotate around O1 and become a new coordinate system X2Y2Z2. By offsetting the origin of coordinates from O1 to O3, a new coordinate system X3Y3Z3 is generated.
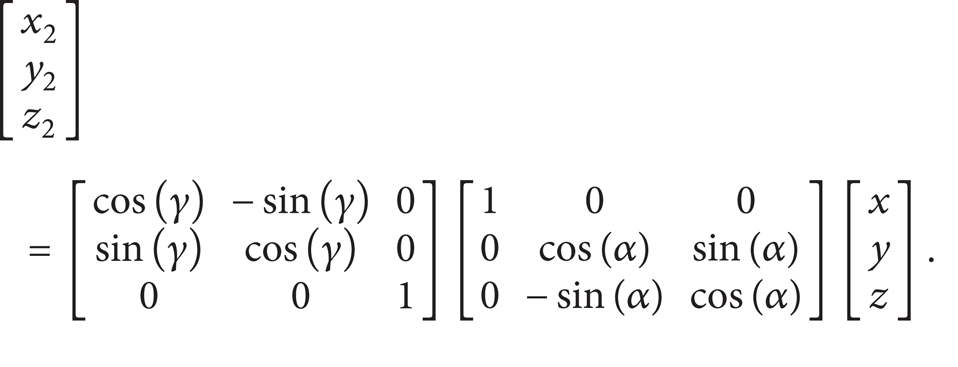
The rotation of the linkage plate around O2 can cause the linkage rod to rotate around O1. The coordinate transformation of XYZ caused by the linkage rod rotating can be decomposed into rotating around the X-axis and the Z-axis, respectively. If the X-axis and Z-axis rotational angles of linkage rod are α and γ, respectively, the corresponding coordinate transformation equation is

If
Then,

where R1 and R2 represent the points in O1XYZ coordinate system and O2X2Y2Z2 coordinate system, respectively, and X(α) is the transformation matrix when the XYZ coordinate system rotates α degree around X-axis and Z(γ) is the transformation matrix when the XYZ coordinate system rotates γ degree around Z-axis.
By the previous analysis, we know that the gear shift mechanism transmits the driver's movement to the sliding block. Then the movement is transmitted to the synchronizer sleeve by the shift fork. The sliding block inside the gearbox is a critical control point. Its strokes constrain the motion range of the gear shift lever. The strokes of the sliding block are shown in Table 5.
According to the design parameters of the gear shift sliding block and the dimension chain of the gear shift mechanism, the travel map of the gear shift lever is drawn in Figure 14. The selecting travel and the shifting travel of the gear shift lever are constituted by the horizontal lines and vertical lines, respectively. The ideal travel of the gear shift lever is shown in Figure 11. The fillet route of the vertical and horizontal curves shows the function of the bevels [7]. There are bevels in the travel when shifting to the 2nd gear and the 5th gear, which help gear shifting such as upshift from the 2nd gear to the 3rd gear and downshift from the 3rd gear to the 2nd gear; it is the same as when upshifting from the 4th gear to the 5th gear and downshifting from the 5th gear to the 4th gear. The passage width of the selecting travel of the gear shift lever is 8.4 mm. In term of shifting stoke, the average shifting passage width of the 1st, the 2nd, and the 5th gear is 4.8 mm; the passage width of the 3rd and the 4th gear is 9.6 mm. Because the passage width of the 1st, the 2nd, and the 5th gear is too narrow, there is uncomfortable feeling when shifting to these gears. The transition line angle of the 1st, the 3rd, the 4th, or the 5th gear is right angle; this takes stuck feeling when gear shifting.

Gear shift travel curve of ball on shift lever.
3.2. Model of Synchronizer
In order to make effective and comprehensive evaluation and analysis on shifting performance of synchronizer, the relationship between the shifting performance and the parameter of the synchronizer and the relationship between synchronization force and slipping time are investigated by the mathematical model of the synchronizer. Figure 15 shows the schematic diagram of the synchronizer model. The model is created according to the parameter of the synchronizer and the GSQA test results. In this model, the performance of synchronizer mainly contains synchronizing time, synchronizing force, and synchronizing power. The relationship between the parameters of the synchronizer and the force against slipping time curve in the condition of rotational speed difference Δω can be obtained by the model of the synchronizer. Finally, the synchronizing time, synchronizer force, and synchronizing power can be obtained by the force-slipping time curve.

Schematic diagram of the synchronizer.
3.2.1. Theorem of Momentum Moment
Figure 16 shows the working principle of the synchronizer. There is a rotational speed difference between the input end and the output end before the synchronizer completes synchronization. The moment of inertia of the input end and the output end are, respectively, J1 and J2. As the synchronizer output end is connected to the wheels (J2 ≫ J1), the rotational speed of the output end is regarded as a constant when synchronizing. The synchronizer ring moves forward to the synchronizer hub; then the friction torque is generated between the synchronizer ring and the cone on hub when they contact with each other. The slipping time required for the synchronization is obtained when ω1 increases to or decreases to ω2.

Working principle of the synchronizer.
According to the theorem of momentum moment,

In the equation: J1 is the moment of inertia of the parts at the synchronizer input end (kg·mm2), J2 is the moment of inertia of the vehicle (kg·mm2) (J2 ≫ J1), ω1 is the angular velocity of the parts at the input end (1/s), ω2 is the angular velocity of the parts at the output end (1/s) (be regarded as a constant), t is the synchronization time (s), and T c is the friction torque between working surfaces of the synchronizer (synchronizing torque) (103 kg·mm2/s2 = N·mm).
When synchronizing, the friction torque between the cone surfaces is

In the equation: Fα is gear shift force (N), μ c is friction coefficient between the cone surfaces, R c is effective radius of cone (mm), and φ is cone angle.
The rotational speed difference is derived from (7) and (8):

The gears or synchronizers are mounted on respective shafts of the gearbox and rotate at different speeds. The synchronizers of the 1st gear and the 2nd gear are mounted on the lay shaft. The synchronizers of the 3rd, 4th, and 5th are mounted on the input shaft. When gear shifting, the inertias of the components which need to be synchronized are transmitted onto the shaft of corresponding synchronizer according to the gear ratios.
The equation of the masses conversion is as follows:

In (10), J R is the moment of inertia after conversion, J j is the moment of inertia before conversion, Z1 is the teeth number of the gear transmitted onto, and Z2 is the teeth number of the gear need to be transmitted.
Table 6 shows the design parameters of synchronizer. The moment of inertia of each gear is calculated by (10). The other parameters such as μ c , R c , and φ are derived from the design value of the transmission.
Parameters of synchronizer.

Shifting impulse is the product of the synchronizing force and the slipping time. It is the key parameter to evaluate the performance of the synchronizer which is shown in (11):

In (11), S is shifting impulse, ts is slipping time, and F s is synchronizing force on synchronizer sleeve.
The synchronizing force of the synchronizer is converted by the following equation:

In (12), F s is synchronizing force, F h is shifting force of gear shift lever, F m is resistance of self-locking and interlocking springs, 40 N, im is lever ratio of gear shift mechanism, 5.47, and ε is load efficiency of the gear shift mechanism, 0.75.
3.2.2. Curve Fitting
Figure 17 depicts one test curve when shifting from the 1st gear to the 2nd gear. The solid curve depicts the shifting force curve against shifting time. The dash dot curve depicts the travel curve of gear shift lever against shifting time. In order to obtain the force of the synchronizer sleeve against the slipping time, the GSQA test curves are split into five intervals according to the working condition of the synchronizer. They are as follows: A1, disengagement and neutral; A2, neutral detent and presynchronization; A3, synchronizing and synchronization; A4, blocking release; A5, engagement tooth contact to full engagement. The intervals of A2 and A3 are called slipping time. The synchronizer ring contacts with the cone on synchronizer hub during the slipping time and there is a rotational speed difference between them. In the interval of A2, the force is increasing rapidly as the gear shift lever moves on; it pushes synchronizer ring moves axially and contacts with the cone of hub. In the interval of A3, the travel curve of gear shift lever is approximately flat and the shifting force reduces but maintains at a certain level. The friction between the synchronizer and the cone is decided by the axial synchronizing force during the interval of A3.

Curve of GSQA test when the transmission shifts from 1st to 2nd gear.
The curve of the synchronizing force F s can be got according to (12), by multiplying the curve of the shifting force F h and lever ratio of gear shift mechanism together. The equation of the synchronizing force can be constructed by the GSQA test data because the curves have similar pattern. Firstly, two quadratic polynomials are introduced to draw the curves of the synchronizing force. According to the working condition of the synchronizer, maximum synchronizing force F max , presynchronization time ts1, and synchronization time ts2 are used as the polynomial variables. F max determines the peak-value of F s ; ts1 and ts2 determine the pattern of the synchronizing force curve. Secondly, the polynomial coefficients are obtained by least square fitting in MATLAB according to the GSQA test data. The fitted equation of F s is shown in (13). The three control variables are used to describe the shifting action of the driver. The coefficients of a, b, and c are used to describe the variation tendency of the synchronizing process:

In (13), F max is maximum synchronizing force, t is time, ts1 is presynchronization time, ts2 is synchronizing time, a, b, c are coefficients.
According to the fitted results, the coefficients a, b, and c are 1.3, 0.7, and 0.6, respectively, when gear shifts 1st–2nd, 2nd-1st, 2nd–3rd, 3rd-2nd and 3rd–4th. The coefficients a, b, and c are 1.0, 0.7, and 0.6, respectively when gear shifts 4th–5th and 5th-4th. Figure 18 shows the comparisons of test curve and fitted curve; the solid curves are GSQA test curves, and the dashed curves are fitted curves. Figure 18(a) describes fitted curve of shifting up from the 1st to the 2nd gear and Figure 18(b) describes fitted curve of shifting down from the 5th to the 4th gear. Figure 18(a) represents the curve with the coefficients: a = 1.3, b = 0.7, and c = 0.6, and Figure 18(b) represents the curve with the coefficient: a = 1.0, b = 0.7, and c = 0.6. It can be seen that the fitted curves are consistent with the test curves.

Test curve fitting.
4. Model Validation and Analysis
4.1. Validation of Gear Shift Mechanism Model
Figure 19 shows the distributions of end travels in the travel map. The horizontal lines and vertical lines construct the travel map of the gear shift lever. The travel map depicts the path of the gear shift lever when shifting to each gear. The green point “·” shown in Figure 19 is drawn by iterative algorithm. The “·” and the vertical lines surround the end travel area of gear shift lever. When the transmission completes gear shift, the end travels of the gear shift lever should fall in the area mentioned before. According to the GSQA test data, the test end travels of the gear shift lever are shown as “*” in Figure 19. It can be seen that all the end travels of test data fall into the range of the model's travel map. This illustrates that theoretical calculated results are consistent with the actual GSQA test results and the mathematical model is reliable.

The distributions of gearshift end travels in travel map.
4.2. Validation of Synchronizer Model
Synchronizing impulse (S) can be used to evaluate the synchronizing performance. Shift-feel is closely related to synchronizing impulse. In order to validate the synchronizer model, S is calculated and shown in Tables 7 and 8 according to the GSQA test data and (13). Tables 7 and 8 contain the percentage error of the synchronizing impulse when shifting up and shifting down, respectively. The percentage error of S is also shown in Figures 20 and 21 in order to show it directly. It depicts that the percentage error is smaller than 10% in most cases though S is different in each test. This illustrates that the mathematic model of the synchronizer is reasonable in the condition of shift force changing. Because the gear shift was a random process, the fitted curve generated by the synchronizer model can fully reflect the synchronizing force against the slipping time.
Percentage error analysis of synchronizing impulse (shift up).

Percentage error analysis of synchronizing impulse (shift down).


Percentage error of synchronizing impulse (shift up).

Percentage error of synchronizing impulse (shift down).
4.3. Transmission Performance Analysis
According to (13), the rotational speed difference-slipping time curves of the transmission can be obtained. Figure 22 shows the relationship between slipping time and speed difference in different shift force when gear shifting. In Figure 22(a), the curves are shown as red, green, and blue, respectively, when shifting to the 1st, the 2nd, and the 3rd gear. The curves are shown as black when shifting to the 4th and the 5th gear. The five lines from right to left in each group represent the shifting force from 60 N to 80 N. Figure 22(a) depicts the potential problem (slipping time could not meet the standard value) when shifting from the 2nd to the 1st gear. Referring to shift from the 2nd to the 1st gear, Figure 22(b) depicts that the efforts of gear shift lever are 50–120 N with an interval of 10 N. The force on gear shift lever is at least 100 N and it can meet the requirement of slipping time (0.25's) when the rotational speed difference is 1500 r/min. To some extent, there is uncomfortable feeling when shifting from 2nd gear to 1st gear in critical condition.

Synchronizing force, speed difference, and shift time curve.
4.3.1. Effect of Friction Coefficient
There are several ways to improve the performance of the transmission. Figure 23 depicts the relationship between the friction coefficient and force-time curve of 1st gear synchronizer when the rotational speed difference is 1500 r/min. To meet the requirement of slipping time, the shift force should be no less than 96 N when the friction coefficient is 0.08 and the shift force is no less than 65 N when the friction coefficient is 0.12. Increasing the friction coefficient can significantly improve the performance of synchronizer.

The influence friction coefficient to the synchronizing performance (2nd-1st).
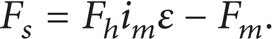
4.3.2. Effect of Average Radius of Tapered Surface
The friction is generated by the synchronizer ring and cone of hub when synchronizing. The average radius of tapered surface can affect the friction area of the synchronizer. Figure 24 depicts the effect of the average radius of tapered surface on the synchrionzing performance when shifting from the 2nd to the 1st gear. As the slipping time is 250 ms, the shift force is decreasing from 78 N to 60 N when the radius is inceasing from 26.51 mm to 34.51 mm. Because the average raidus of tapered surface is constained by the dimension of the transmission, the effect of the average raidus is limted by the dimension.
The influence of average radius of tapered surface to the synchronizing performance (2nd-1st).
4.3.3. Effect of Moment of Inertia
The moment of inertia of the 1st gear is 13787 kg·mm2. If the rotational speed difference (Δω) is 1500 r/min, the force-time curves (Figure 25) from right to left are corresponding to 100%–80% of the design moment of inertia (13787 kg·mm2). The shift force is 78 N when the moment of inertia is 100% and slipping time is 250 ms. The shift force is 62 N when the moment of inertia is 80% and slipping time is 250 ms. Decreasing the moment of inertia is an effective method to improve the performance of the transmission.

The influence of moment of inertia to the synchronizing performance (2nd-1st).
5. Conclusion
This study investigated the effects on shifting performance of the design parameters of the synchronizer and gear shift mechanism with the aim of estimating the characters and performance of the MPV's transmission. The mathematic model of the gear shift mechanism was developed in MATLAB to draw and analysis the travel map of the gear shift lever. The mathematical model of the synchronizer was developed to descript the force-time curve when synchronizing and analysis the influence of the design parameters on the performance of the MPV's transmission.
According to the test results obtained from GSQA, the manual effort and slipping time met the requirements of the standard values. However, there were some problems when the transmission shifts down from the 2nd to the 1st gear with large rotational speed difference.
The travel map of the gear shift lever was obtained according to the mathematic model of the gear shift mechanism. By comparing the travel map and the GSQA test data, all of end travel of gear shift lever obtained by GSQA fell into the range calculated by the mathematical model. The theoretical calculated results were consistent with the actual GSQA test results and the mathematical model was reliable.
The mathematical model of the synchronizer was developed by curve fitting according to the GSQA test data. In each GSQA test group, the mean deviation of synchronizer impulse was less than 10%. Because the gear shift was a random process, the fitting curve generated by the synchronizer model could reflect force performance of the transmission in gear shifting process.
According to the model of the synchronizer, the relationship between the design parameters and transmission performance was obtained. Increasing the friction coefficient between the synchronizer ring and the cone of synchronizer hub, decreasing the average radius of tapered surface, and decreasing the moment of inertias of the 1st gear were effective methods to improve the performance of the transmission.
Conflict of Interests
The authors declare that there is no conflict of interests regarding the publication of this paper.