
Abstract
In China, unsignalized crosswalks lead to the increasing ofconflicts between vehicles and crossing pedestrians. In this paper, the relationships of risks perceived by drivers, crossing pedestrians, and vehicle speed were revealed through a decision-making risk experiment. The model of collision risk probability was established by using probability theory. Then the strategy spaces, the payoff function, and payoff matrix were given. The model of dynamic noncooperative game between the drivers and crossing pedestrians was established. In addition, the equilibrium solutions of the model were analyzed as well. The results of analysis shows that the crossing state is the best decision for pedestrians and drivers should keep uniform speed or accelerate when vehicle speed is low. At medium speed, there is no clear difference between waiting and crossing state for pedestrians. Actually, the crossing state is better than waiting state. For drivers, there is no evident difference among acceleration, deceleration, and keeping uniform speed of vehicles, but the better choice is keeping uniform speed of vehicles. At high speed, pedestrians should not cross because of there are high risks. Therefore, the best solution is that the drivers keep uniform speed of vehicles.
1. Introduction
With the acceleration of urbanization process and the continuous improvement of people's living standards, China's vehicle population is showing a trend of geometric growth. Among the existing pedestrian crossing facilities in China, unsignalized crosswalks occupy the most. Drivers are always self-centered without paying much attention to the crossing pedestrians when they cross the road, which leads to the increasing possibility of conflicts between vehicles and crossing pedestrians. Thus, the conflict between vehicles and crossing pedestrians has become one of the focuses in road traffic safety research field in China.
Game theory is usually adopted to study strategic decision-making. A game can be classified into two types by judging if the players are able to form binding commitments, that is, noncooperative and cooperative games. Static games take place when both players move simultaneously, or even if they do not move simultaneously, the latter player will be unaware of the former one's actions. Dynamic games happen when the latter player has had some knowledge about the former one's actions. From the possible collisions point of view, vehicle drivers and crossing pedestrians are competitive. Besides, the latter player considers the former's action. So, the noncooperative dynamic game theory can be used to build models and analyze their choices and behaviors.
Current relevant studies can be mainly divided into the following three aspects. The first aspect focuses on the risk of collisions between crossing pedestrians and vehicles. Davis found that the probability of collisions was correlated to the vehicle speed, and it could be taken as a method to assess road traffic safety [1]. Pasanen and Salmivaara pointed out that the mortality risk of pedestrians would become much higher when vehicle speed reached 50 km/h [2]. Ma and Andréasson predicted the effect of various ISA penetration grades on pedestrian safety by simulation [3].
The second aspect focuses on crossing pedestrian behaviors. Simpson et al. investigated the behavior of children and teenagers and found that age and vehicle speed influence crossing pedestrians’ acceptable intervals [4]. Tarawneh studied the crossing speeds of different pedestrian groups [5]. Keegana and Mahonyb concluded that the risk of crossing pedestrians collisions would increase when the traffic volume was high or the road was wide [6]. Moyano Díaz found that the tolerable time for crossing pedestrians was ranged from 45 s to 60 s [7]. Himanen and Kulmala proposed some factors which can influence pedestrian actions. These factors include the number of waiting pedestrians, vehicle speed, and road width [8]. Tiwari et al. pointed out that the tolerable waiting time for crossing men was shorter than that time for crossing women and the crossing probability changed with pedestrians waiting time [9]. Sisiopiku and Akin found that pedestrians preferred crossing facilities without signals [10]. Hamed analyzed the impact of the number of pedestrians and their ages on risk of crossing pedestrians [11]. Dhillon et al. assessed hospital and police ascertainment of automobile versus childhood pedestrian and bicyclist collisions [12]. Rosenbloom et al.'s study showed that the difference in religious belief and ideology would lead to different crossing behaviors [13]. Beum studied the collisions between right-turning vehicles and crossing pedestrians [14]. Hatfield and Murphy studied the influence of cell-phone on the pedestrians and they suggested that the pedestrians did not use cell-phone when they were crossing [15].
The third aspect focuses on the setting of pedestrian crossing facilities. King et al.'s study showed that reasonable settings of crossing facilities would cause 80% of vehicles to decelerate, and as a result, it might reduce the risk of collisions by 20% [16]. Ullman et al. proposed that reasonable setting of crossing facilities could ensure pedestrians’ safety as well as improving the traffic efficiency [17].
To sum up, the interaction of pedestrians and vehicle drivers is the cause of collision, and it is perfectly a game between pedestrians and vehicle drivers. However, there are few studies on this aspect by far. In Section 2, an experiment was designed to get characteristics of drivers and crossing pedestrians, so as to provide data for studying the collisions. Subsequently, Section 3 studied the actions of drivers and crossing pedestrians by introducing the game theory. Finally, a conclusion was made in Section 4.
2. Experiment
In this study, an experiment was designed in order to know the decisions of crossing pedestrians and drivers as well as the possible risks that they might confront corresponding to different vehicle speeds.
2.1. Experimental Assumptions
There are many factors that can affect the game between the crossing pedestrians and drivers. This study proposed the following assumptions to eliminate secondary factors and simplify the experiment.
(1) The participants were rational and chased most payoffs.
(2) In the condition of a group of crossing pedestrians, their actions were determined by the first pedestrian who was followed to cross.
(3) When the elderly, children, or the handicapped cross the road, they need more acceptable gaps, so this study mainly focused on healthy and young crossing pedestrians.
(4) According to relative studies, 85% of pedestrians feel dangerous and choose to wait rather than cross when vehicles are 10∼20 meters away. So the distance where the participants need to make a decision is considered 15 meters away from the crossing site.
2.2. Sample Size
According to formula (1), the minimum sample size was calculated to be 96:

where n is the minimum sample size, Z is confidence level of standard deviation, Z is 1.96 for 95% confidence limit, σ is variance, it describes the discrete degree, and E refers to the acceptable sampling error, ranging from 1% to 10%.
In this experiment, the sample size was equal to 120, so it was in line with the requirement.
2.3. Experimental Road and Vehicle
The traffic condition in centric area is too complex to eliminate interference of other factors. Therefore, the experimental area was chosen in Qunli area, a newly developed area of Harbin, China. Landscape Road in Qunli area, a straight and flat road with low traffic volume, was chosen as the experimental road.
This experimental road has not traffic signals and it is long enough for cars to accelerate or decelerate. There are three lanes on each side of the experimental road with the speed limit of 70 km/h. Therefore, the experimental road satisfied the experiment requirements well.
The experimental vehicle was a microbus with satisfactory performance of acceleration and barking.
2.4. Experimental Personnel
(1) Eight healthy and experienced drivers aging from 20 to 50 have participated in this experiment. These drivers could understand the experiment well and they were well prepared with enough sleep and no drinking.
(2) In the experiment, one recorder sat in the car beside the driver and recorded the vehicle speed and drivers and pedestrians decisions.
(3) Five healthy and agile volunteers were chosen as crossing pedestrians. When the vehicle approached the crossing site, the volunteers should decide whether to cross or to wait.
2.5. Experimental Time
This experiment was supposed to be done in the daytime. The pavement should be dry. It could not be affected by bad weather. The time was 08:00∼10:30 and 14:00∼16:30.
2.6. Experimental Procedure
(1) As shown in Figure 1, the experimental section with the length of 15 meters was chosen.

Diagram of the experiment.
(2) A pedestrian was asked to stand at the end of the experimental section. The speed of the driver entering into the section was predetermined to be v0.
(3) When the vehicle entered the experimental section, the driver made decisions to accelerate, decelerate, or keep uniform speed and the pedestrian made decisions to cross or wait, which would be recorded by the recorder.
(4) When the vehicle passed the experimental section, the recorder recorded the level of risk the driver perceived. The pedestrian recorded his perceived level of risk. The levels of risk were divided into five categories, including extremely dangerous, highly dangerous, commonly dangerous, slightly dangerous, and safe. They were denoted by 5, 4, 3, 2, and 1, respectively.
(5) Altering the predetermined speed v0 and repeating the steps (2), (3), and (4), v0 was taken as 20 km/h, 30 km/h, 40 km/h, 50 km/h, 60 km/h, and 70 km/h, respectively.
3. Results and Discussion
3.1. Concepts of the Game Model
When vehicle volume is high, the intervals between vehicles become small and pedestrians need to take a risk to cross the roads. In this way, the game between drivers and crossing pedestrians is formed. Assuming their number is i, i equals 1 when the participant is the driver, and i equals 2 when the participant is the pedestrian. The drivers can accelerate, decelerate, or keep uniform speed. A, D, and U denote drivers’ choice. Pedestrians can wait or cross. W, C denote pedestrians’ choice.
Assuming participants strategy set is S i , a specific strategy from S i is s i . Drivers strategy set is S1 = {A, D, U}. Pedestrians strategy set is S2 = {W, C}.
Assuming participants strategy profile space is (s i , …, s n ), there are 6 strategy profiles, that is, {(A, W), (A, C), (U, W), (U, C), (D, W), (D, C)}.
u i denotes the payoff function of participant i, and u i (s i , …, s n ) denotes the payoff when participant i chooses the strategy profile (s i , …, s n ).
3.2. Decision Behavior of Vehicle Drivers
3.2.1. Drivers Risk Perception and Decision
According to the experimental results, when the vehicle speed is less than 40 km/h, the driver's perceived risks are low. When the vehicle speed ranges from 40 km/h to 60 km/h, the driver's perceived risks will mainly be at commonly dangerous or highly dangerous level. When the vehicle speed is higher than 60 km/h, the drivers think it is extremely dangerous.
The results showed that about 64% of drivers chose to accelerate and the others kept uniform speed when the perceived risk was at safe or slightly dangerous level in condition of low speed.
About 35% of drivers chose to accelerate and the others kept uniform speed when the perceived risk was at commonly dangerous level. Most drivers did not choose to accelerate because the speed and risk increased.
At highly dangerous level, about 28% of drivers chose to accelerate and 72% kept uniform speed.
When the risk was high to be extremely dangerous, all drivers chose to decelerate.
3.2.2. A Collision Risk Probability Model
The collision area of vehicle A and pedestrian B is shown in Figure 2.

Collision between car A and pedestrian B.
In two cases, collisions will not happen. When vehicle A arrives, pedestrian B has already crossed the road. When vehicle A leaves, pedestrian B has not arrived. The two cases can be transformed as follows:

where D A is the distance between the vehicle and the edge of the collision area, m, D B is the distance between the pedestrian and the edge of the collision area, m, L A represents the length of car A, m, L B is the safe distance that pedestrian B needs to cross the road, m, W A refers to the width of vehicle A, m, W B is the transverse distance that pedestrian B needs to cross the road safely, m, V A means the average speed of the arriving vehicle A, m/s, and V B is the average speed of the arriving pedestrian B, m/s.
Then, collision risk probability P c is

The above two cases cannot happen at the same time, so they are mutually exclusive, and (3) can be transformed into
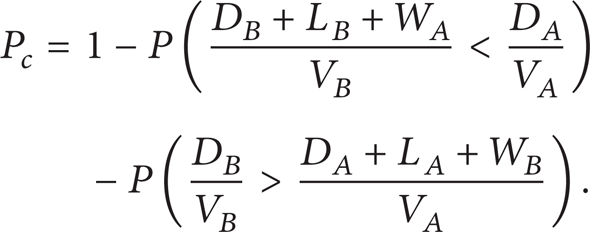
Let
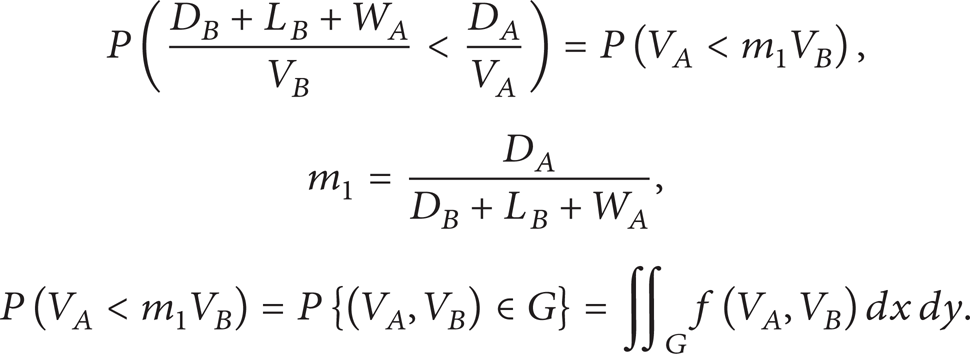
Assuming V A and V B obey uniform distribution, then

where f(V A ) is the density function of V A , f(V B ) is the density function of V B , G is enclosed by V A < m1V B and the range of V A , V B , and S G is the area of G and is expressed in Figure 3.
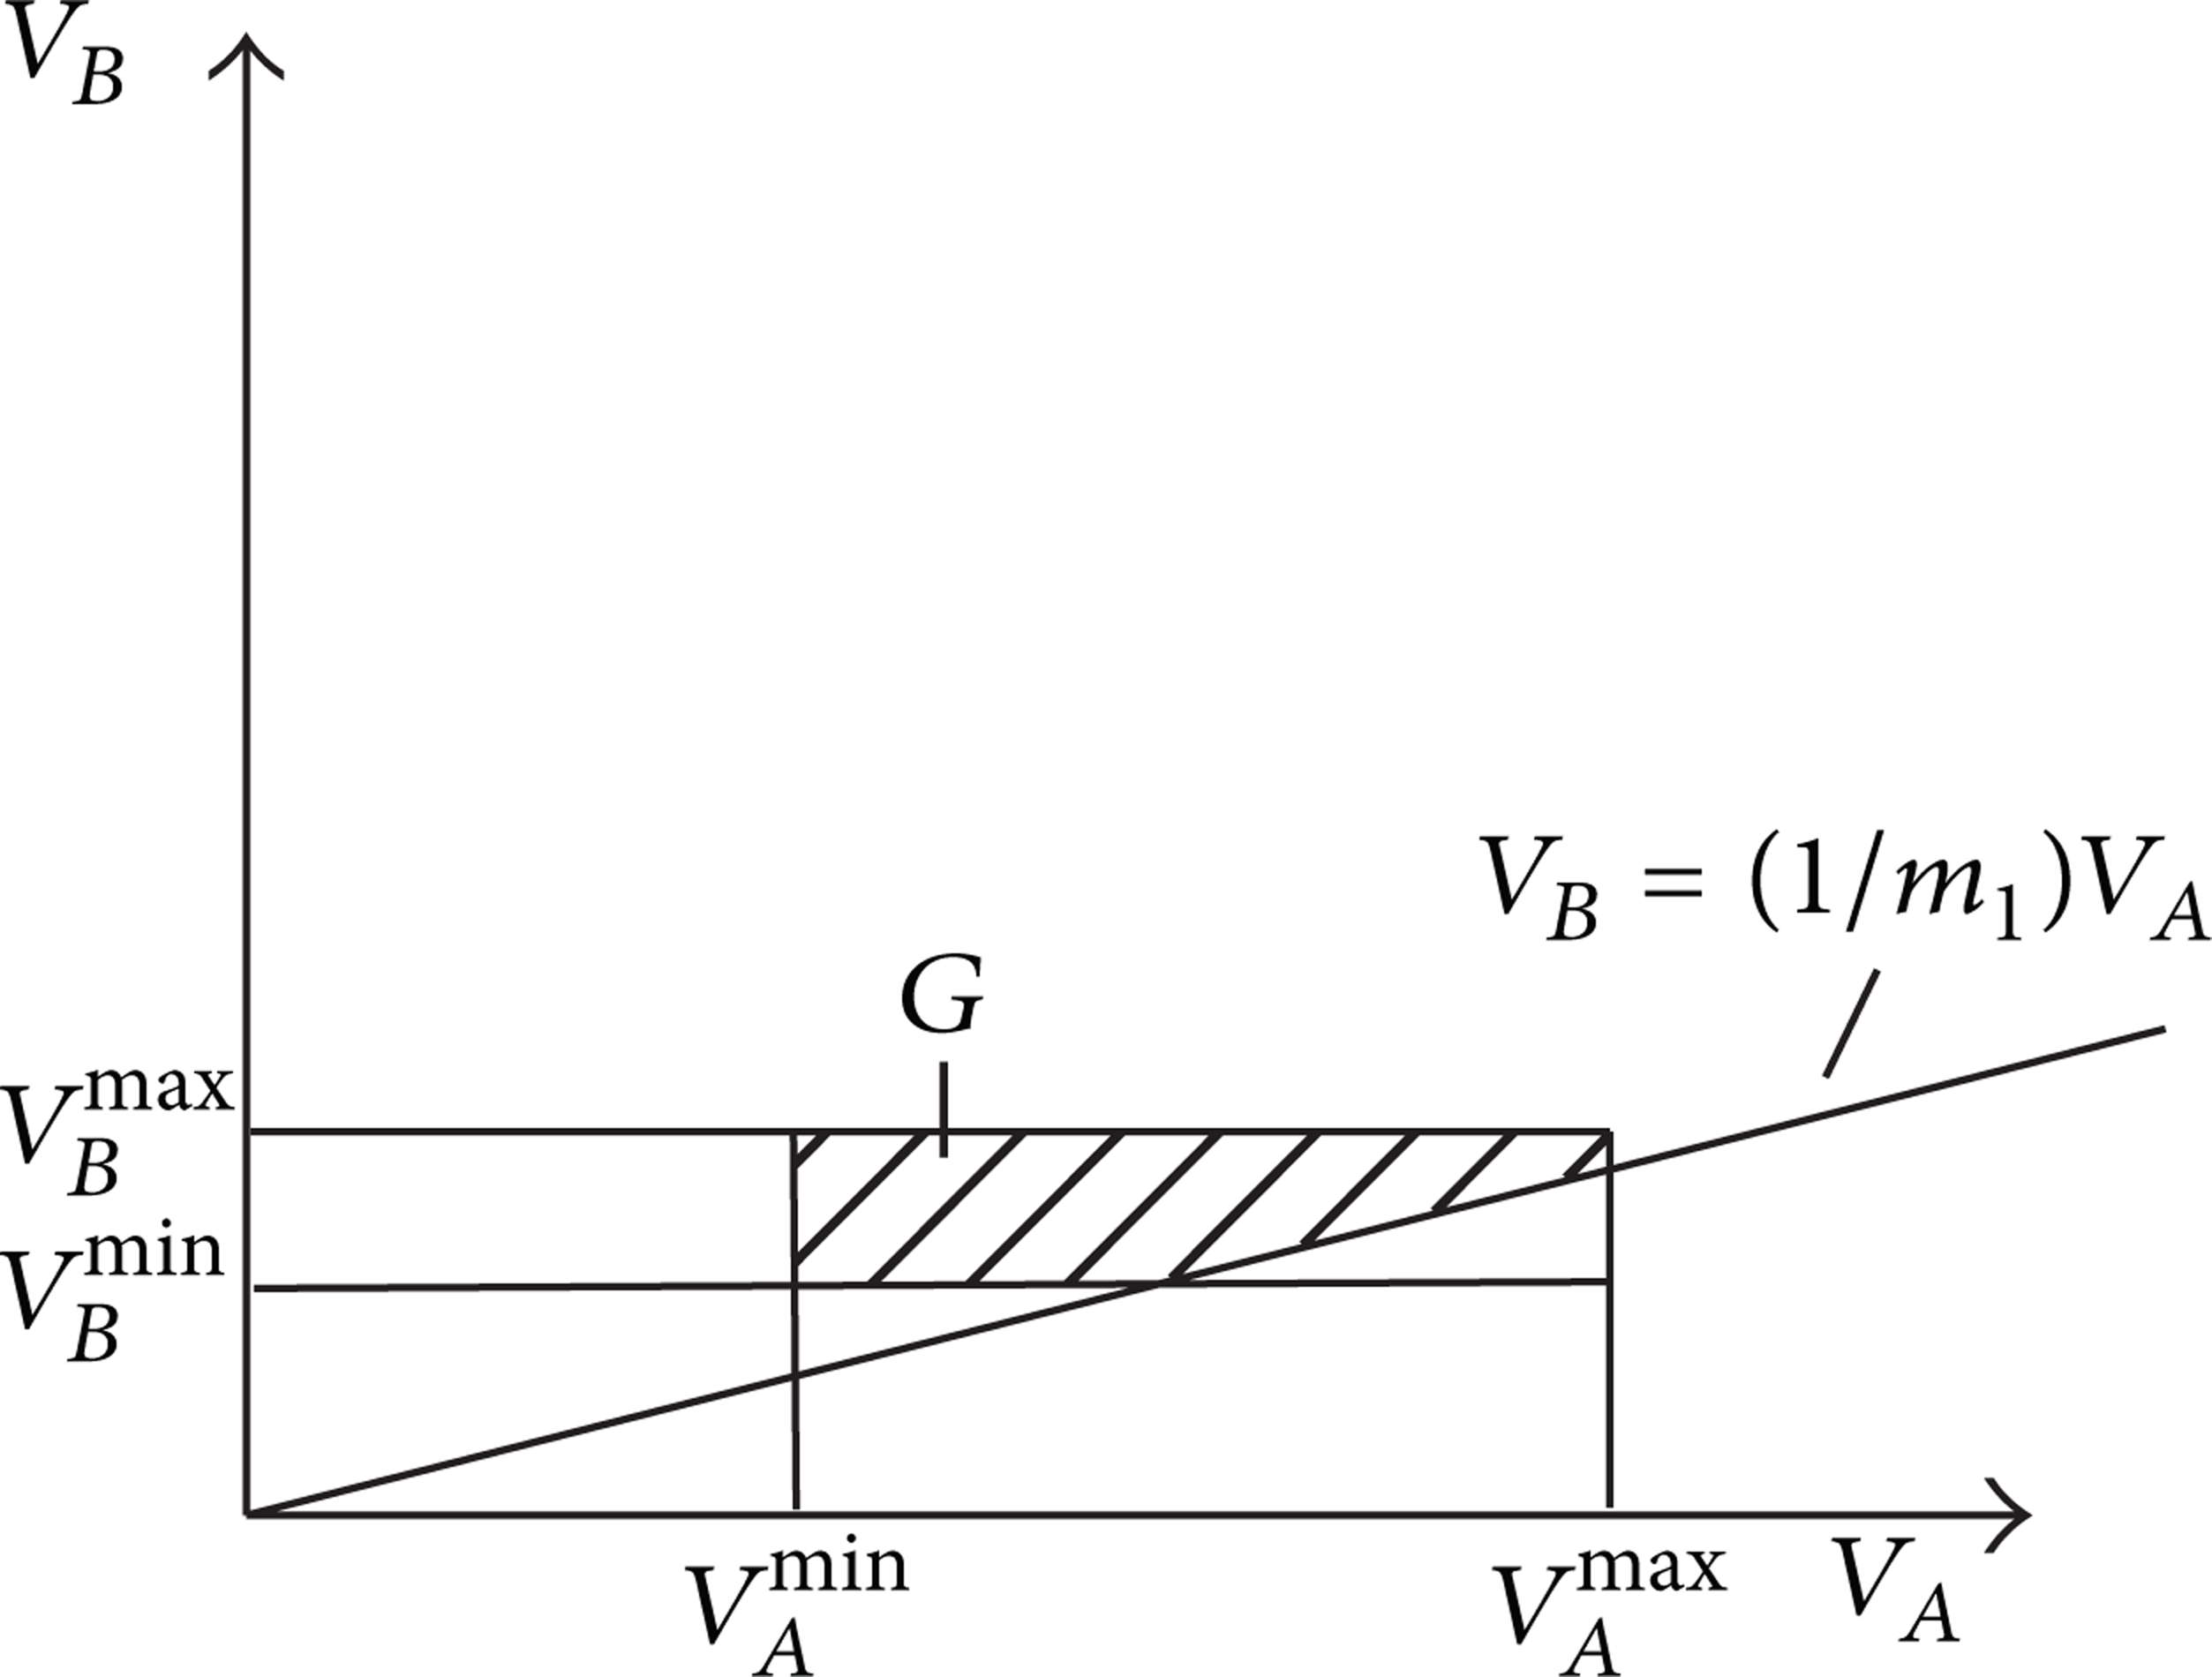
Definition domain G of V A and V B .
Similarly, (7) can be obtained as follows:

Then P c can be calculated according to (4). It varies along with the change of drivers’ decision and vehicle speed.
3.2.3. Payoff Function of Drivers Decision Behavior
Drivers’ payoff includes two parts, that is, delay and risk of collision. Delay is the difference value between practical travel time and expected time, which can be affected by both drivers’ decision behavior and vehicle speed. If drivers decelerate, it will take more time. Delay will increase with the increase of vehicle speed.
According to experimental results, this study divides vehicle speeds into low speed (less than 40 km/h), medium speed (from 40 km/h to 60 km/h), and high speed (more than 60 km/h).
Payoff function of drivers, u1, is denoted as shown in

where u1d is the loss of delay, u1c is the loss of collision, and P c is the collision risk probability.
According to the experiment data, the collision risk probability P c could be achieved when drivers accelerate, decelerate, or keep uniform speed at different speed levels. The values were shown in Table 1.
Collision risk probability under different speed levels.

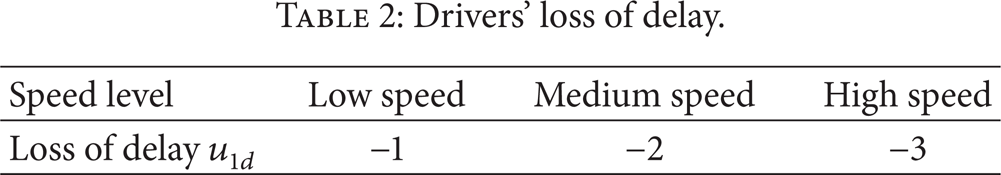
The higher values of vehicle speed are, the greater loss of delay is when the drivers decelerate. Considering their relationship is approximate linearization, the values of u1d were set as shown in Table 2.
Drivers’ loss of delay.
The higher values of vehicle speed are, the greater loss of collision is once collision happens. The value of u1c is obviously greater than u1d. The values of u1c can be shown in Table 3.
Drivers’ loss of collision.

Then the values of payoffs in Table 4 can be obtained. From Table 4, it can be seen that the drivers had better accelerate or keep uniform speed when the speed is low. When vehicle speed is medium, there is not much difference among three decisions, but keeping uniform speed is a little better. When the vehicle speed is high, the best decision for drivers is to keep uniform speed.
Payoff values of driver decision behavior.
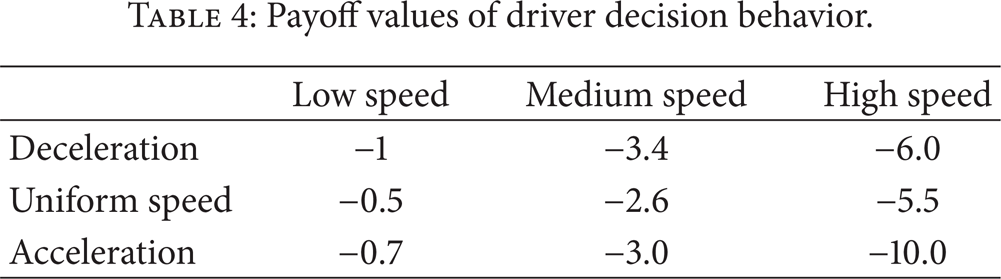
The above values were based on driver's decision behavior without considering pedestrian's behaviors.
3.3. Decision Behavior of Crossing Pedestrians
3.3.1. Pedestrian's Risk Perception and Decision
Experimental results show that the pedestrian's perceived risks will be low when the vehicle speed is less than 40 km/h and it will increase quickly as vehicle speed increases. When vehicle speed ranges from 40 km/h to 50 km/h, the pedestrian's perceived risk will be at slightly dangerous or commonly dangerous level. When they think it is commonly dangerous, more than half of pedestrians will choose to cross the road. At the same time, more pedestrians will observe drivers’ behaviors before deciding to wait or cross.
When vehicle speed is 50 km/h or higher, most pedestrians thought it is highly dangerous or extremely dangerous. Few pedestrians thought it is commonly dangerous and chose to cross. When vehicle speed is more than 60 km/h, all pedestrian's perceived risks will be at highly dangerous or extremely dangerous level. There is nobody crossing, and all pedestrians choose to wait.
3.3.2. Pedestrian's Waiting Time
Delay of pedestrians is related to waiting time. The longer waiting time is, the greater loss of delay is. Then they are inclined to take risks crossing, which will lead to possible collisions.
Pedestrians’ psychological characteristics vary when waiting time is different. Waiting time is divided into three stages as shown in Figure 4. In Figure 4, S k is the stage, t k is time demarcation point, and P k is the probability of crossing in S k stage.

Stages of waiting time and probability of crossing.
In stage S1, t ∈ (0, t1), pedestrians just arrive, and their emotion is stable. During this stage, few pedestrians cross roads directly without looking around, and the crossing probability is P1.
In stage S2, t ∈ (t1, t2), pedestrians have waited for a while, and the crossing probability is P2. As the waiting time goes on, P2 increases; that is, ∂P/∂t > 0 and ∂P2/∂2t > 0.
In stage S3, t ∈ (t2, t3), pedestrians have waited for a long time, and pedestrians tend to take risks crossing and the crossing probability is P3. P3 increases rapidly; that is, ∂P/∂t > 0 and ∂P2/∂2t < 0.
When t > t3, the waiting time is far beyond pedestrians tolerance. Pedestrians cannot wait to this stage. Therefore, the condition does not need to be analyzed.
3.3.3. Payoff Function of Pedestrians Decision Behavior
The pedestrians’ payoff also includes two parts, that is, delay and risk of collision. Assuming a pedestrian has waited u2d0, he is in game with the present vehicle. If he crosses the road, the additional delay will be 0; otherwise, the additional delay will be u2d′, and u2d′ is related to vehicle speed. If pedestrians choose to wait, the loss of collision u2c will be 0. If they choose to cross, the loss of collision will grow with collision risk probability P c .
When pedestrians choose to wait, the payoff u2 = u2d. When pedestrians choose to cross, the payoff u2 = P c × u2c + (1 − P c ) × 0 = P c × u2c. Thus, payoff function of pedestrian can be obtained:

where u2d is the loss of delay, u2c is the loss of collision, and P c is the collision risk probability.
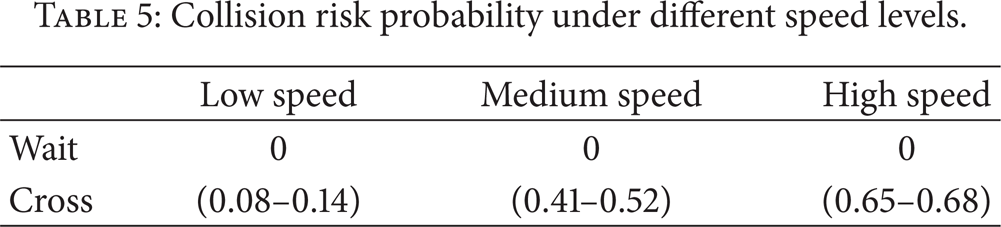
According to the experimental data, values of collision risk probability P c under different speed levels in Table 5 can be obtained.
Collision risk probability under different speed levels.
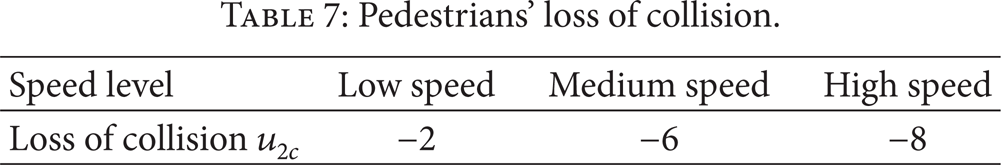
The higher value of vehicle speed is, the longer pedestrians will wait. In stage S1, if pedestrians choose to cross, it indicates that vehicle speed is low. They do not have to take high risk, so they will cross rather than wait. Similarly, if pedestrians choose to cross in stage S3, this indicates that vehicle speed is high and they cannot bear the long waiting time any more. Then the loss of delay and collision under different speed levels can be calculated as shown in Tables 6 and 7.
Pedestrians’ loss of delay.

Pedestrians’ loss of collision.
Then the payoff values of pedestrians were obtained as shown in Table 8.
Payoff values of pedestrian decision behavior.
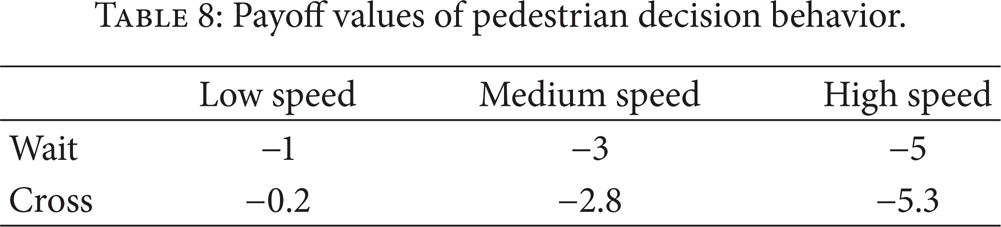
Through the analysis of the payoff function, it is suggested that pedestrians had better crossed the road when the speed is low. When vehicle speed level is medium, there is not much difference between waiting and crossing, but crossing is a little better. When vehicle speed is high, even though pedestrians get tired of waiting, they will still have to choose to wait as the risk of collision is high. And this explains the phenomenon that pedestrians can hardly cross the road when traffic speed is significantly high.
3.4. Dynamic Noncooperative Game Model
3.4.1. Strategy Space
In the game between drivers and crossing pedestrians, the strategies of drivers are to accelerate, decelerate, or keep uniform speed, and the strategy space is {A, U, D}. Pedestrians’ strategies are waiting and crossing, and the strategy space is {W, C}.
Besides, the latter player needs to consider the former action. Thus, the noncooperative dynamic game is divided into two models according to the order of drivers and pedestrians taking action.
(1) Drivers Taking Action Firstly. At the beginning of the game, the probabilities of vehicle speeds are P1, P2, and P3. Drivers make decisions firstly and then crossing pedestrians take actions.
The strategy space of drivers is {AAA, AAU, AAD, AUA, AUU, AUD, ADA, ADU, ADD, UAA, UAU, UAD, UUA, UUU, UUD, UDA, UDU, UDD, DAA, DAU, DAD, DUA, DUU, DUD, DDA, DDU, DDD}. The three letters are strategies that drivers choose at different speed level. Taking UDU as an example, it means that drivers adopt strategies of keeping uniform, decelerate and keeping uniform when vehicle speed is low, medium and high respectively.
The strategy space of pedestrians is {WWW, WWC, WCW, WCC, CWW, CWC, CCW, CCC}. The three letters are the strategies that pedestrians choose corresponding to the driver's three decisions. Taking WWC as an example, pedestrians choose to wait when drivers accelerate and keep uniform speed and then cross when drivers decelerate.
Then the payoffs of drivers and pedestrians were shown as in Figure 5.

Game expansion when drivers take action firstly.
(2) Pedestrians Taking Action Firstly. At the beginning of the game, pedestrians make decisions to wait or cross firstly and then drivers take actions.
The strategy space of pedestrians is {WC}, and the two letters are the strategies that pedestrians choose. The strategy space of drivers is the same as above. The letters are the strategies that drivers choose. Then the payoffs of drivers and pedestrians were shown as in Figure 6.

Game expansion when pedestrians take action firstly.
3.4.2. Payoff Matrix
If pedestrians choose to cross road when drivers accelerate or keep uniform speed, the probability of collision will increase.
After calculating the probability of collision again, the payoff matrix can be shown in Table 9.
Payoff matrix when drivers take action firstly.

If drivers choose to accelerate when pedestrians cross, the probability of collision will increase. After calculating the probability of collision again, the payoff matrix can be shown in Table 10.
Payoff matrix when pedestrians take action firstly.

3.4.3. Dynamic Noncooperative Game Model
The average payoffs EX1, EX2 can be obtained according to payoff function and payoff matrix when the game equilibrium is achieved.
(1) Drivers Taking Action Firstly. When drivers take action firstly, the payoffs of drivers and pedestrians will be determined by the strategies that they take. The values of game expansion can be obtained as shown in Figure 7.
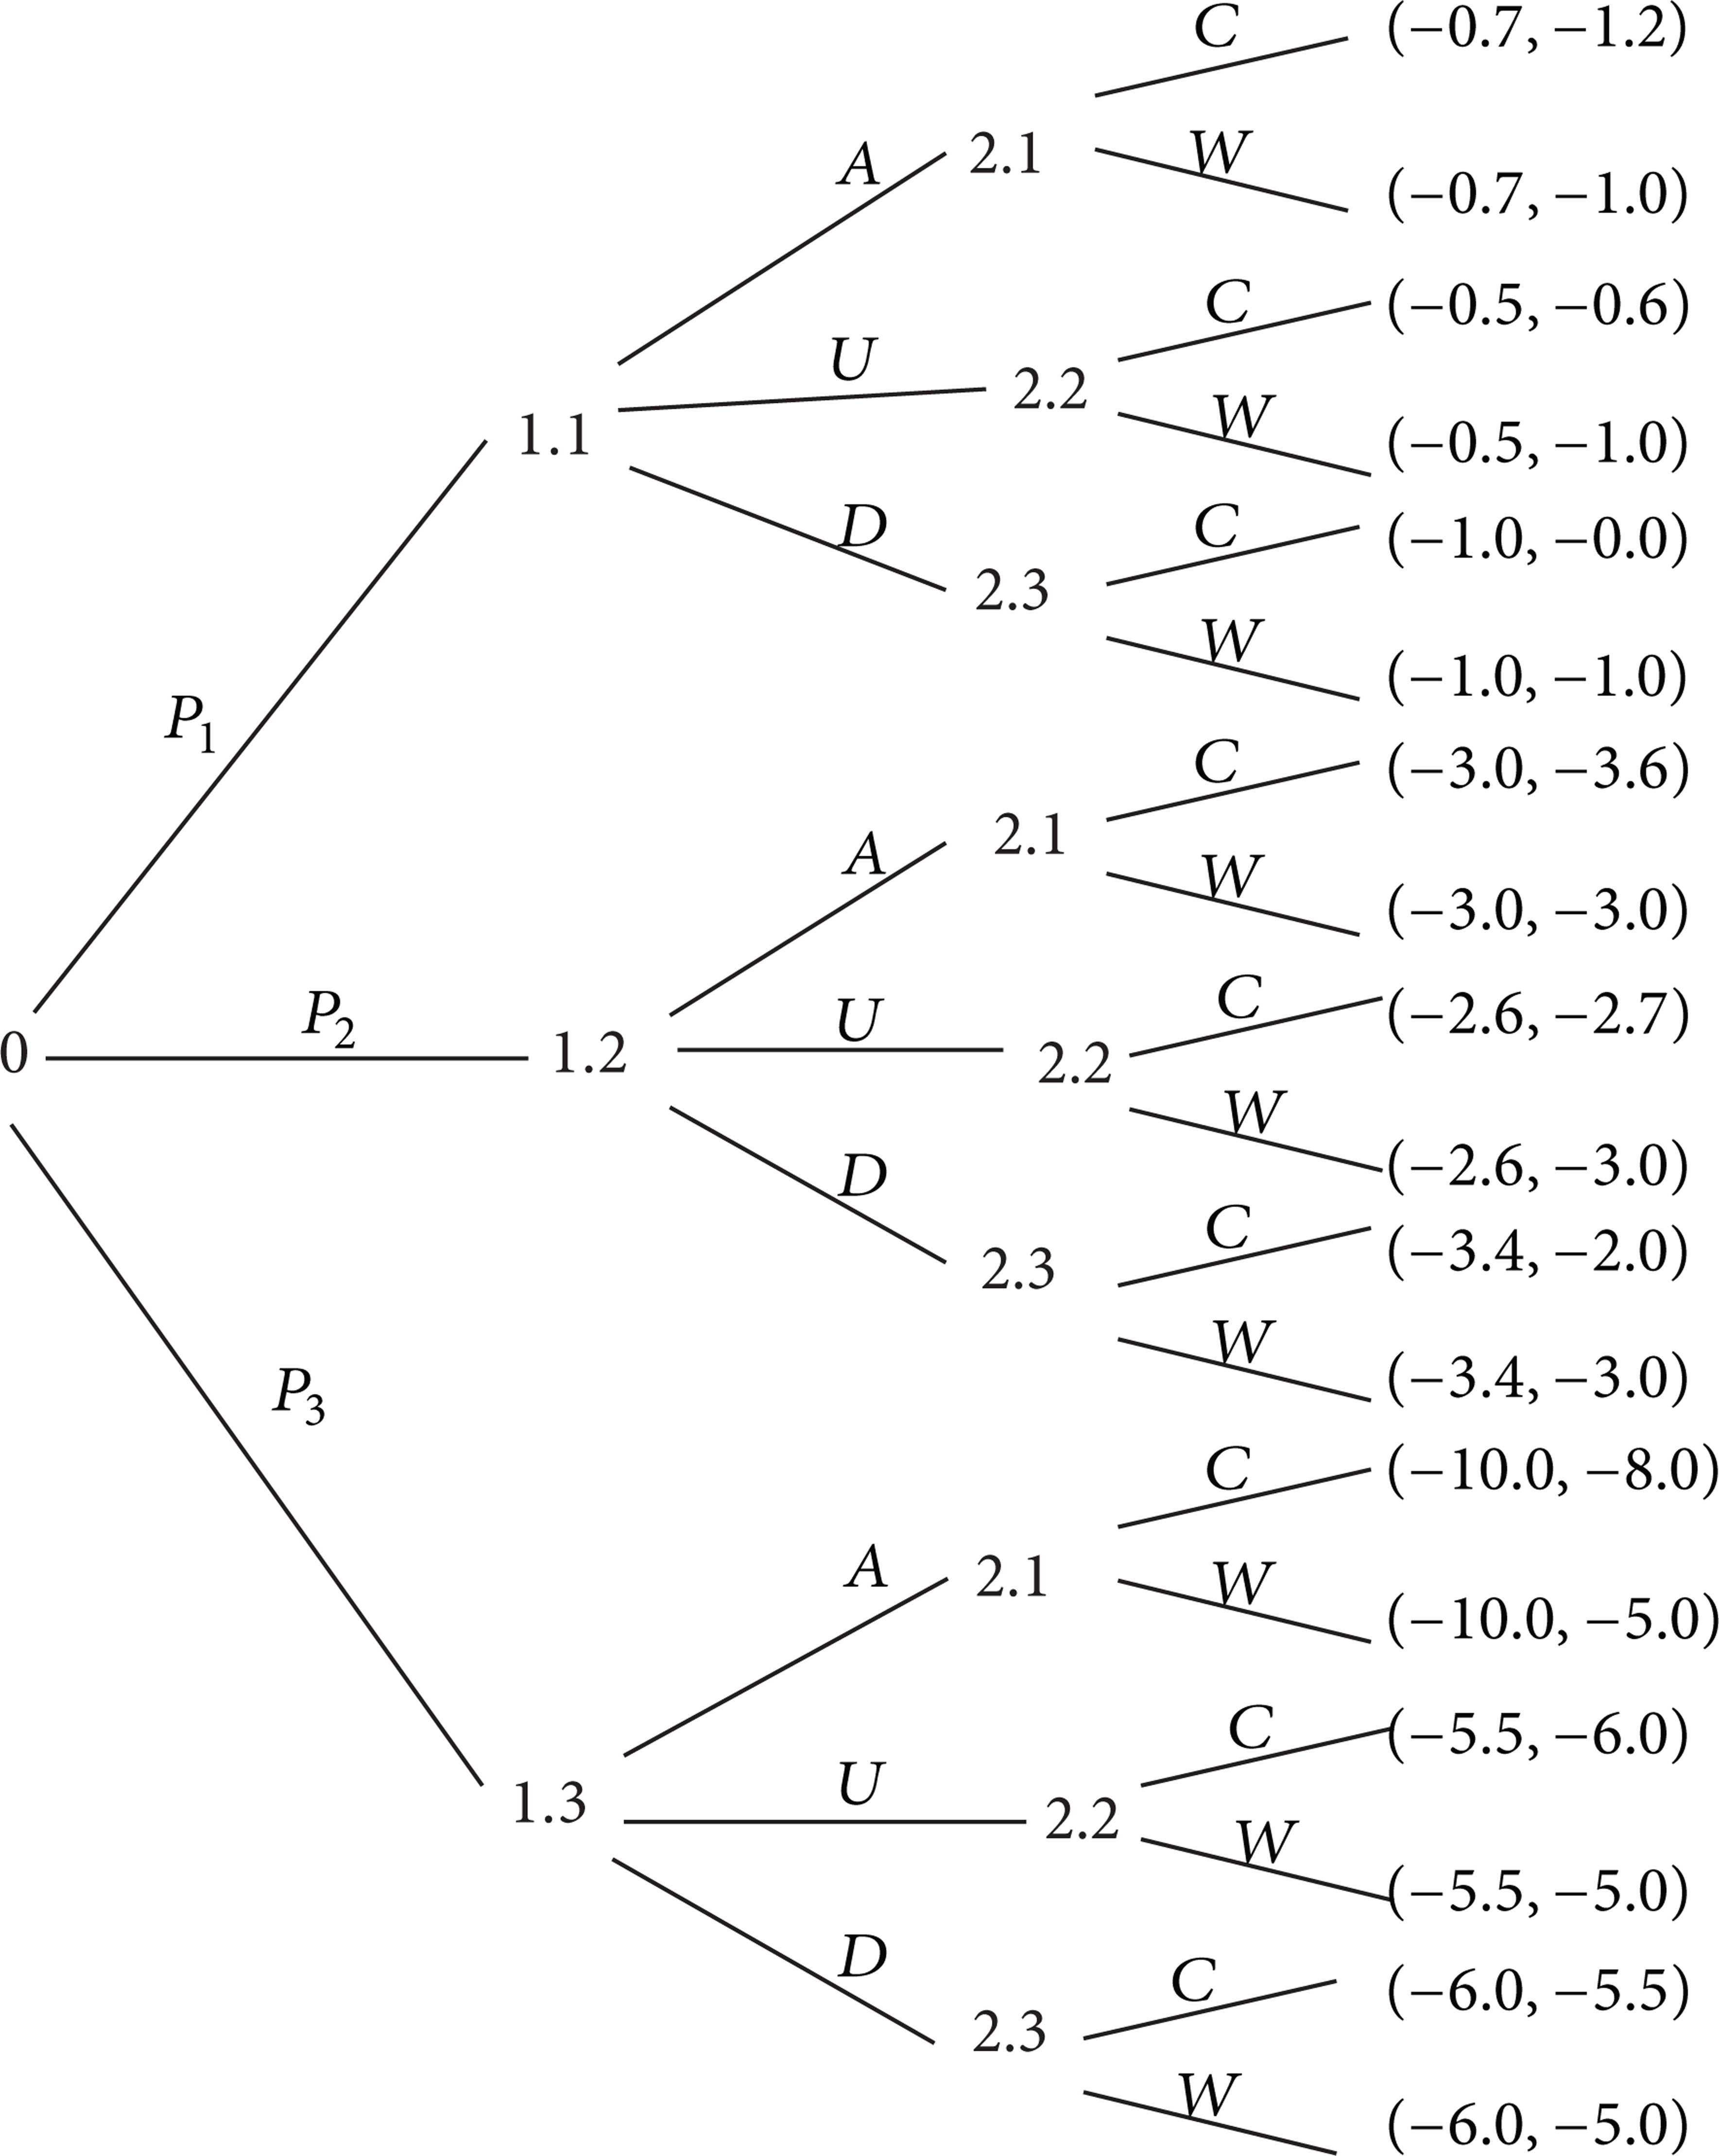
Game expansion values when drivers take action firstly.
According to Figure 7, the optimal solution can be obtained. The best strategy for drivers and pedestrians is U and W, respectively, in all conditions of speed.
The probabilities of vehicle speed P1, P2, and P3 could be obtained from speed cumulative frequency curve:

Then average payoff of drivers and pedestrians, EX1 and EX2, can be calculated:

(2) Pedestrians Taking Action Firstly. In actual situation, pedestrians always take actions earlier than drivers, resulting in a new game equilibrium. The values of game expansion can be obtained as shown in Figure 8.

Game expansion values of pedestrians taking action firstly.
Obviously, the best strategy for drivers is to accelerate (A) or keep uniform speed (U) when pedestrians choose to wait. On the contrary, the best strategy would be decelerating (D) when pedestrians choose to cross road.
Then the average payoffs of different strategies can be obtained:

When − P1 − 3P2 − 5P3 > − 0.2P1 − 2.8P2 − 5.3P3, the payoff of pedestrians will be greater if they choose to wait rather than cross. Therefore, in this condition, pedestrians should wait while drivers keep uniform speed. The optimal solution is (W, U).
When − P1 − 3P2 − 5P3 < − 0.2P1 − 2.8P2 − 5.3P3, the payoff of pedestrians will be smaller when they choose to wait. Therefore, in this condition, pedestrians should cross while drivers decelerate. The optimal solution is (C, D).
When − P1 − 3P2 − 5P3 = − 0.2P1 − 2.8P2 − 5.3P3, the payoffs of pedestrians will be the same whether they choose to wait or cross. Therefore, in this condition, pedestrians should take actions according to their characteristics. The optimal solution is (W, U) or (C, D).
3.4.4. Analysis of Optimal Solutions
When drivers take actions firstly and vehicle speeds satisfy (10), average payoff of drivers and pedestrians (EX1, EX2) is (− 2.76, − 3.0).
Pedestrians cannot wait all the time because massive pedestrians would gather and the delay will rise to the limit that they can tolerate. Then the equilibrium will be broken. Therefore, it is necessary to analyze the situation that pedestrians take action firstly.
According to (10) and (12), the average payoff can be got when pedestrians take action firstly.
When pedestrians choose to wait (W) and drivers keep uniform speed (U), the payoff will be

In equilibrium (W, U), pedestrians payoff is not greater than equilibrium (U, W) when drivers take action firstly. However, the payoff of drivers increases. This is because the risk of collision is little when pedestrians choose to wait and the delay of drivers is 0. Pedestrians delay does not change, so the payoff keeps the same.
When pedestrians choose to cross (C) and drivers decelerate (D), the payoff will be

In equilibrium (C, D), pedestrians payoff increases obviously. The attempt to cross will make drivers decelerate even though pedestrians bear some risks of collision. Then pedestrians cross and the delay will reduce, but the drivers have to decelerate to avoid collisions as the latter actor. When the drivers decelerate, they will reduce the risk of collision, but the loss of delay increases.
According to the above analysis, the equilibrium will be (C, D) only when − P1 − 3P2 − 5P3 < − 0.2P1 − 2.8P2 − 5.3P3. Only when P1 and P2 play a dominant role, the inequality will be tenable and pedestrians will choose to cross. Otherwise, pedestrians will wait until the inequality is tenable.
When the first pedestrian crosses the road, the driver will decelerate, and P1 and P2 will increase. The other pedestrians would follow the first on to cross the road. This analysis explains the phenomenon of pedestrians crossing the road in groups. In addition, it verifies the assumption that other pedestrians actions are influenced by the first one by following him to cross in groups.
When all pedestrians cross the road, the traffic flow will turn into normal. P2 and P3 will increase and play a dominant role. Pedestrians arriving later will wait until P1′ − 3P2′ − 5P3′ < − 0.2P1′ − 2.8P2′ − 5.3P3′. Then the equilibrium (C, D) will be formed.
4. Conclusions
In this paper, the relationship between risk and vehicle speed was revealed. On the basis of data from the risk decision-making experiment, the risk of collision was analyzed and a collision risk probability model was built. The decision behaviors of vehicle drivers and crossing pedestrians at different speed levels were analyzed and payoff functions were obtained. The payoff matrices of vehicle drivers and pedestrians were obtained. The number of strategy combinations is 18 under different speed levels. The strategy combinations and payoff of drivers and pedestrians vary when their order of taking action changes. The dynamic noncooperative game model between drivers and crossing pedestrians was built and analyzed.
Conflict of Interests
The authors declare that there is no conflict of interests regarding the publication of this paper.
Footnotes
Acknowledgments
This research was sponsored by the Natural Science Foundation of Jilin Province of China (201215176) and the Jilin Province Science and Technology Development Project (20140204026SF and 20140413011GH).