
Abstract
This paper proposes the design of an innovative high temperature gas-to-gas heat exchanger based on solid particles as intermediate medium, with application in medium and large scale externally fired combined power plants fed by alternative and dirty fuels, such as biomass and coal. An optimization procedure, performed by means of a genetic algorithm combined with computational fluid dynamics (CFD) analysis, is employed for the design of the heat exchanger: the goal is the minimization of its size for an assigned heat exchanger efficiency. Two cases, corresponding to efficiencies equal to 80% and 90%, are considered. The scientific and technical difficulties for the realization of the heat exchanger are also faced up; in particular, this work focuses on the development both of a pressurization device, which is needed to move the solid particles within the heat exchanger, and of a pneumatic conveyor, which is required to deliver back the particles from the bottom to the top of the plant in order to realize a continuous operation mode. An analytical approach and a thorough experimental campaign are proposed to analyze the proposed systems and to evaluate the associated energy losses.
1. Introduction
Nowadays, natural gas turbines dominate the field of power generation thanks to their black start capabilities, high efficiency, lower capital costs, shorter installation times, better emission characteristics, and abundance of natural gas supplies. Gas turbines for power generation are employed in both simple and combined cycles: technical improvements such as material advancements and cooling innovations have contributed to enhance their efficiency: accordingly, combined cycle plants are the thermal plants with the highest efficiency (about 60%).
The main drawback of combined-cycle plants and, generally speaking, of systems employing internal combustion (e.g., stand-alone gas turbines) is the demand for very “clean” (e.g., not producing ash) fuels, such as natural gas. It is well known that nowadays “clean” fuels are being depleted and that their availability is often expensive and jeopardized by geopolitical aspects. Cheaper, but also “dirtier,” fuels, like coal or Orimulsion or biomass (including the organic part of urban solid waste, food by-products, and pruning), are widely employed in stand-alone plants based on Rankine or Organic Rankine Cycles. Employing dirty fuels for feeding gas turbines (and thus combined-cycle plants) can be accomplished following three different strategies or a combination of them:
using gasification plants fed with oxygen or even air to convert coal or other fuels into a gaseous or liquid fuel;
using pressurized fluidized bed technologies for realizing the internal combustion of coal (or other solid fuels);
using external combustion in combination with a heat exchanger having high efficiency and low pressure losses.
With regard to the first technology, the integrated gasification combined cycle (IGCC) represents a promising technology to use coal in gas-turbine power plants. The main drawback associated with such plants is that they need oxygen-blown gasifiers, which are characterized by relevant investment costs and consume considerable amount of the generated power. To overcome these drawbacks, Giuffrida et al. [1] proposed an air-blown gasifier instead of the oxygen-blown one. Their simulation of a complete air-blown IGCC power plant provided a potential improvement in the net plant efficiency of about 1.5% points with respect to the oxygen-blown case. However, as stated by the authors, although air-blown gasification has raised interest in the recent years, the technical literature lacks works dealing with air-blown gasifiers that have shown results in detail or have given absolute values.
With regard to the second technology, it was already advocated by Yellot [2] more than fifty years ago; however, it is widely known that the pressurized fluidized beds require an operating temperature less than 900°C. Therefore, the temperature of the combustion gases exiting the fluidized bed cannot be greater than this value, which results in penalizing the efficiency of the thermodynamic cycle and the work produced by the gas turbine. Furthermore, cyclone separation is needed to eliminate inorganic and organically bound compounds (ash, sulphur, and alkali metals), partly transported by the flue gas, which would rapidly damage the turbine blades; see, for example, the works proposed by Povitsky and Goldman [3], Cai and Gou [4], and data retrieved by Laursen et al. [5] concerning ash deposition at three power stations in Denmark.
The present work concentrated all efforts on the third strategy. External combustion at ambient pressure has a simpler fuel supply than the pressurized fluidized bed; moreover, it is safer with regard to the combustor operation and the turbine integrity and life. Indeed, the combustor, operating at ambient pressure, can be more easily designed as a separate component and can be substituted later with a similar one fed with another fuel or mounted in parallel with another combustor to realize a multifuel combustion system: the technology for these components is quite mature. A further reason for pursuing the third technology is the possibility to deliver the air discharged by the turbine to the external combustor itself in order to reduce the fuel required by the combustion.
The external combustion system delivers hot exhaust gas to a heat exchanger that has to transfer heat to the clean air flow delivered by the compressor. The design of such a gas-to-gas heat exchanger is not a trivial task since
it operates at high temperature; thus it is interested by significant thermal deformations and stress;
it must operate with large flow rates that require very large exchange surfaces, in particular on the side where the gas flows at ambient pressure;
despite the very large exchange surface required, it must ensure low pressure drops on both sides and a low heat loss towards the ambient.
Concerning the first issue, the difficulty of reaching the very high temperatures (about 1600 K) afforded by the actual gas turbines is one of the major criticisms of external combustion. Technical solutions provided to date mainly refer to small flow rate applications, namely, to the design of recuperators for small- and microturbines, where the employed low pressure ratios make the heat recovery mandatory. However, such recuperators can only operate under conditions of very small flow rate and/or low maximum temperature. A comprehensive analysis of small recuperators design and technological issues, including manufacturing, can be found in [6]. Recently, another survey [7] weighed up the variety of gas-to-gas recuperators, comparing plate, plate fin, printed circuit, and spiral and tubular heat exchangers. From the above surveys (and even other ones, not reported here for brevity), it results that the most promising architecture for gas-to-gas heat exchangers working at high temperature makes use of an intermediate thermal medium (ceramic material) first to recover and then to release heat from one flow to another one. However, to the authors’ knowledge, the largest ceramic heat exchanger proposed so far by Schulte-Fischedick et al. [8], weighing up to 4 t, refers to a 6 MWe plant. In a recent work, McDonald [9] examined a wide range of heat exchanger concepts and demonstrators able to fulfill some of the aforementioned requirements; its cost-effective approach recognized the potential of ceramic recuperators for microturbines. Special efforts have been made to select and develop new alloys capable of withstanding very high temperatures and pressures (see, for example, [10]). However, their extension to very large flow rates and high temperature seems unaffordable.
Two innovative concepts for microturbine applications were proposed in the last years both by Wilson and Ballou [11] and by Tsai and Wang [12]: a ceramic honeycomb regenerator disk and the “Swiss-Roll,” respectively. In the former, the ceramic honeycomb is the thermal vector able to absorb heat from the hot flow and to release it to the cold flow, passing alternatively into a rotating structure. The two authors declared a high heat exchanger efficiency together with a small pressure drop. The latter is made of “two flat plates that are wrapped around each other, creating two concentric channels of rectangular cross-section:” the theoretical efficiency of this heat exchanger is 85%, but with 10% pressure drop. However, also in this case, the application to large flow rates appears quite difficult. A similar architecture, developed by Zimmermann et al. [13], employs two “Pebble-Heaters,” namely, two tanks with ceramic material that are periodically switched to allow the heat exchange between hot and cold gases.
There are also two similar examples of the pebble bed architecture, but realized with the two phases continuously flowing, namely, two patents of the 60s [14, 15]: both of them employ solid particles as intermediate medium. Such heat exchangers could have some advantages in comparison with traditional ones: very high efficiency, low pressure drops, and relatively simple construction. However, both proposals did not include detailed fluid-dynamic studies aiming to optimize the particle trajectories; moreover, to the authors’ knowledge, both patents have never been successfully implemented to transfer heat from a hot gas flow at ambient pressure to a pressurized cold air flow, surely due to the lack of a more in-depth analysis and optimization of their operation features.
Starting from the knowledge of these patents, Catalano et al. [16] aimed to perform all numerical and experimental investigations needed to develop a high-efficiency counterflow gas-to-gas heat exchanger, using a fine dispersion of alumina as intermediate medium. Small alumina particles fall in a column where hot gas flows from the bottom to the top; the warmed up particles are then collected at the bottom of the column and inserted at the top of a second column where they transfer the accumulated heat to a counterflowing cold gas. The potential of such a heat exchange mode was demonstrated experimentally by means of a test bench, reproducing the upper half of the proposed immersed particle heat exchanger. Catalano et al. [16] also equipped the experimental facility with a second vertical pipe, used to demonstrate that very fine particles, which could damage turbine blades in a real plant, can be completely eliminated by means of centrifugation.
In this scenario, the aim of this paper was to apply the immersed particle heat exchanger to medium and large externally fired gas turbines (EFGT) power plants. The application to EFGT and the relative scientific and technical difficulties will be discussed in the following section. In particular, a mechanical system, interposed between the two columns, is needed to pressurize the solid intermediate particles both to maintain their size constant and to avoid dust; afterwards, the particles can fall in the second column thanks to gravity. This issue is faced in this paper: two different mechanical devices able to pressurize the particles will be presented. A simple zero-dimensional model will be employed for analysing the main energy losses occurring during the pressurization procedure. A further energy loss, due to the energy absorbed by the conveyor, will be evaluated with respect to the overall thermal energy exchanged between the particles and the gas in the bottom column. Then, the experimental campaign will be presented to validate the proposed mechanical solutions and the numerical model by comparing the experimental data with the numerical predictions. Finally, an optimization procedure, performed by means of a genetic algorithm combined with computational fluid dynamics (CFD) commercial software, aiming to design both columns, will be described. The goal is the minimization of their size for an assigned heat exchanger efficiency. In order to reduce the time of the CFD process, a partial three-dimensional model, which corresponds to a quarter of column, is employed to accurately predict the efficiency of both columns.
2. The Immersed Particle Heat Exchanger: Configuration and Application to EFGT
With reference to Figure 1, the application to EFGT can be achieved in the following manner: exhaust gas from a separate combustion chamber (external combustor) is delivered into the bottom of a vertical cylindrical pipe (top column); a proper flow rate of uniformly distributed cold particles falls from the top and is heated up by the hot gas stream, whose temperature can be ideally decreased to the particle inlet temperature, before leaving the column at its top. The warmed up particles are then delivered into the bottom column: since the pressure in the bottom column is greater than the pressure in the top column, a pressurization system is needed to pressurize the solid particles without damaging them and with minimal energy losses. The bottom column operates in a similar mode: rather cold (compressed) air enters the column at the bottom and flows upwards, in counterflow with the hot particles falling from the top. Hot air leaves the column at the top, whereas cold particles are collected and delivered back at the top of the plant by using a pneumatic conveyor. In this process, heat is absorbed from the hot gas, temporarily stored, and then released in the second pipe, where the cold stream is warmed up.

Application of the immersed particle heat exchanger (a) to EFGT (b).
It is obvious that a very small amount of natural gas or other clean fuel could be still employed in internal combustion mode to give the small temperature increase required to reach the desired turbine inlet temperature. This could also be seen as a smarter use of the available fuels: as shown in Figure 2, cheaper but “dirty” fuels are employed to provide heat at low and at medium temperatures, whereas “clean” but expensive fuels are burned at high temperatures only.

Application of the immersed particle heat exchanger (a) to gas turbine with external and internal combustions (b).
The development of the immersed particle heat exchanger (IPHE) needs to face up the following scientific and technical difficulties:
development, simulation, implementation, and test of a suitable system for transferring the hot particles from the top column to the bottom one;
choice of the particle conveyor and evaluation of the energy losses;
choice of the particle material;
design optimization of the inlet and outlet pipes for both the exhaust gas and the compressed air;
design of the global layout, with particular care to the minimization of thermal losses towards the ambient;
development, implementation, and test of a suitable system for distributing the falling particles at the top of the vertical ducts;
analysis of possible techniques for taking into account changes in the gas turbine operation.
Task 1. Development, Simulation, Implementation, and Test of a Suitable System for Transferring the Hot Particles from the Top Column to the Bottom One. A mechanical system interposed between the two vertical ducts is needed to pressurize the solid thermal medium; afterwards, the particles can fall in the second duct thanks to gravity. Such a device must operate without crushing the particles. This task was widely analyzed in this work. The next sections will provide the mechanical solutions together with the analytical models developed to assess that the lost pressurized air is only a negligible fraction (much less than 1%) of the flow rate operating in the gas turbine.
Task 2. Choice of the Particle Conveyor and Evaluation of the Energy Losses. In addition to the development of a reliable pressurization system, this work dealt with the choice of a suitable conveyor, capable of avoiding particle crushing and interference and characterized by negligible energy losses. The previous architecture of the immersed particle heat exchanger employed a standard mechanical conveyor [17]; in contrast, a pneumatic conveyor was preferred in this paper: part of the compressed air can be drawn from the compressor outlet and used to convey the particles up to the top of the plant. This operating mode allows the injection of the particles into the top column with a temperature almost equal to the air temperature at the outlet of compressor. As a result, if the gas turbine works at high compression ratio, and consequently at high compressor outlet temperature, the exhausted gas exiting the top column will have very high temperature and, in such a case, will be easily employed in a heat recovery steam generator of a combined cycle.
In the following sections, the power required by the conveyor will be proven to be negligible.
Task 3. Choice of the Particle Material. The particle material has been assumed to be alumina (Al2O3), which is suitable for high-temperature application. However, a thorough study for material selection has not been performed yet. In future works, existing ceramic or composite materials will be analysed in terms of melting temperature, specific heat, density, physical consistency, and possible manufacturing process, availability, and cost. The above parameters will be the driving criteria for the optimal choice of the particle material since they largely influence the IPHE efficiency (melting temperature, specific heat, and density), reliability (e.g., particle crushing during operation must be avoided), and cost. Modifications to existing manufacturing processes could be proposed too.
Task 4. Design Optimization of the Inlet and Outlet Pipes for Both the Exhaust Gas and the Compressed Air. To achieve a correct operation of the IPHE and thus a high heat transfer efficiency, the particles must be distributed as uniformly as possible in all transversal sections; namely, fall trajectories must be straight too. Unfortunately, the inlet and outlet pipes, if not carefully designed, could distort the gas flow, pushing the particles away from a straight path. This could even result in very bad distributions where the gas and the particles are confined in two different regions of the pipe, flowing separately. This task was not studied in this work. A general methodology for approaching this problem, based on design optimization techniques, was proposed by De Bellis and Catalano [18] and applied to a particular geometrical configuration. However, that geometry configuration dealt with a gas mass flow rate that was very low; hence, inlet and outlet pipes were optimized for a very small size column. In future works, such techniques should be tried for real operating conditions, which are characterized by high values of gas mass flow rate.
Task 5. Design of the Global Layout, with Particular Care to the Minimization of Thermal Losses towards the Ambient. The IPHE is inherently a noncompact heat exchanger, since the use of small particles (diameter smaller than 1 mm) implies small flow velocities (of the order of some m/s), which, in turn, oblige to use quite large vertical ducts. An advantage of this feature is that the pressure losses in the heat exchange modules are absolutely negligible. On the opposite side, the large surface of the pipe requires particular care in designing a proper thermal protection to avoid large thermal dissipation: future works will consider different technical solutions based on the use of insulating material and on the addition of further flow passages which will protect the vertical ducts and recover most of the heat transferred through the duct surface; further technical solutions could be considered too.
Task 6. Development, Implementation, and Test of a Suitable System for Distributing the Falling Particles at the Top of the Vertical Ducts. Particles have to be introduced at the top of each vertical duct as uniformly as possible. In future works, a system based on the use of grids will be considered at first: a careful analysis of the difficulties arising from the high temperature operation (e.g., deformation) will be performed before its implementation and test. Alternative technical solutions will be considered in case this method would become inadequate at high temperatures or in case of unsatisfactory results or of difficulties arising from the previous tasks.
Task 7. Analysis of Possible Techniques for Taking into Account Changes in the Gas Turbine Operation. This task deals with the regulation of the heat exchanger during the off-design operation. A reduction in flow rate through the gas turbine would cause a corresponding reduction in flow velocity within the heat exchange modules and, in turn, a reduction in injection rate of the falling particles. Therefore, technical solutions for reducing the particle flow rate need to be explored: this investigation may lead to search different solutions for dispersing the particles at the top of each vertical duct. Such difficulties related to the off-design operation of the IPHE need to be faced up: for example, the effect of variation not only in flow velocity but also in one or more temperature values will be investigated.
Future works will perform such investigations both numerically and experimentally. Experimental investigations will require a reliable control system, capable of modulating the particle flow rate and the duration of the pressurization cycle by adjusting proper control signals. In this regard, Amirante et al. [19, 20] designed an adaptive fuzzy logic controller, which was experimentally validated in a particular case, namely, the automatic regulation of the thrust of a small-scale turbojet engine.
3. Pressurization System: Configuration with Control Valves
Figure 3 shows a possible solution to move the hot particles from the top column to the bottom one: the pressurization system is mainly composed of a pressurization tank interposed between the two heat exchange modules, one pipe connecting the tank with the bottom duct and four control valves (denoted with A, B, C, and D in Figure 3). The opening and closing of the control valves need to be regulated by a control system. For application to EFGT (see Figures 1 and 2), the cold gas in the bottom column is compressed air.
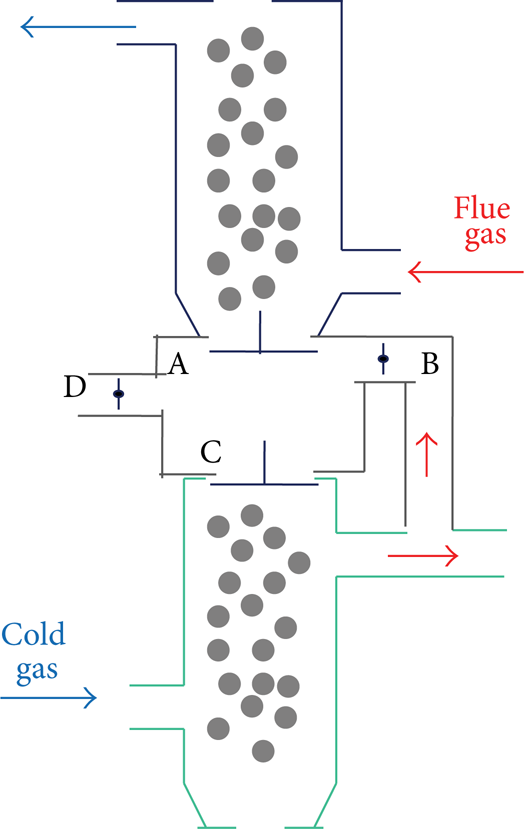
Mechanical solution with control valves.
One pressurization cycle consists of the following four steps.
Tank filling: at the beginning of the cycle, the four valves A, B, C, and D are in closed position: the first phase starts when the valve A opens and the solid particles start falling into the pressurization tank.
Pressurization: once the particles are in the tank, the valve A closes and the pressurization phase starts by opening the pressurization valve B: a small amount of compressed gas moves from the bottom duct to the central tank. As a result, the pressure in the tank increases until attaining the pressure in the bottom column.
Particle discharge (from the pressurization tank to the bottom column): this phase starts when the valve C opens and the solid particles can fall down for gravity from the pressurization tank into the bottom duct.
Gas discharge: when the particles have been discharged from the central tank, valves B and C can be closed; the compressed gas remaining in the tank needs to be ejected in order to lower pressure to the atmospheric value and to start a new cycle. Thus, valve D is opened.
4. Evaluation of the Compressed Gas Ejected into the External Environment
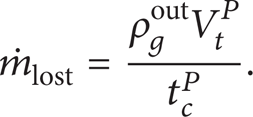
The compressed gas ejected into the external environment represents an energy loss, which is investigated in this section by means of the quantification of the overall percentage of the gas flow rate which is lost. The connection between the bottom column and the central tank is kept open by the pressurization valve (valve B in Figure 3) during the discharge of the solid particles from the central tank into the bottom column. At the end of this phase, which occurs when all solid particles have been transferred from the pressurization tank into the bottom column, and the valves C and B are closed, the pressurization tank is full of compressed gas. In order to repeat the pressurization cycle, this gas must be ejected to the outside and this is achieved during the last phase of the cycle, by opening the valve D. The corresponding mass flow rate of compressed gas discharged into the external environment,

where t c P denotes the duration of each pressurization cycle and mlost is the mass of compressed gas lost in one pressurization cycle: with the worst hypothesis, this amount can be considered equal to the entire mass of gas in the central tank immediately before the opening of the valve D. Therefore, with this hypothesis and denoting with ρ g out the gas density at the outlet of the bottom column and with V t P the volume of the central tank (see symbols in Figure 4), (1) can be written as
With regard to t c P , it can be split as

where t d P is the time interval of the particle discharge phase, which can be considered equal to the time interval spent for the particle discharge phase if the valves A and C have the same size [21], and t x P amounts the time intervals spent for the pressurization, for the gas discharge and for the valves actuation.

Bottom column with symbols.
The particles are discharged intermittently from the central tank into the bottom column; indeed the mass flow rate of particles varies with time from a constant value (when the valve C is open) to zero (in the remaining period of the pressurization cycle). Since the immersed particle heat exchanger must operate continuously in a real plant, an accumulation grid must be inserted below the pressurization system, in order to achieve constant mass flow rate of particles in the bottom column. Denoting by

where f is the filling coefficient and ρ
p
is the particle density. Since thermal capacities of particles and of gas must be equal for a counterflow heat exchanger,
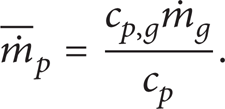
In (5), c
p,g
is the gas specific heat (supposed constant), c
p
is the particle specific heat and
When equating the right hand sides of (4) and (5), one obtains (6), which expresses the volume of the pressurization tank depending on the gas mass flow rate, the physical properties of the particles, and the cycle time (or, equivalently, the number of cycles per second, indicated with n P ):

Substituting (6) into (2), one obtains the expression of

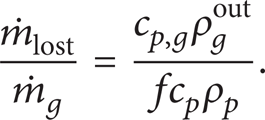
It is noteworthy that the denominator of (8) is significantly larger than the numerator, since the intermediate medium must be characterized by a large value of density. Equation (8) can be expressed in terms of pressures and temperatures as follows:

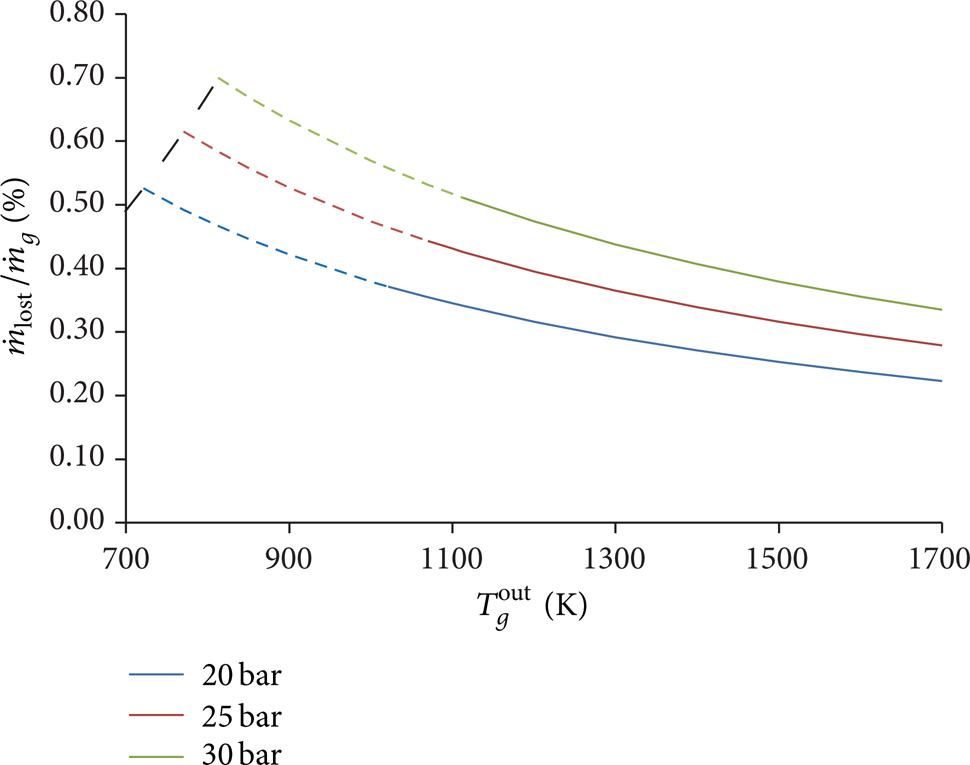
where p g c is the pressure in the bottom column (assumed constant), T g out is the temperature of the gas at the outlet of the bottom column, and R is the gas constant.
In Figure 5,
In a gas turbine plant, the pressure at the inlet of the bottom column, T g in, depends on the pressure p g c and on the characteristics of the axial compressor, namely, on the isentropic efficiency η is, c , as follows:

For fixed values of p
g
c
, (10) allowed the calculation of T
g
in, having assumed Tatm = 288 K, patm = 1 bar, and η
is,c
= 0.9. In Figure 5, the black dotted line denotes the curve of
Note that each curve at constant pressure is formed by two parts, namely, a first part (dotted line) that occurs for small values of T
g
out − T
g
in and a second one (continuous line) that occurs for large values of T
g
out − T
g
in: the demarcation point between the two parts was fixed equal to T
g
out − T
g
in = 300 K. Therefore, only the continuous lines are representative of the real conditions occurring in typical turbine plants, which would require very large values of T
g
out − T
g
in. As shown by the trends of the graph,
5. Cooling of the Particles in the Central Tank
After having entered the central tank, the hot particles mix with the cold residual gas remained in the capacity at the end of the depressurization phase. The cooling of the hot particles and the related energy loss can be estimated by means of the following numerical analysis.
The first step is to calculate the temperature of the residual gas in the pressurization tank at the end of the depressurization phase. Consider the mass of gas inside the pressurization tank immediately before the opening of the depressurization valve and assume the process to be adiabatic: application of the first law of thermodynamics to this mass leads to

In (11), Lext is the work done by the gas onto the external environment and ΔU is the variation of the internal energy between the final and the initial states. Pressure, temperature, and density of the compressed gas in the pressurization tank at the beginning of the depressurization phase can be assumed equal to the values of pressure, temperature, and density occurring at the outlet of the bottom column, namely, p g c , T g out, and ρ g out. Indicating with patm the atmospheric pressure and with p g f , T g f , and ρ g f , respectively, pressure, temperature, and density of gas at the end of the expansion and assuming constant specific heats c v,g and c p,g , the preceding equation becomes

Adding and subtracting the term p g c /ρ g out to the first member, being patm = p g f , and employing the equations c v,g T g f + p g f /ρ g f = c p,g T g f and c v,g T g out + p g c /ρ g out = c p,g T g out, after a few steps we obtain the expression of T g f :
Equation (13) allows the calculation of the temperature of the residual gas in the pressurization tank at the end of the depressurization phase, as well as the temperature of the residual gas when the particles enter the pressurization tank at the beginning of the cycle.
In order to evaluate the cooling of the hot particles entering the pressurization tank when the valve A is kept opened, we can equate the final internal energy with the initial internal energy of the system composed by both the residual gas and the intermediate medium:

where m g f is the mass of residual gas, m p is the mass of particles contained in the central tank, T p out is the particle temperature after the cooling, and T p in is the particle temperature before the cooling, namely, the temperature of the particles after the heat exchange in the top column.
Recovering T p out from (14), and assuming that the volume of the particles contained in the tank is equal to the entire tank volume, after few steps we obtain

Equation (15) can be used to compute the temperature of the solid particles T p out after the heat exchange with the cold residual gas at the temperature T g f , which can be calculated through (13). Both (13) and (15) allow the energy loss due to the cooling of the solid particles to be evaluated in the following manner:
for given values of T g out and p g c , according to the characteristics of the heat exchanger, the temperature T g f was calculated through (13);
since the bottom column is a counterflow heat exchanger, the difference of temperature ΔT between the hot particles and the compressed gas is almost constant over the entire column length, and ΔT depends on the efficiency of the heat exchanger, so it was possible to assign a constant value to ΔT;
for a fixed value of ΔT, T p out was calculated through T p out = ΔT + T g out;
by recovering T p in from (15), the value of T p in was computed as

the energy loss was quantified by means of the difference T p in − T p out.
Computations from item (1) to item (5) were repeated for different values of T g out, p g c , and ΔT in order to evaluate the energy loss for several operating conditions. In each case, the resulting energy loss was absolutely negligible. Here two significant cases are presented, for heat recovery cycles and for external combustion gas turbines, with the assumption that the intermediate medium is alumina.
For the heat recovery cycle, typical values are p g c = 10 bar, ΔT = 50 K, and T g out = 1000 K. From these fixed values, computation from item (a) to item (d) leads to the results T p out = 1050 K and T p in = 1050,03 K. The difference T p in − T p out and thus the corresponding energy loss are almost null.
For external combustion plant, we report a critical case, occurring at very high pressure ratio and high turbine inlet temperature; that is, p g c = 35 bar and T g out = 1700 K. From these fixed values and assuming ΔT = 50 K, the results of computation from item (a) to item (d) are T p out = 1750 K and T p in = 1750,03 K. Also in this case, the energy loss due to the particle cooling is absolutely negligible.
In conclusion, the hot particles do not undergo any significant cooling before being discharged into the bottom column.
6. Pressurization System: Configuration with a Gear Rotor
An alternative solution to the realization of the pressurization system is described in this section. Figure 6 shows that the pressurization system can be realized by means of a gear rotor spinning within a cover interposed between the two heat exchange modules. Figure 6 also provides a zoom on the pressurization system. When a chamber of the rotor is put in connection with the top column, the solid particles can fall into the chambers of the rotor for gravity; afterwards, during its rotation, the rotor forces the particles to move from the high pressure environment to the low pressure one. When a chamber of the rotor is uncovered in the bottom column, the pressure in the chamber increases and attains the pressure in the bottom column so that the particles can fall down for gravity from the rotor chamber into the bottom column. After the particles have been discharged from the chamber, the chamber is full of compressed gas: this gas needs to be ejected from the chamber in order to lower the pressure to the atmospheric value. This is achieved by means of the pipe connecting the top column with the rotor.

Pressurization system realized with a gear rotor.
Such a rotor must be manufactured with a ceramic matrix composite material with special ceramic fibres, in order to ensure good resistance both to the high temperature and to the mechanical solicitations (the rotor spins between two environments with a several pressure gradients).
In this case, the mass flow rate of particles

where V is the capacity of the rotor, namely, the sum of the volumes of the chambers, and n is the rotational speed, f is the filling coefficient. By equating the right hand sides of (17) and (5), we obtain the capacity of the rotor:

The mass flow rate of the lost compressed air can be expressed as

As a result, the ratio between the mass flow rate of compressed gas discharged into the external environment,

Substituting (18) into (20),

Equation (21) is equal to (8): as a result, the numerical model developed for the gear rotor is equal the one developed for the previous mechanical solution that employs one tank and four control valves. As demonstrated in the previous section, see Figure 5,
A further energy loss needs to be analysed, namely, the compressed gas that passes between the blade of the rotor and the cover and that moves from the bottom column to the top column. The clearance between the inner diameter of the case and the rotor blade tip must be assumed shorter than the particle diameter.
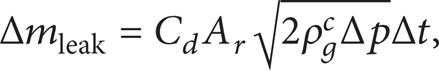
With reference to Figure 7 for symbols, the ratio between the mass flow leak,

where C d is the discharge coefficient and A r is the leakage area expressed as follows:

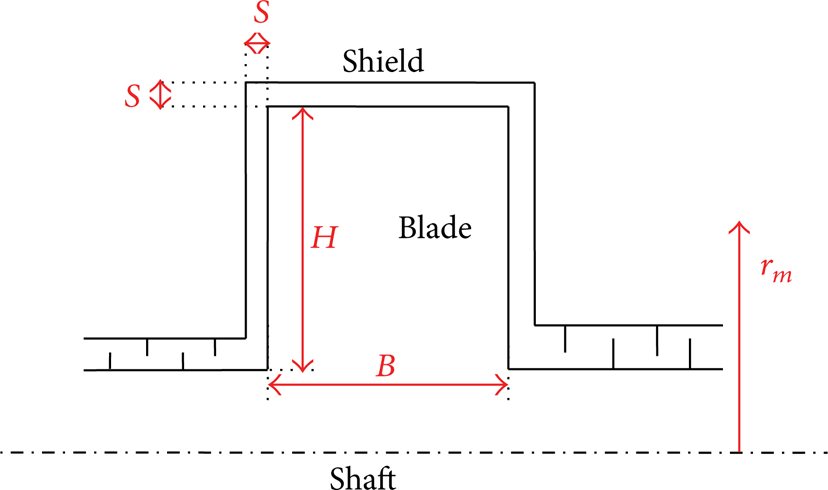
Sketch of a rotor blade.
The capacity of the rotor can be expressed as

where ξ is a coefficient less than one which takes into account the volume of the blades.
With the assumption B = 2H = r m and equating (24) with (18), one obtains

Substituting (25) and (23) into (22), the expression of

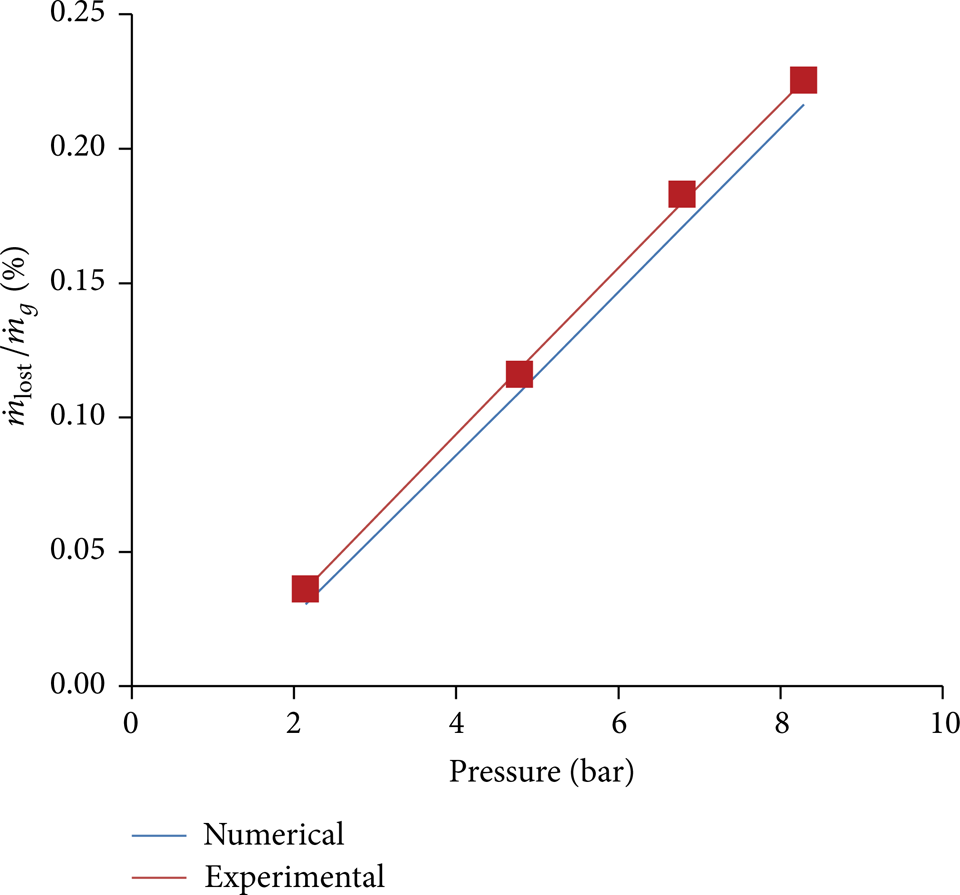
Equation (26) allowed the leakage to be evaluated. For the evaluation of this amount, we report a critical case, occurring at very high power, high pressure ratio, and high turbine inlet temperature; that is,
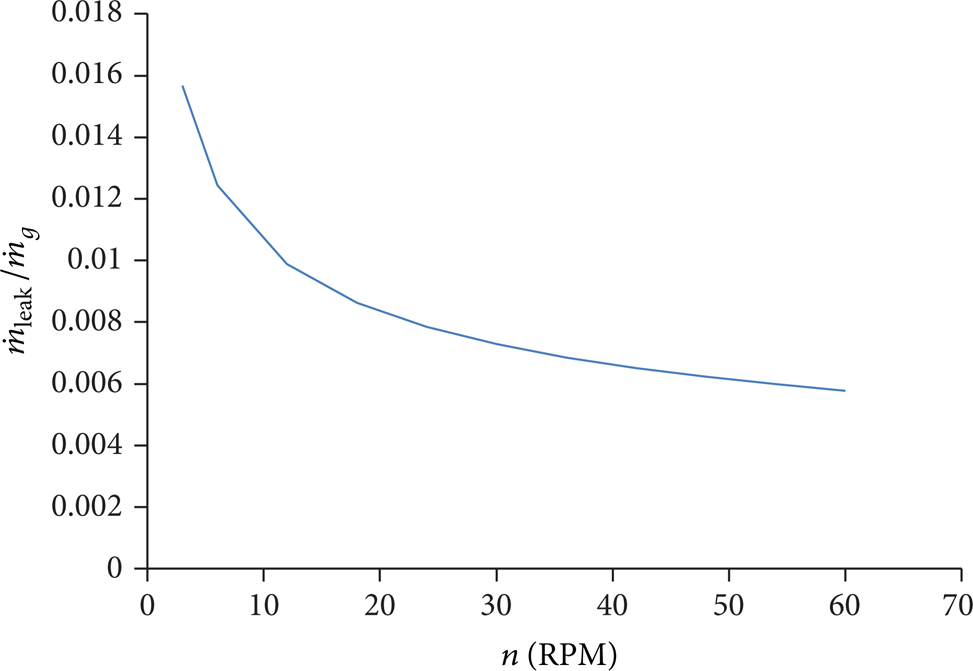
The speed of the rotor needs to be kept quite slow, in order to ensure good filling of the chambers; therefore, the upper limit was considered equal to n = 60 rpm. As shown in Figure 8,
7. Power Required by the Conveyor
The heat exchanger must operate continuously in a real plant; therefore, the particles, after having exited the bottom tank, must be delivered back to the top of the plant by using the pneumatic conveyor shown in Figures 1 and 2. The power absorbed by the conveyor,

where g is the acceleration of gravity and h is the overall height of the heat exchanger.
The numerator and the denominator of (27) represent the power adsorbed by the conveyor and the heating power released by the particles in the bottom column, respectively. With simple arguments,
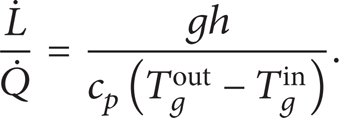
In Figure 9,
As shown by the trends of the graph,
8. Experimental Campaign
An experimental campaign was carried out in order to test both of the proposed mechanical solutions and to evaluate the theoretical model.
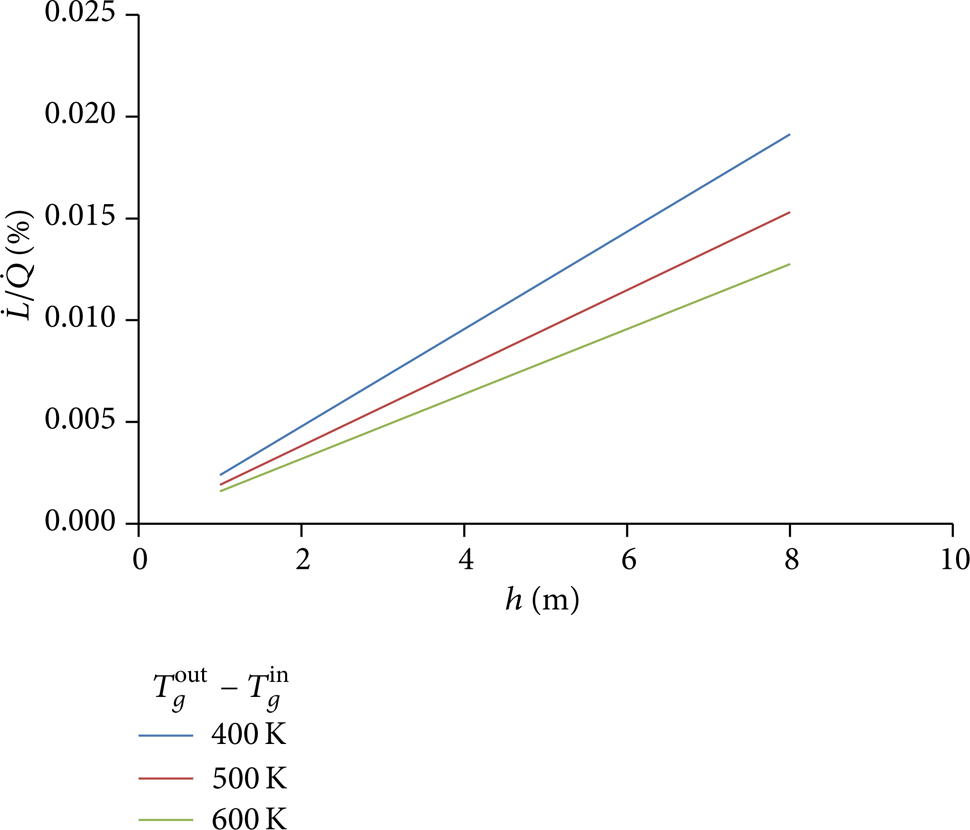
The first test rig is shown in Figure 10(a): it reproduced the pressurization system by means of one central tank that was connected to the top column and to the bottom column by means of two knife gate valves. The upper knife valve had the same function of the valve A in Figure 3, whereas the lower knife valve had the same task of the discharge valve (valve C in Figure 3): both knife valves had pneumatic actuators. The blue reservoir was directly connected to the compressed air supply, and it was also connected to the bottom column: a pressure regulator was inserted between the bottom column and the reservoir in order to fix a constant pressure in the bottom column. Figure 10 also shows the panel with all components that allowed the system to be controlled. The two valves denoted with “G.1” and “G.2” are 3-way, 2-position electrovalves with pneumatic spring return: they were employed to drive the knife gate valves. The inlet port of both of the two electrovalves was directly connected to the compressed air supply and both outlet ports were connected to the respective knife gate valves in order to control the opening or the closing of the knives.
Test bench (a) and panel (b) with the electrovalves, transducers, and driver.
The valve indicated with “Press” in Figure 10 is a 3-way, 2-position electrovalve with pneumatic spring return: its inlet port was connected to the compressed air supply, and its outlet port was connected to the piloting of a 2-way, 2-position N.C. pneumatically operated valve. The bottom column and the central pressurization tank were connected to the inlet port and to the outlet port of the 2-2 pneumatically operated valve, respectively: when the solenoid of the “Press” valve was energized, the connection between the tank and the bottom column was opened in order to perform the pressurization phase.
At the same way, the valve indicated with “Depr” in Figure 10, which is a 3-way, 2-position electrovalve with pneumatic spring return, piloted a 3-way, 2-position N.C. pneumatically operated valve. This couple of valves allowed the depressurization phase to be performed; the inlet port of the 3-2 pneumatically operated valve was directly connected to the central tank: when the solenoid of the “Depr” valve was energized, the compressed air in the pressurization tank is discharged into the external environment.
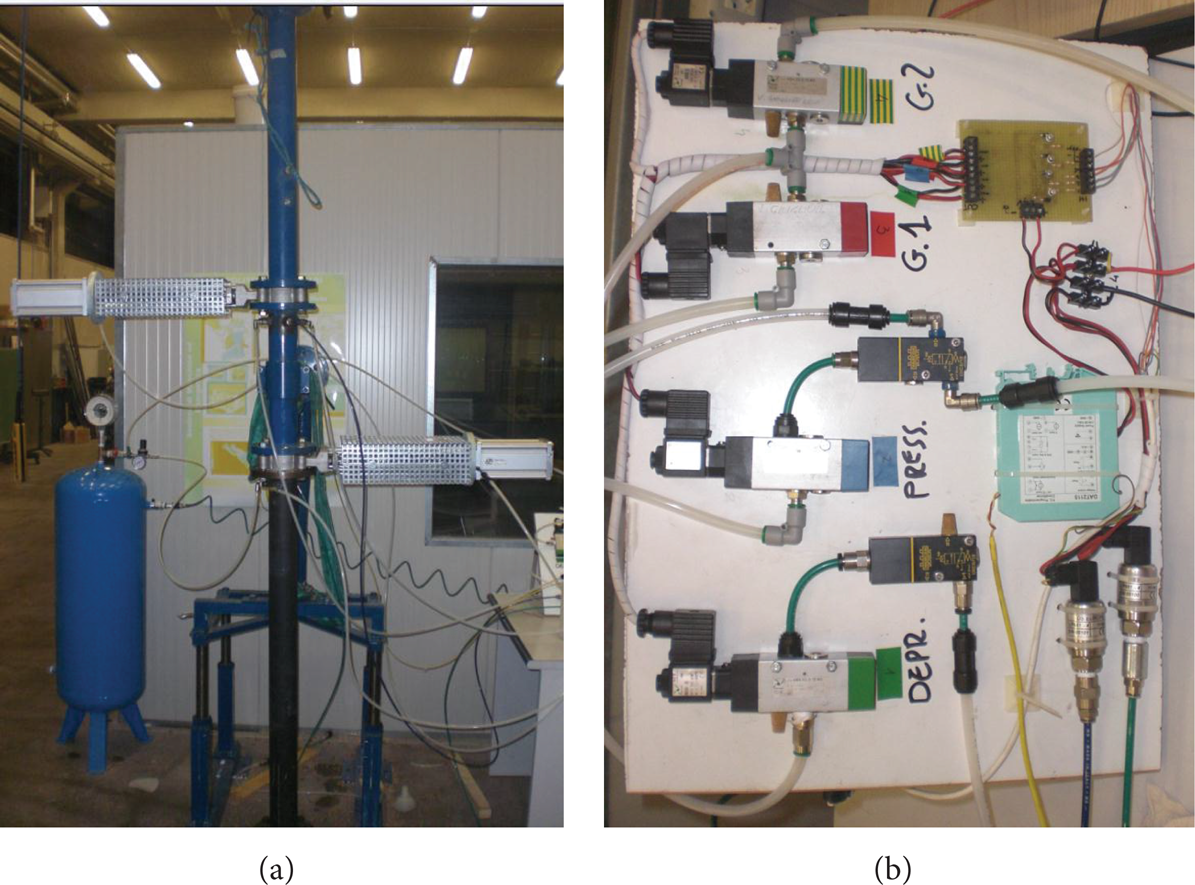
The solenoids of the electrovalves were driven by an external PC and by a DAQ card: between the data card and the solenoids we inserted a driver, shown in the top of Figure 10(b), since the solenoids required 24-Volt power supply with approximately 0.21 A absorbed current to move the internal spool, whereas the maximum current tolerable by the data card was 5 mA. The scheme of the driver is reported in Figure 11, and it consists of one transistor, one diode, and one resistance, connected as in the scheme: with this configuration, the current flowing through the output channel of the data card was different from the current absorbed by the solenoid coils. The panel also reports two strain gauge pressure transducers, allowing pressure to be measured in the pressurization tank and in the bottom column, and the linearizer of the thermocouple (accuracy ± 1°C) inserted in the central tank. The pressure transducers were electronically assisted to compensate the temperature variations, with accuracy < ± 0.5% of the full scale (10 bar).
Driver scheme.
Each test started with the top column filled with alumina under atmospheric pressure and keeping a constant pressure in the bottom column. The entire pressurization cycle was performed for several values of pressure in the bottom column, in particular from 2 to 10 bar. At first, the particles were loaded into the pressurization tank by opening the upper knife gate valve; then, this valve was closed and the pressurization phase began when the solenoid of the “Press” valve was energized and it opened the connection between the bottom column and the central tank. After the pressure in the tank had attained the pressure in the bottom column, the lower knife valve was opened and the particles were discharged into the bottom column. At the end, after having closed the lower knife valve, the compressed air remained in the tank was discharged into the atmosphere by energizing the solenoid of the “Depr” valve.
At first, the experimental tests were performed in order to evaluate the reliability of the knife gate valves: the tests showed that both the upper valve and the lower valve were capable of regulating the passage of the particles, respectively, from the top column to the central tank and from the latter to the bottom column. Several tests were performed under perfect air tightness condition; however, particle crushing became significant after such a long operation time: this resulted in a diminished capability of ensuring total air tightness in the closed position, since some particles were stuck between the knife and the valve seat, causing air leakage. In future works, this drawback will be analysed in order to find a mechanical solution which ensures total air tightness for a long operation time.
Repeated tests, performed under perfect air tightness condition, allowed the losses of the system to be analysed; in particular, the mass of compressed air discharged to the atmosphere was measured by means of a flow meter: the ratio
Finally, the second mechanical solution that employs the gear rotor was tested. The experimental tests were initially performed in order to evaluate the reliability of the pressurization procedure with the gear rotor. The latter was interposed between two columns: the top column was filled with alumina under atmospheric pressure, while a constant pressure was kept in the bottom column. The gear rotor was moved by an electric motor. The tests showed that the gear rotor, during its rotation, was able to transfer all of the particles from the low pressure environment to the high pressure one, even for high rotational speed. However, both the gear rotor and some of the particles were damaged during this operating procedure. This drawback needs to be analysed in future works in order to find a mechanical solution that allows the gear rotor to operate without being damaged and crushing the particles.
The test bench shown in Figure 13 allowed the compressed air that passes between the rotor blades and the cover to be evaluated. The gear rotor was connected to two reservoirs by means of two flexible pipes. The solid particles were not considered in this test, in order to simplify the experimentation. In order to measure the pressure and temperature in the two reservoirs, a strain gauge pressure transducer and a thermocouple were mounted in both reservoirs. The test started with only one reservoir under pressure (upstream reservoir), whilst the other one was kept under atmospheric pressure (downstream reservoir). The pressure was measured by means of the pressure transducers and its time history was recorded for both reservoirs.

Test bench to evaluate leakage and gear rotor prototype.
Figure 14 shows the time history of the pressure obtained during this test, reporting the experimental points measured both in the downstream reservoir (blue dots) and in the upstream reservoir (red dots). The same figure reports the time history of the pressure achieved with the numerical model: the predicted trend of the pressure in the downstream reservoir is plotted as a blue dotted line; the red dotted line denotes the predicted pressure in the upstream reservoir. The predicted pressure in both reservoirs was computed starting from the initial values of pressure and temperature measured in the experimental test and by employing the equation
where ρ g c is the density in the upstream reservoir and Δp is the pressure drop between the two reservoirs. Equation (29) was obtained from (22) by the separation of the variables. The discharge coefficient C d was taken equal to 0.65; the leakage A r was calculated by the geometrical values of the gear rotors and the clearance between the case inner diameter and rotor blade tips (0.5 mm); Δt is the interval time.

Experimental (exp.) and numerical (num.) trends of the pressure in the downstream and upstream reservoirs.
Starting from the initial values of pressure and temperature measured in the experimental test, the following steps were performed to evaluate the predicted values of pressure at each interval time with time step equal to Δt:
computation of the air masses in the reservoirs through the ideal gas law;
calculation of the mass of compressed air that moves from the upstream reservoir to the downstream reservoir through (29);
calculation of the new values of the air masses in the reservoirs;
calculation of the new values of pressure in the reservoirs through the ideal gas law.
Computations from item (a) to item (d) had been repeated at each interval time until the predicted pressure in the upstream reservoir attained the predicted pressure in the downstream reservoir. For such a computation, the temperatures in the two reservoirs were fixed equal to the corresponding average temperatures measured in the experimental test.
The optimum overlap among the experimental and the numerical data demonstrates the reliability of (29) and thus of the consequential numerical analysis proposed above for the evaluation of the leakage within the gear rotor.
9. Fluid Dynamic Analysis
The design of the IPHE required a thorough three-dimensional CFD analysis of both columns, which was developed using the commercially available CFD code Fluent. The numerical simulations employed a partial 3D model for both the columns, in order to reduce the computational time required by the flow simulation. A quarter of each column was generated and discretized by means of the grid generation tool Gambit.
The discrete phase model was employed; it is able to solve transport equations for the continuous phase (compressed air or flue gas) and to simulate the discrete second phase (ceramic particles) in a Lagrangian frame of [22]. Fluent computes the trajectories of these discrete phase entities, as well as heat and mass transfer to/from them. The coupling between the phases calculates the impact both on the discrete phase trajectories and on the continuous phase flow. The trajectory is based on the force balance on the particle (gravity and drag in the present case), while heat transfer calculations are based on the convective and radiative heat to/from the particle, using the local continuous phase conditions as the particle moves through the flow.
The continuous phase was modelled as incompressible ideal gas in the present case. With regard to particle properties, density, specific heat, and thermal conductivity were set equal to 3600 kg/m³, 1150 J/(kg K), and 25 W/(m K), respectively.
With reference to Figure 15, which presents the computational grid, the following boundary conditions were defined in Fluent:
velocity inlet: at the inlet section;
outflow: at the outlet section;
injection: at the internal surface shown in Figure 15;
symmetry: at the two surfaces where the physical geometry and the pattern both of the flow and of the thermal solution have mirror symmetry (see Figure 15);
wall: all remaining surfaces bounding the domain.

Computational grid.
When a particle encountered either the inlet boundary or the outlet boundary, it could escape through the boundary; the particle was lost from the calculation at the point where it impacted the boundary: trajectory calculations were terminated. When a particle encountered an internal surface, the particle could pass through it, such as the internal surface shown in Figure 15. When a particle struck a wall, the particle was reflected through partially elastic collision.
The particles were injected, with imposed mass flow rate and temperature, from the internal surface shown in Figure 15 and placed below the outlet section: the strategy of separating the injection surface from the outlet section allowed the solution divergence to be avoided when some particles were transported away by the fluid stream. In fact, in such a case and when the injection surface coincided with the outlet surface, the solution divergence arose after few iterations.
The standard K-ω model, in which modifications for low-Reynolds-number effects and viscous heating effects were incorporated, was chosen to predict turbulence.
The grid convergence analysis, not reported here for brevity, generated a computation grid with an overall skewness factor less than 0.5 and with an optimum number of cells equal to 150,000. Below this value, the simulations provided inaccurate results in terms of heat exchange: in such a case, the predicted amount of heat flow that was released from the hot particles was different from the one transferred to the cold air in the bottom column (the same happened for the top column).
All equations were solved using a second-order discretization: thanks to the careful grid generation and to the separation of the injection surface from the outlet, no convergence problems arose in all of the preliminary simulations. Table 1 reports the average residual levels calculated on ten different cases after 1000 iterations.
Scaled residuals after 1000 iterations (average values of ten different cases).

The good level of convergence achieved with only 1000 iterations allowed this number of iterations to be used in the optimization process. To assess the validity of the selected grid settings once more, the flow solutions were refined up to 5000 iterations for all of the ten cases under analysis: the considered performance parameters were verified to change less than 1%.
In this analysis, the particle shape was assumed to be spherical. If all of the possible manufacturing processes will not allow the production of small spherical particles at low cost, the use of nonspherical particles will have to be evaluated: different shapes could be cheaper than spherical ones, since their manufacturing process would be quite different. In such a case, different particle shapes will have to be analysed in terms of drag, onset of instabilities (and their relevance) during their fall, and heat transfer capability. Instability in particle motion could be taken into account by means of the numerical method employed in [23], which combines an immerse boundary method (IBM) with direct numerical simulation (DNS) and with a conjugate method for dealing with the conjugate heat transfer between gas stream and particle(s), or another similar if it appears even more suitable.
10. Design of the IPHE
The aim of this work was to develop a design process of both columns of the immersed particle heat exchanger, in order to find the minimum dimensions (height and diameter) that can provide the desired heat exchange efficiency. However, such a process is only a preliminary design and needs to be followed by a thorough analysis aiming to evaluate how to introduce the particles and the gas in the vertical pipes and to study the effects upon the overall efficiency.
With reference to Figure 16, the optimization design presented here concerns an external combustion gas turbine, characterized by high values of pressure and temperature, that is, 30 bar and 800 K at the outlet of the axial compressor and 1523 K (1250°C) at the inlet of the turbine. These are typical conditions of aeroderivative engines, which can operate at high compression ratios and high turbine inlet temperature.
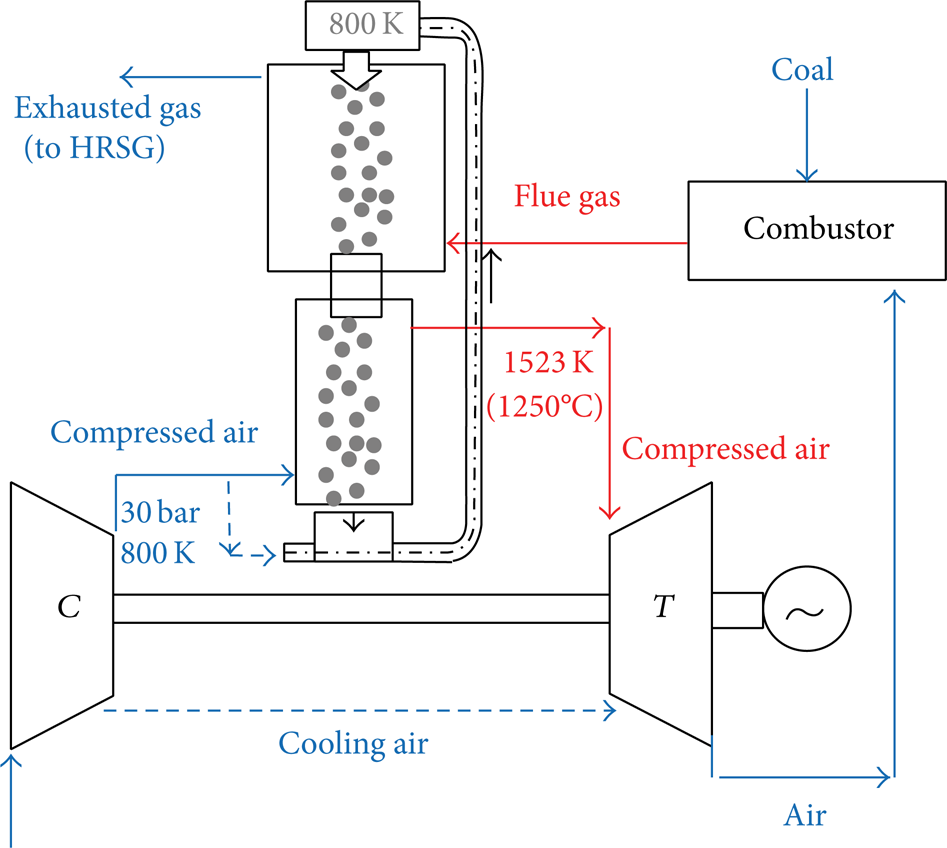
Externally fired gas turbine considered for the optimization design.
This choice allowed the optimization design to be tested for a very critical case in terms both of operating pressure and of maximum temperature. However, the same formulation of the problem to find the optimum geometry can be applied to a less critical case in terms of pressure and temperature, that is, application to heavy duty gas turbines (characterized by lower pressure ratios, typically below 20, and lower turbine inlet temperature).
The mass flow rate of air entering the bottom column was assumed equal to 85% of the mass flow rate of flue gases entering the top column, since, apart from the mass flow rate of fuel, a great amount of compressed air (∼15%) needs to be employed for the refrigeration of the turbine blades.
Note that when the mass flow rate of the compressed air produced by the compressor is large, the immersed particle heat exchanger needs to be divided in several modules, and each module is composed of one top column coupled with one bottom column. In such a way, the reduction in the diameter of each column can allow a more uniform distribution of the particles over the entire flow area with the effect to improve the heat transfer process.
In this optimization design, the mass flow rate of flue gas through the top column was set equal to 10 kg/s, whereas the mass flow rate of compressed air through the bottom column was set equal to 8.5 kg/s. This means that several of these modules need to be employed for medium and large energy generation. With the setting reported in Figure 16, a power plant with 10 kg/s must only employ one module: such a plant will provide 3.5 MW of electricity generation. Instead, 10 modules will be needed if the mass flow rate of flue gas is 100 kg/s: with the setting reported in Figure 16, such a power plant will provide 35 MW of electricity generation. Similarly, a power plant capable of generating 70 MW with an overall mass flow rate of 200 kg/s will require 20 modules, and so on.
The optimization procedure required one more piece of information, specifically the value of the particle temperature at the inlet of the top column. This temperature was set equal to the temperature at the compressor outlet, because a little amount of the same compressed air is used to lift the particles up to the top of the heat exchanger and it is realistic to expect the particle temperature to attain the air temperature at the end of the pneumatic convey.
The design parameters are diameter and height of the top column, diameter and height of the bottom column, particle diameter, and particle mass flow rate. These geometric parameters were allowed to vary within the design space provided by Table 2.
Design parameters.

It should be noted that the choice of the particle diameter requires particular care. Indeed, even if there must be a value of the particle diameter that can allow the top column to be designed with the minimum possible size that respects the prescribed constraints, the same particle diameter is unlikely to have the same good effects upon the bottom column, which could be oversized for such a nonoptimum particle diameter. The same considerations apply to the particle mass flow rate. Because the choice of both the particle diameter and the particle flow rate needs to take into account the effects upon both of the columns, it follows that a single optimization involving both columns must be preferable to two distinct optimizations that design the two columns separately.
The final goal of the optimization procedure was the minimization of the overall volume under the constraint of constant efficiency. For the immersed particle heat exchanger, the efficiency can be defined as
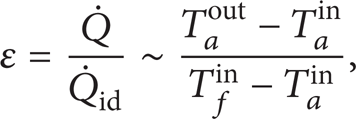
where
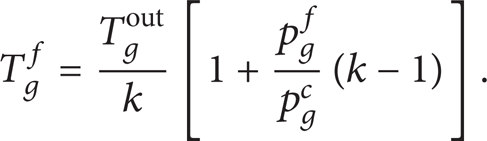
Two cases were considered; in the first one, the efficiency was set equal to 0.8, which corresponds to T f in = 1700 K; in the second one, the efficiency was set equal to 0.9, which gives T f in = 1603.4 K. Given the inlet temperature, as well as the other inlet flow conditions (pressure and mass flow rate) of sand and gas, the design procedure aimed to minimize the overall volume without reducing the assigned design efficiency. A summary of the settings employed for the two optimization designs is reported in Table 3 as well for completeness reasons (the temperatures are expressed in K). In addition, two further constraints needed to be included; namely, the overall pressure loss was constrained to be less than 0.1 bars in both columns.
Boundary conditions, objective, and constraints.

The optimization procedure employed a genetic algorithm, MogaII, which introduces the principles of evolution and genetics into optimization and search problems. Unlike the gradient based methods (see, e.g., an efficient gradient based optimization proposed in [24]), it is based on the evaluation of a set of individuals (population), which is varied at each iteration making use of operations of selection, cross-over, and random mutation. The probability of survival of new individuals depends on the corresponding value of the objective function: the best ones are kept with a high probability and the worst ones are rapidly discarded. The efficiency of the employed algorithm is due to the new elitism operator, able to preserve some excellent solutions without bringing premature convergence to local optimal fronts [25–27].
The optimization parameters are reported in Table 4 for completeness. The cross-over operator is a method of recombination where parents produce off-springs by sharing information. The aim of this operator is to obtain individuals with better characteristics while maintaining the diversity of the population. Cross-over is regarded as the main search operator in GAs, and the operator may vary between 0 (no cross-over) and 1 (only cross-over operator used during evolutionary process). The default value 0.5 was set in the present case. The probability of selection gives the probability that design configurations are not changed during the evolution. This optimization procedure was successfully tested by Amirante et al. [28] for the fluid dynamic design optimization of a hydraulic proportional valve.
Parameters of the genetic algorithm.

Starting with the initial population generated by the employed DOE algorithm (Sobol, with a number of individuals equal to 50), the algorithm repeatedly had modified the population of the individual solutions. At each step, the genetic algorithm had randomly selected individuals from the current population and used them as parents to produce the children for the next generation. Over successive generations, the population “evolved” toward an optimal solution. The evaluation of the constraints was automatically performed via CFD through the following procedures.
3D representation of 1/4 of the top column and generation of the corresponding computational grid by means of the software Gambit.
CFD simulation of the top column, with final calculation both of the pressure drop, computed as the difference in pressure between the inlet and the outlet, and of the temperature of the particles exiting the top column.
3D representation of 1/4 of the bottom column and generation of the corresponding computational grid by means of the software Gambit.
CFD simulation of the bottom column, with final calculation of the air temperature at the outlet of the bottom column and the pressure drop between the inlet and the outlet. This simulation required the temperature of the particles entering the bottom column to be assigned. As demonstrated previously, the hot particles do not undergo any significant cooling during the pressurization procedure; therefore, the injection temperature was assumed equal to the temperature of the particles exiting the top column.
Evaluation of the constraints: efficiency and pressure losses.
The CFD simulations performed by Fluent on both columns, namely, points (b) and (d), were divided in two steps: the first one aimed to verify that all the particles could fall down for gravity and escape the domain through the air inlet; if some of the particles were transported away by the gas stream, that geometry was considered unfeasible and promptly declined. Otherwise, if all particles were verified to fall down and exit the domain through the gas inlet, the second CFD computation was performed by Fluent in order to reach a good accuracy of the flow solution. The first CFD computation was stopped after 200 iterations, which were sufficient to recognize if the particles were able to fall down, whereas the second CFD process performed the following 800 iterations to reach good convergence.
The parallel processing together with the computational grid partition was employed to reduce the overall processing time. On the whole, 30 generations, and thus approximately 1500 individuals, were explored.
Table 5 reports the optimal values of the design parameters found by the optimization designs. With regard to the first design (ε = 0.8), the optimal particle diameter is equal to 0.45 mm; moreover, the particles need to be injected in both columns with the optimized mass flow rate equal to 8.95 kg/s. The resulting overall height of the heat exchanger is 6.5 m, with the maximum diameter (of the bottom column) equal to 4 m.
Optimal values of the design parameters.

With regard to the second design (ε = 0.9), the optimal particle diameter is equal to 0.4 mm and the optimal particle mass flow is 9.55 kg/s. The resulting overall height of the heat exchanger is 11 m, with the maximum diameter (of the bottom column) equal to 4.5 m. The pressure drops are negligible in both cases.
The resulting size of the IPHE is quite large in the second design, since achieving the target efficiency of 0.9 is not a trivial task and the optimizer has increased the height of both the columns to further improve the heat exchange.
The difference in diameter between the bottom column and the top one results from the different operating pressures. In fact, the lower pressure in the top column causes a lower gas density in the top column and consequently the top column works with higher gas velocity than the bottom one if the diameters are equal. Such a high velocity can be lowered only by increasing the column diameter in order to allow the particles to fall down.
Figure 17 reports the predicted particle trajectories and the associated local temperature for the optimum configuration of the bottom column (Figure 17(b)) and of the top column (Figure 17(a)); both of them are relative to the first design optimization (ε = 0.8). It results from the particle tracks that the particles, injected with homogeneous distribution, maintain this homogeneous distribution in both cases, occupying all of the available space.
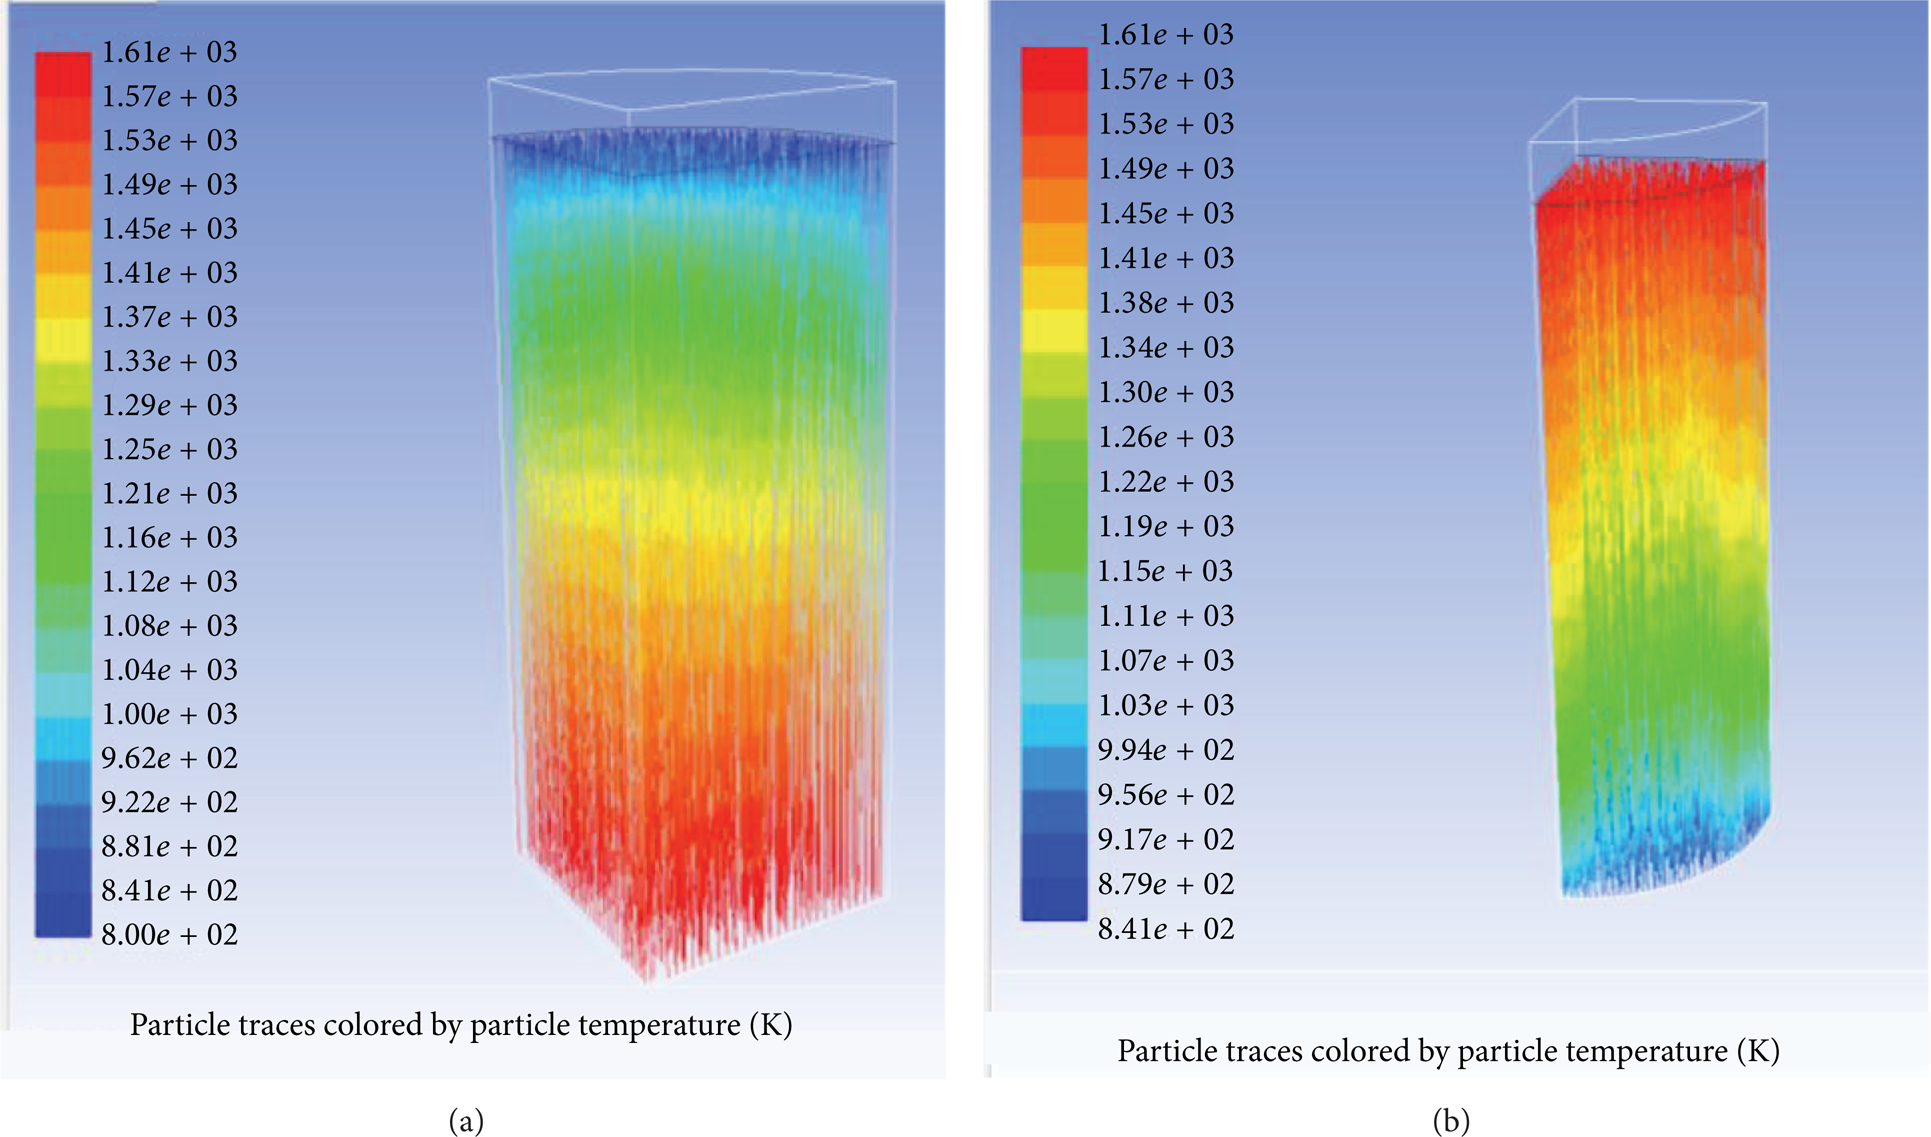
Particle tracks for the top column (a) and for the bottom column (b).
The exhaust gas temperature at the outlet of the top column is 970.4 K for ε = 0.8 and 877.8 K for ε = 0.9. Since the exhaust gas temperature at the outlet of the top column is very high in both designs, the hot exhaust gas exiting the heat exchanger can be used as hot gas stream in a heat recovery steam generator (HRSG) to produce steam that can be used to drive a steam turbine (combined cycle). It should be noted that the design with lower efficiency (ε = 0.8) leads to having exhaust gas feeding the HRSG with greater temperature than the design with higher efficiency (ε = 0.9), consequently the first design (ε = 0.8) allows the production of steam at the maximum allowable temperature of 820–870 K, with the main effect to maximize the work of the steam turbine. As a result, ε = 0.8 causes an increase in the fuel rate of the gas turbine, but this is partially compensated by the increase in the overall power of the combined cycle. For ε > 0.9, the temperature of the exhaust gas is less than 870 K and it decreases with increasing efficiency of the IPHE. In conclusion, the pursuit of the highest possible efficiency of the IPHE has no meaning for the externally fired combined cycle of Figure 16, since an increase in the efficiency causes a decrease in the temperature of steam produced by the HRSG.
11. Conclusions
The aim of this paper was the design of an immersed particle heat exchanger, suitable to external combustion plants using alternative or dirty fuels, such as biomass (including the organic part of urban solid waste, food by-products, and pruning) or coal. The immersed particle heat exchanger employs solid particles as an intermediate solid medium to transfer heat from flue gases (exiting the external combustor at low pressure) to the compressed air (exiting the compressor at high pressure); therefore a pressurization system is needed to move the solid medium. Two types of mechanical devices, capable of realizing the pressurization procedure, were proposed and described in full detail. Simple analytical models were used to show that all energy losses related to the proposed mechanical systems are negligible, even in case of very high pressure values. The energy absorbed by the conveyor to move the particles from the bottom to the top of the plant was evaluated: also this energy loss is absolutely negligible. The pressurization procedure was experimentally tested for both of the proposed mechanical solutions, showing that both devices are capable of moving all the particles from the low pressure environment to the high pressure one. However, these mechanical systems need to be improved, in order to avoid particle crushing, which had partially occurred during the experimentation. The comparison among the numerical results and the experimental data allowed the validation of the numerical model. After demonstrating the feasibility of the pressurization system and the negligible energy losses associated with such a procedure, the optimization process, aiming to minimize the dimensions of the heat exchanger by a partial 3D CFD simulation of both columns, was finally presented. This optimization design dealt with an external combustion gas turbine, characterized by high pressure ratio and high inlet temperature of the gas turbine. This choice allowed the optimization design to be tested for a very critical case. The strategy was to divide the immersed particle heat exchanger in several modules. In each module, the mass flow rate of flue gas through the top column was set equal to 10 kg/s, whereas the mass flow rate of compressed air through the bottom column was set equal to 8.5 kg/s.
The optimization process found that the resulting overall height of the heat exchanger needs to be at least 6.5 m, with diameter of the top column equal to 4 m, in order to reach the assigned efficiency of 0.8, whereas the efficiency of 0.9 requires a minimum height of 11 m, with diameter of the top column equal to 4.5 m. The exhaust gas temperature at the outlet of the top column is greater than 870 K in both cases; therefore, the exhaust gas exiting the heat exchanger can be used as hot gas stream in a heat recovery steam generator (HRSG) to produce steam at high temperature that can be used to drive the steam turbine of a combined cycle.
Footnotes
Nomenclature
Conflict of Interests
The authors declare that there is no conflict of interests regarding the publication of this paper.