
Abstract
An investigation of the dynamic deformation for an individual droplet under convective transcritical conditions is conducted with a developed deformation model. This model takes account of gas solubility in liquid phase, variable thermophysical properties, the effective conductivity accounting for convective heat and mass transfer and liquid phase internal circulation, and the disappearance of surface tension at the critical mixing point. The results show that (1) at higher ambient pressures, surface tension decreases more smoothly with the reduction of fuel mole fraction but more rapidly with the droplet surface temperature; (2) as time elapses, the drop is continuously oscillating, together with the decreasing oscillation amplitude; (3) at high ambient pressures and temperatures the maximum drop deformation occurs in the late stage of the evaporation process, while at low pressures and temperatures, it occurs in the initial stage. In addition, the drop deformation and Weber number are initially quite insensitive to the ambient temperature.
1. Introduction
In the power systems such as aircraft jet engines, diesel engines, and direct injection gasoline (GDI) engines, the injected fuel enters the combustion chamber as a spray of droplets, which then undergo a sequence of physical processes, including deformation, breakup, evaporation, and mixing with air. In the fuel-air mixing process, the drop deformation induced by the aerodynamic force caused by the relative motion between droplet and gas has a significant effect on the drop evaporation and breakup yielding increased surface area, which control the mixture preparation and thus have a strong influence on combustion, performance, and fuel consumption of engines. Generally, the temperatures and pressures in the combustion chambers can reach near- or supercritical values of the fuels. Therefore, it is required to fully understand the deformation characteristics of an evaporating droplet at transcritical and convective conditions [1, 2].
Several investigations on fuel injection and air-fuel mixing under subcritical or supercritical conditions have been presented in published literature. As the chamber pressures approach the critical pressures of the fuels, the atomization and fuel-air mixture formation exhibit a great sensitivity to pressures, temperatures, and local mixture concentrations. Tavlarides and Anitescu [3] found that injecting fuels near the supercritical region or supercritical fuel mixtures into the engine cylinders has been suggested as one way to increase engine efficiency and decrease emissions. Preheating the diesel upon injection provides better fuel-air mixing when this process is operated at the temperatures near the critical region. Segal and Polikhov [4] investigated the effects of the ambient pressure and temperature on the jet breakup. At subcritical conditions, the gas inertia and surface tension forces play dominant roles in the formation of ligaments from which the materials break off and the drops form later, but, at transcritical conditions, reduced surface tension has a significant impact on the jet surface behavior. According to Polikhov and Segal [5], in the transcritical and supercritical regimes, the diffusion rate of oxygen into acetone is two orders of magnitude faster than that at low ambient pressures. Yin and Lu [6] studied the influence of the injection temperature on the flow evolution. It was concluded that, for supercritical injection temperatures, the jet surface is more unstable when the instability waves grow up, but, for subcritical injection temperatures, the jet surface is nearly straight with the strong density stratification which suppresses the instability wave development. Rachedi et al. [7] compared the behaviors of a hydrocarbon and CO2 supercritical fluid jets. They found that their behaviors are similar in most respects: the jet swirl number has a significant effect on cone angle, while the density ratio has a minor influence on it. Kim et al. [8] conducted a computational analysis of four cryogen nitrogen jets at near-critical and supercritical pressures with their CFD code incorporated with two real fluid equations of state and dense-fluid correction schemes. Roy et al. [9] found that when a supercritical jet is injected into a subcritical environment at relatively low chamber temperatures, the droplet deformation occurs downstream beyond a 10 jet diameters distance from the nozzle.
However, although Weckenmann [10] and Oldenhof et al. [11] investigated free falling droplets experimentally at near-critical conditions, which were injected in a heated and pressurized nitrogen atmosphere, most of the existing research down to the level of the fundamental element of spray (i.e., an isolated droplet) concentrates on the droplet evaporation [12–14], and little work has been done on the droplet deformation and breakup mechanisms at transcritical and convective conditions. Several numerical methods, such as the TAB and DDB models, and experimental investigations have been presented in the published literature, involving drop breakup in a high speed air stream, isolated droplet deformation, droplet dynamics, and so forth, which are studied for atmospheric conditions far below the critical points of the fuels [15–17]. The TAB model is widely used to describe the secondary breakup of hollow-cone gasoline sprays in the case of low Weber number and the vibrational regime (slower droplets, usually at the periphery of the spray) [18–20]. In addition, in the case of high Weber number, the droplets undergo high distortion in many applications such as in diesel sprays and the drag coefficient changes as a droplet departs from the spherical shape. The distortion of a droplet can be calculated from the TAB model to account for this [21]. Shim et al. utilized a modified TAB model in comparison with experimental results to investigate the atomization characteristics of high pressure swirl spray [22]. Consequently, the TAB model was employed as part of the numerical model in this work concerning the drop deformation.
The main idea of this study is to develop a dynamic deformation model for an isolated droplet in transcritical and convective environments and to obtain a deeper understanding of the deformation and breakup physics under extreme conditions. This model considers the behavior of real gases and high pressure effects, including solubility of ambient gas in the liquid phase and variable thermophysical properties for both liquid and gas phases as functions of pressure, composition, and temperature. It also takes account of the disappearance of surface tension at the critical mixing point and the spatial gradients of thermophysical properties inside the liquid phase domain. In addition, the effective conductivity is used to account for heat and mass transfer in the gaseous boundary layer around the droplet, which also considers liquid phase internal circulation. The influences of ambient conditions on surface tension and droplet deformation were investigated with the developed model.
2. Mathematical Model
A schematic description of the developed numerical model for the deformation of an evaporating droplet is shown in Figure 1. In the figure, r s is droplet radius, u rel represents the relative velocity between droplet and surrounding gas, x is the displacement of the droplet's equator from its equilibrium position, m represents droplet mass, and t is time. During the deformation process, the droplet has a shape of an oblate spheroid with ellipsoidal cross section, while it is assumed to be spherically symmetric, having the same volume, during evaporation. Pressure remains independent of time and space due to low flow velocity in comparison with the acoustic wave, and the radiation is negligible.
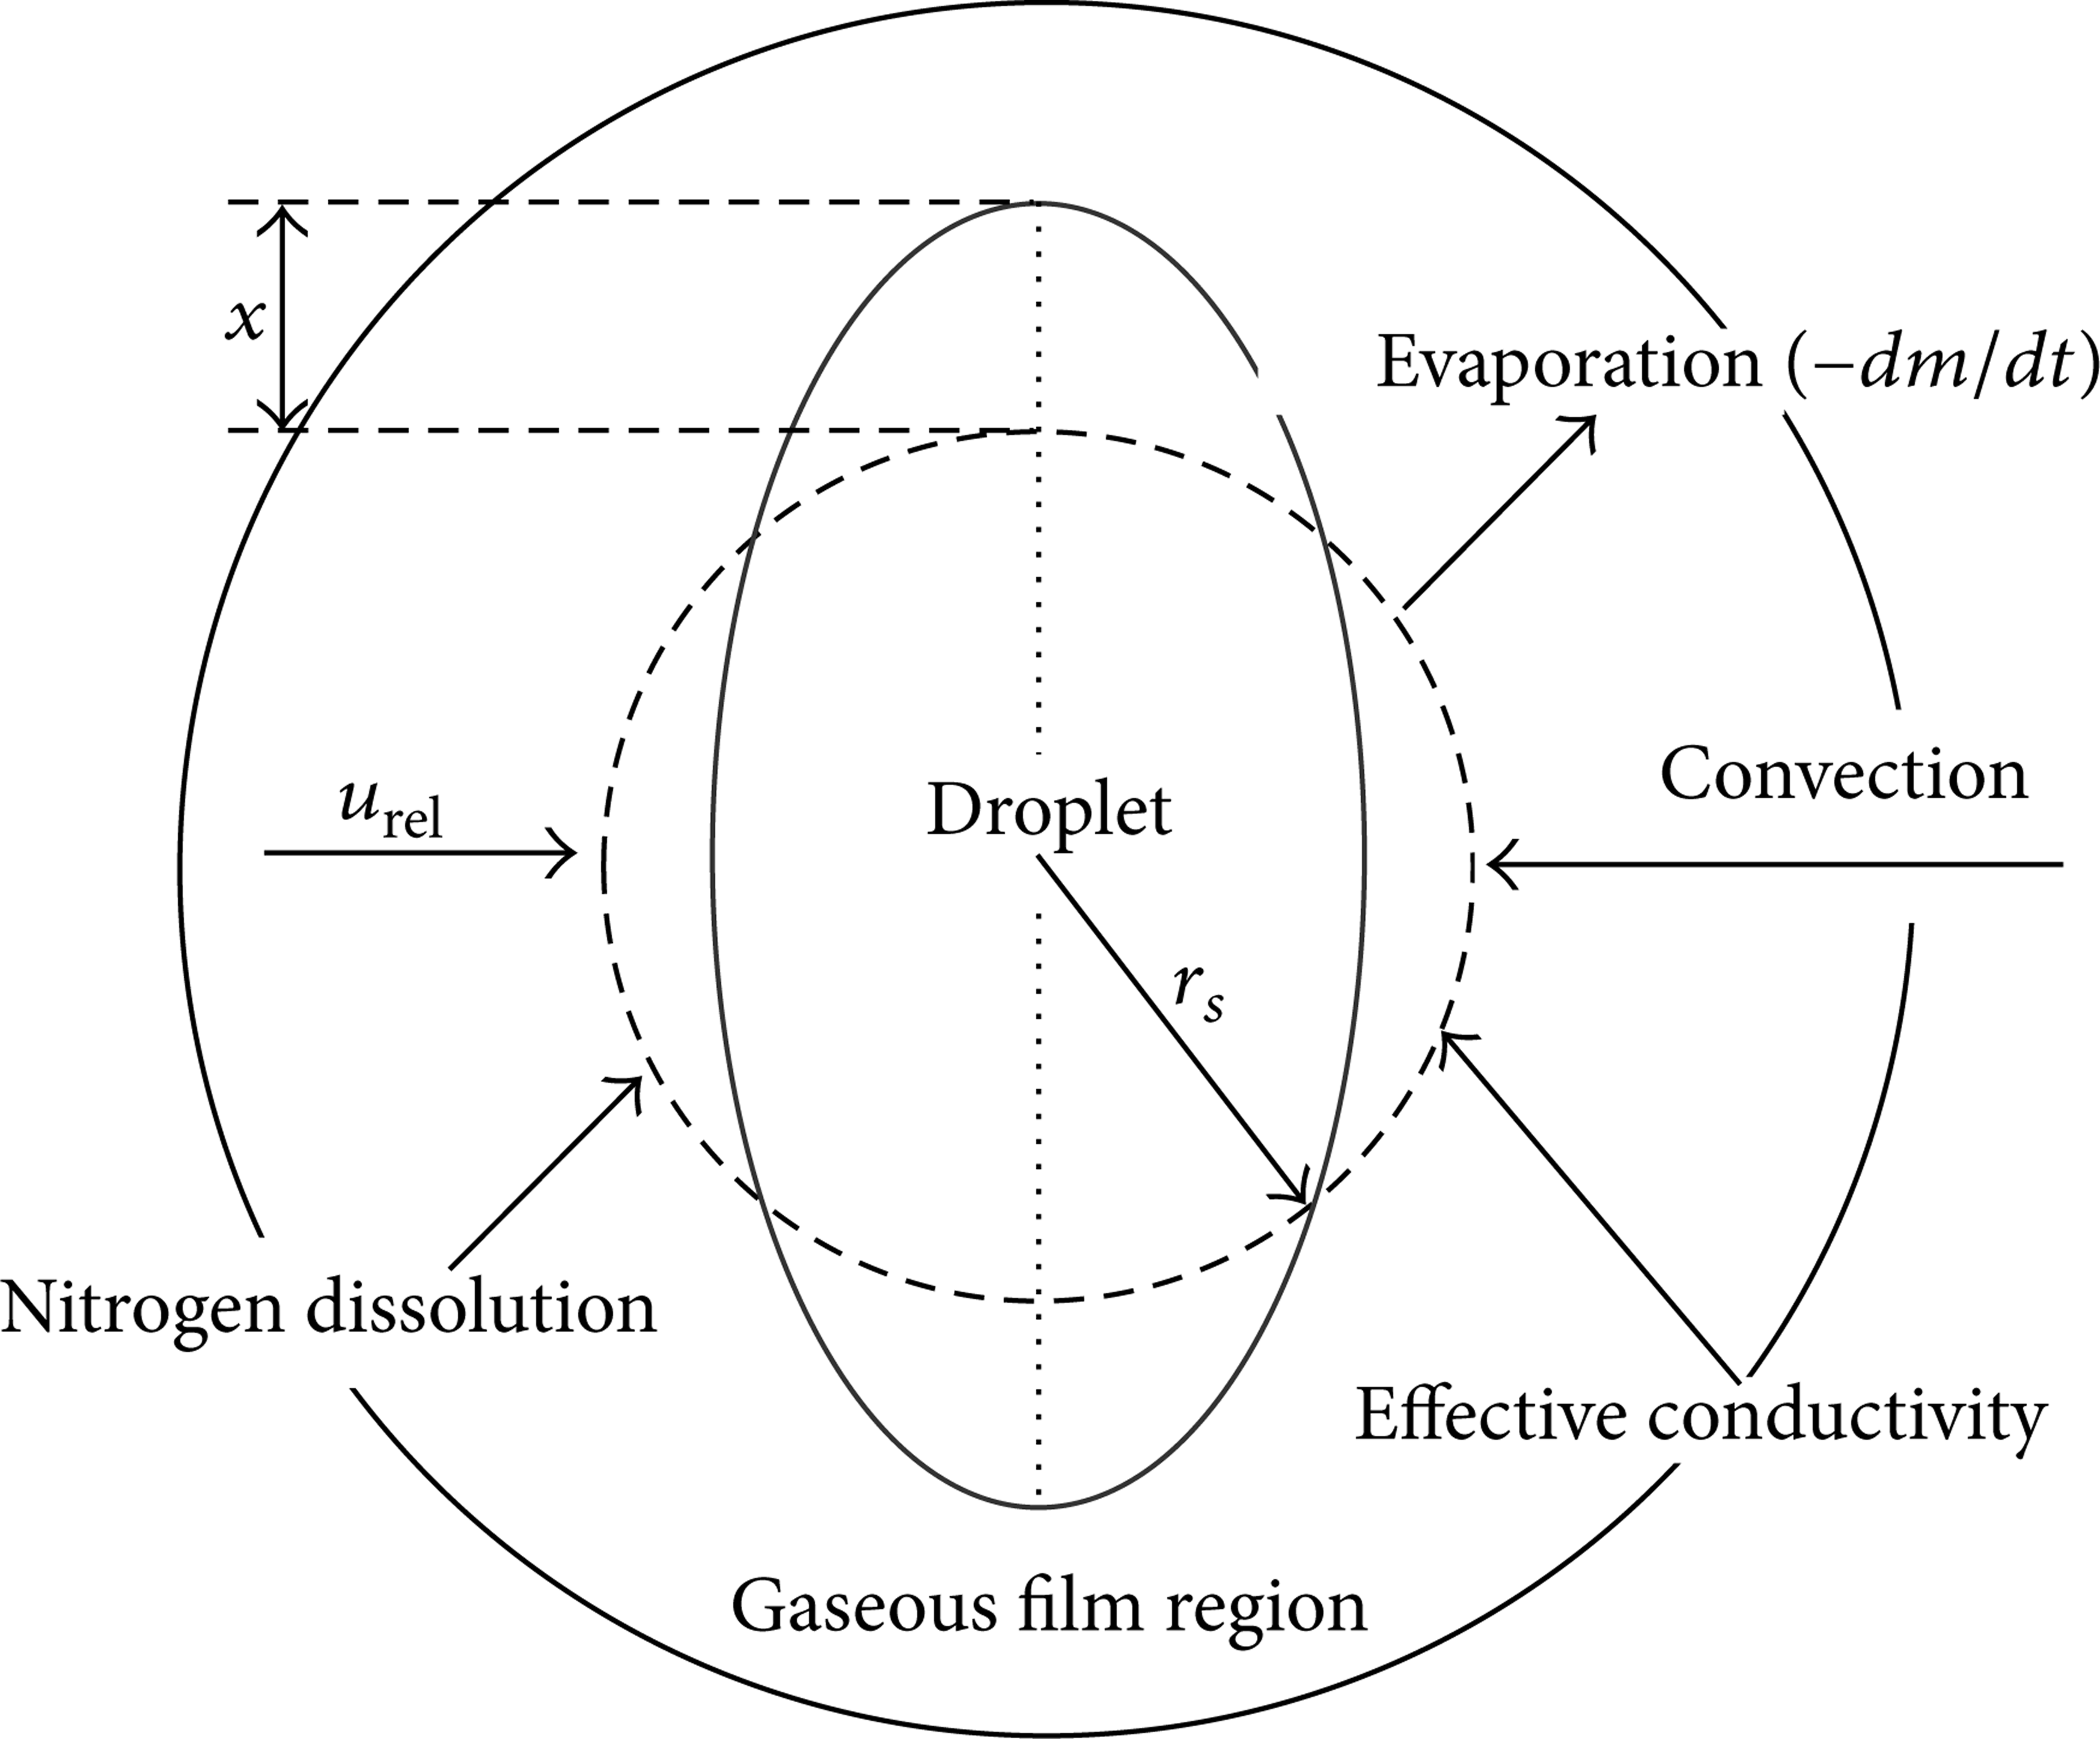
Schematic diagram of the droplet deformation and evaporation model.
The physical problem described here is the deformation of an isolated evaporating droplet which is initially at a subcritical state and suddenly introduced into a warmer convective gaseous environment with its thermodynamics state approaching the critical point. In the vicinity of the critical point, the thermophysical properties of both gases and liquids usually exhibit anomalous variations and are extremely sensitive to pressure and temperature, yielding a phenomenon commonly referred to as near-critical enhancement. The fluid characteristics are similar to those of both liquids and gases, such as gas-like properties but liquid-like densities [4]. As one is approaching the critical point, the densities of both liquid and gas phases become approximately equal. The molecule net attraction in the interface region toward the dense phase is close to zero, namely, the metastable surface [23]. In particular, the surface tension reaches zero and droplets can no longer form at the critical point. In addition, many phenomena coexist near-critical point, including rapid decrease of vaporization enthalpy, thermophysical property singularities, and strengthened dissolution of gas phase in liquid phase. Due to the latter factor, the critical point of the mixture can change dynamically depending upon the mixture properties, potentially influencing the interface between liquid and gas phases. In addition to significant decrease of liquid-gas density ratios, weakened surface tension at the liquid interface can lead to further enhanced aerodynamic interactions induced by the relative velocity between droplet and surrounding gas. All the above factors can significantly influence the drop deformation, breakup, and evaporation. As a specific example, the deformation and breakup of an isolated acetone droplet in a transcritical and convective nitrogen environment were studied. Acetone is used as the working fluid on account of existing data, which has a critical temperature T c of 508 K and a critical pressure P c of 4.8 MPa.
2.1. Governing Equations
This model considers real fluid behavior of both liquid and gas phases, the temporal variation and nonuniform distribution of thermophysical properties, high pressure effects, and solubility of inert species into the liquid phase, where radiation heat transfer is neglected. Ambient gas is assumed to be dissolved only in a very thin layer of the gas-liquid interface and thus diffusion of gas into the liquid interior is ignored. The effective conductivity is used to deal with convective heat and mass transfer in the gaseous boundary layer around the droplet, based on effective film method, which takes account of liquid phase internal circulation [24].
Energy conservation inside the droplet:

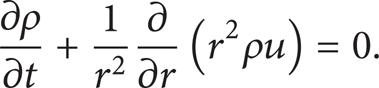
Continuity equation for liquid phase:
Liquid-gas phase energy balance:

Species conservation:

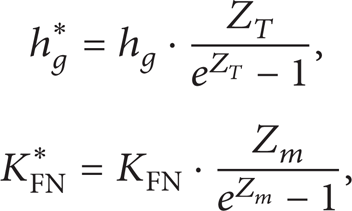
In the above expressions, T stands for temperature, r stands for the radial distance relative to droplet center, u is the radial velocity inside the droplet relative to droplet center, ρ represents density, C p is the constant pressure heat capacity, λ indicates thermal conductivity, k e indicates the effective thermal conductivity, H represents enthalpy, h g * and KFN* are corrected heat transfer coefficient of gas mixture and corrected mass transfer coefficient, W is mass flow rate, Y is mass fraction in gas phase, subscripts F and N indicate fuel and nitrogen components, subscripts g and l are gas and liquid phases, and subscripts ∞ and sf represent infinite boundary and drop surface, respectively.
Nitrogen dissolution in the liquid phase is assumed to be negligible in the droplet mass calculation. The mass rate of ambient gas divided by the total mass rate of the liquid component at droplet surface can be expressed as follows:

The corrected mass and heat transfer coefficient in (3) and (4) are calculated by
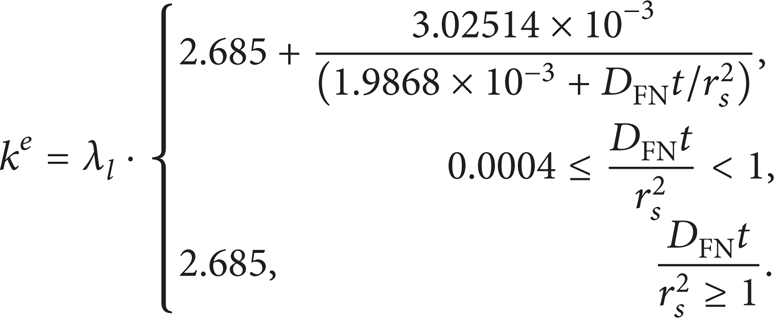
and the effective thermal conductivity k e is estimated according to Jin and Borman [24]:
Heat transfer coefficient h g for the gas mixture is expressed as

Mass transfer coefficient KFN for the gas mixture is calculated by the following equations:


Parameters Z m and Z T are determined by


where V s represents droplet volume, V represents volume, h is heat transfer coefficient, KFN indicates mass transfer coefficient, Z T and Z m are correction factors of heat transfer for high transfer rates, DFN is mass diffusivity, Nu indicates Nusselt number, Re indicates Reynolds number, Pr represents Prandtl number, μ represents viscosity, Sh is Sherwood number, and Sc stands for Schmidt number.
As expressed by (12), the evaporation rate WF (WF = − dm/dt) is proportional to Sherwood number Sh, and according to (10) Sh increases with Reynolds number Re. Consequently, it is clear that the droplet evaporation is enhanced as speed u rel of the drop increases, because Re is directly proportional to u rel .
Mass conservation of droplet:
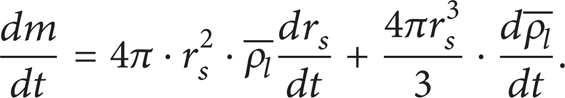
Momentum conservation:

Droplet deformation.
The TAB model is widely adopted to predict the secondary breakup and drop deformation of hollow-cone gasoline sprays at low Weber numbers and those of the periphery of engine sprays (i.e., low-speed droplets) [18–20]. Additionally, the TAB model can also be used to describe the droplet deformation and drag coefficient [21] in the case of high Weber number. Thus, the TAB model [25] is adopted in the present investigation:

Model constant C b is 0.5 and C d is 5.0. Constants CF and C k will be given shortly in Section 3.1. In Figure 1, x is the displacement of the mass from the idle state and y (y = x/C b /r s ) is the dimensionless droplet deformation. If (16) is solved for the droplet, breakup is allowed to occur for y > 1 [25]. The liquid-gas relative velocity u rel is calculated by [15]

where the initial velocity
In the above equations, P represents pressure,
2.2. Thermophysical Properties
Surface Tension and Critical Mixing Point. The mixture surface tension can be expressed as
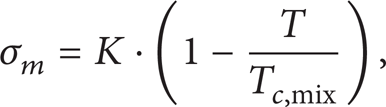
where Tc,mix is temperature of the mixture at the critical point and Constant K is taken as 57.193 to match experimental results [26] with theory.
At the critical point, both liquid phase and vapor-phase mass fractions of the fuel component at drop surface are equal. Surface tension and enthalpy of vaporization decrease to zero and the droplet surface disappears. For a binary mixture composed of pure fuel and nitrogen, the critical mixing point can be determined by [27]

where
Thermodynamic Properties. In order to describe real fluid behavior, high pressure effects, and phase equilibrium for vapor and liquid mixtures, Peng-Robinson equation of state (EOS) is adopted and can be expressed by

where a m and b m are the EOS parameters of the mixture and can be calculated from the pure component parameters of the EOS with the quadratic van der Waals one-fluid mixing rule. v stands for molar volume and R is universal gas constant. For the acetone-nitrogen binary system, the binary interaction coefficient of nitrogen and acetone is an adjustable binary parameter and is taken as 0.2086 to correlate experimental data in [28]. Peng-Robinson EOS above can be used to obtain the specific enthalpy, constant pressure heat capacity, fugacity coefficients, and so forth.
Other Physical Properties. The low pressure estimation model proposed by Chung et al. for thermal conductivities of pure components is modified with Chung et al. rules to calculate the thermal conductivity at high pressures. The liquid viscosity is estimated via the corrected method of Chung et al. accounting for high pressure and density effects [29]. The diffusion coefficient for binary gas systems is obtained from Wilke and Lee method, which adopts high pressure corrections of Takahashi method [30].
Thermodynamic properties of the gaseous mixture such as μ g and k g are evaluated with 1/3 rule [31] from the average concentration and the average temperature, which are expressed as follows:
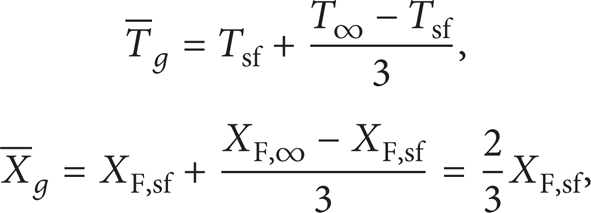
where
2.3. Boundary Conditions
All the variables are assumed to remain at their initial values at the infinite boundary, and the temperature gradient is assumed to be zero at the drop center.
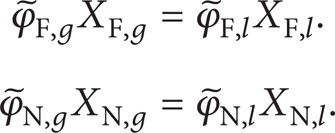
The vapor-liquid equilibrium is satisfied at the drop surface:
2.4. Numerical Scheme
An efficient numerical algorism utilizing iterative method is needed in order to solve the governing equations for liquid phase, liquid-gas interface, and gas phase. A central difference scheme is used for liquid phase energy conservation and a fully implicit scheme is adopted for transient solution. A second-order one-sided difference is used with a nonuniform grid system at the liquid-gas interface, considering extremely high gradients of thermophysical properties near the droplet surface. In this work, the numerical solution method is illustrated as follows: (1) at each time step, calculate the droplet evaporation firstly, where the drop is assumed to be spherically symmetric concerning the combined calculation of heat and mass transfer processes; (2) then resolve the droplet deformation and oscillation in this time step, where the spatial distribution of the physical properties for both liquid and gas is assumed to be unchanged. By comparing numerical results obtained at different time steps of integration, it was found out that the temporal variations of droplet deformation and evaporation rate and so forth exhibit very little difference when dimensionless time steps are smaller than 1 × 10⁻⁴. Thus, the dimensionless time step is taken to be 1 × 10⁻⁴.
3. Results and Discussion
3.1. Verification of the Model
The deformation of a free falling acetone droplet in a nitrogen atmosphere at elevated pressures and/or temperatures was predicted, where the nitrogen gas is assumed to be stagnant and the initial
Simulation conditions corresponding to experimental data.


Comparison of numerical and experimental results.
3.2. Critical Mixing Point Calculated
A key fluid characteristic yielding the disappearance or appearance of liquid/gas interface is the critical mixing point. Figure 3 presents the critical molar fraction Ycbs of acetone and the reduced critical temperature Tcr (Tcr = Tcbs/T c ) for an acetone-nitrogen system with the reduced ambient pressure P r (P r = P/P c ) ranging from 0.02 to 2.8, where Tcbs is the critical mixing temperature and T c and P c are the critical temperature and the critical pressure of acetone, respectively. The dotted line is the reduced boiling point Tbr (Tbr = T b /T c ) for P r below 1.0, where T b is the boiling point of acetone. It can be seen that Ycbs decreases sensitively with P r except for P r less than 1.0. In particular, Ycbs attains a reduction of approximately 29% at P r = 2.75. As shown in this figure, the variation curve of Tcr is similar to that of Ycbs, but Tcr changes more smoothly, with a decrease of about 3% at P r = 2.75. It shows that the component fraction Ycbs should have much more influence on physical properties such as surface tension when elevating ambient pressures. The predictions also show that, at P r less than 1.0, Ycbs reaches the value of approximately 1.0, which implies that the component fraction has almost no influence on the critical parameters. In this case, Tbr describes boiling point of pure acetone instead of critical mixing temperature Tcr, which increases with ambient pressure. Thus, Tcr is taken to be 1.0 for surface tension calculation.

Critical temperature, critical acetone molar fraction, and boiling point as functions of pressure.
3.3. Surface Tension Calculated
The effects of liquid phase molar fraction Xsf, l of acetone at droplet surface on surface tension, at various ambient pressures, are presented in Figure 4. As shown in the figure, surface tension at low pressures decreases with the reduction of Xsf, l. This is because more nitrogen which has lower surface tension compared with acetone is dissolved in the droplet surface as Xsf, l decreases, yielding reduction in surface tension of the liquid mixture. The figure also shows that surface tension varies more smoothly at higher ambient pressures. This is because the critical mixing temperature decreases with pressure and a droplet may reach the critical mixing point more easily at higher pressures. Namely, the critical point can appear at a lower temperature, which corresponds to a smaller liquid phase molar fraction of acetone. However, surface tension remains approximately independent of Xsf, l at very low pressures, especially when P r is lower than 0.2. This is because Xsf, l is approximately equal to 1.0 in this case, indicating that the droplet behaves as a single component droplet, which is different from results at high pressures (see Figure 3).

Influence of molar fraction of liquid acetone at droplet surface on surface tension at different pressures.
Figure 5 shows the influence of ambient pressures and droplet surface temperatures (Tsf/T c ) on surface tension. Surface tension decreases with the droplet surface temperature, while the decrease in surface tension is more rapid in the case of higher ambient pressures. This is due to the fact that, as already mentioned above, it is easier for the drop to reach the critical mixing point at higher pressures.

Influence of droplet surface temperature on surface tension at different pressures.
3.4. Dynamic Droplet Deformation and Weber Number
Figures 6, 7, 8, 9, and 10 show the time (t/(rs02ρ
c
Cpref/λref)) histories of droplet deformation y and Weber number We (We = ρ
g
urel2r
s
/σ
m
) at various ambient pressures, where the values of u
rel
are set at 2, 5, 8, 30, and 100 m/s, respectively. rs0 is the initial radius of the droplet, ρ
c
is the critical density of the fuel, and Cpref and λref are isobaric specific heat capacity and thermal conductivity of the fuel at 293 K and 0.1 MPa, respectively. T
r
(T
r
= Tamb/T
c
) stands for the reduced ambient temperature, where Tamb is ambient temperature. The initial droplet diameter is 40 μm, and ambient temperature and initial drop temperature are 508.1 K and 300 K, respectively. It is assumed that the droplet is spherical and does not oscillate initially; that is, the initial deformation yt = 0 and the initial oscillation
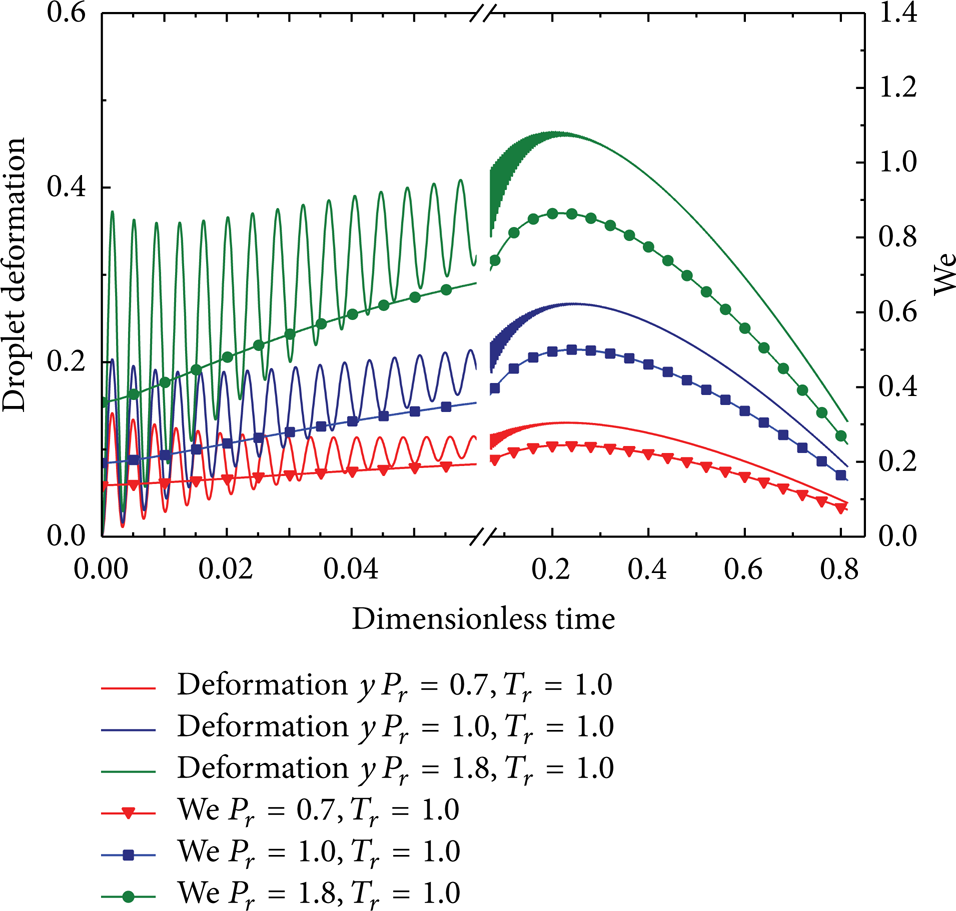
Temporal variations of droplet deformation and Weber number at different ambient pressures (u rel = 2 m/s).

Temporal variations of droplet deformation and Weber number at different ambient pressures (u rel = 5 m/s).

Temporal variations of droplet deformation and Weber number at different ambient pressures (u rel = 8 m/s).

Temporal variations of droplet deformation and Weber number at different ambient pressures (u rel = 30 m/s).

Temporal variations of droplet deformation and Weber number at different ambient pressures (u rel = 100 m/s).
According to Figures 6–10, the variation curves of droplet deformation y appear to be fluctuant, indicating that the drop is continuously oscillating as time elapses. It was found that the amplitude of the oscillation is gradually decreasing with time and becomes quite small during the late period. This is because the viscous damping time scale t
d
As shown in Figures 6–10, the predicted droplet deformation increases apparently with u rel and ambient pressure due to Weber number enhancement. The droplet will be able to breakup (y > 1) at P r higher than 0.7 when u rel is faster than 8 m/s but will not able to breakup even at a high P r (P r = 1.8) when u rel is slower than 2 m/s. However, at very high drop speeds such as u rel = 100 m/s, the TAB model is only capable of predicting the drop deformation instead of drop breakup as is mentioned above. In this case, the droplet breakup occurs at different levels of the droplet deformation. It was also found that, the maximum deformation occurs in the later stage for P r exceeding 1.0 but occurs in the initial stage for P r lower than 0.7. This result implies that thermophysical properties of both liquid and gas are quite sensitive to pressure variations at high pressures and temperatures, which yields a more rapid increase of Weber number. Additionally, the maximum deformation during the later stage appears approximately at the same dimensionless time under different conditions. This is due to the combined effects of the reduced droplet diameter and the variation of physical properties, such as surface tension and gas density. It can also be seen that the droplet breakup occurs in the first oscillation cycle for u rel faster than 8 m/s. In this case, the drop is rapidly broken up at the beginning, and it is almost not affected by the heat and mass transfer.
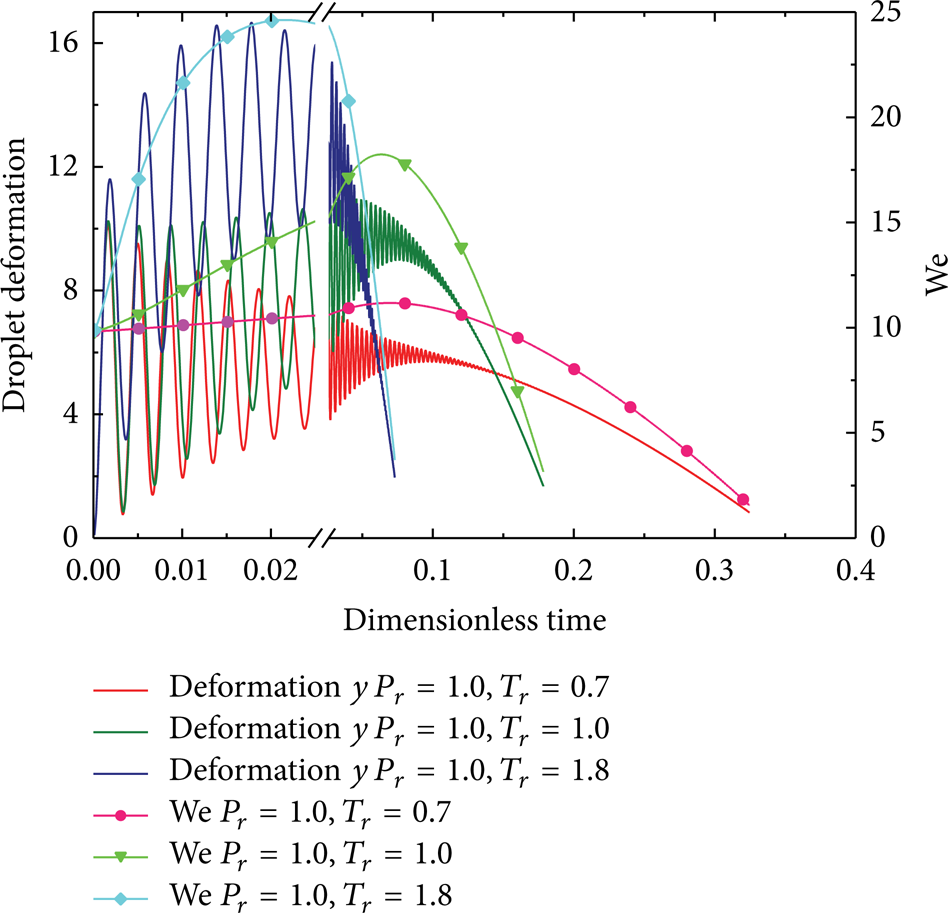
Figures 11, 12, 13, 14, and 15 show the time histories of y and We at various ambient temperatures, where the values of u rel are set at 2, 5, 8, 30, and 100 m/s, respectively. The reduced ambient pressure P r is 1.0, with other parameters having the same values as used in Figures 6–10. It was found that y and We at various ambient temperatures are quite similar to those predicted at various pressures. y and We seem to be unaffected by the ambient temperature initially, due to the fact that the physical properties of both liquid and gas are hardly affected by high heat and mass transfer rates during a very short period. With a constant pressure (P r = 1.0), both y and We vary more quickly at high ambient temperatures (e.g., T r = 1.8), and the peak deformation per oscillation cycle is rapidly increasing until its maximum is attained. Therefore, the results indicate that, for very high ambient temperatures, thermophysical properties of both the droplet and the gas exhibit a much greater sensitivity to changes in ambient temperatures. The droplet can break up at T r higher than 0.7 when u rel is faster than 8 m/s but cannot break up even at a very high ambient temperature (T r = 1.8) when u rel is slower than 2 m/s. Also, the drop breakup, if possible, appears only in the first oscillation cycle.

Time evolution of droplet deformation and Weber number at different ambient temperatures (u rel = 2 m/s).

Time evolution of droplet deformation and Weber number at different ambient temperatures (u rel = 5 m/s).

Time evolution of droplet deformation and Weber number at different ambient temperatures (u rel = 8 m/s).
Time evolution of droplet deformation and Weber number at different ambient temperatures (u rel = 30 m/s).

Time evolution of droplet deformation and Weber number at different ambient temperatures (u rel = 100 m/s).
3.5. Droplet Breakup
Considering that the TAB model is mainly used to predict the secondary breakup for low Weber numbers (in the bag-type breakup regime), the characteristics of droplet breakup for relatively low drop velocities are studied in this section. The simulation results indicate that the droplet breakup cannot occur if T r , P r , and/or u rel are relatively low. Figure 16 shows the minimum T r required for an acetone droplet to break up as a function of P r . u rel is set at 5, 8, and 30 m/s, respectively, and initial drop temperature is 300 K. With regard to the conditions below the curve, the droplet breakup cannot occur during the evaporation process at a specific u rel . On the contrary, the breakup can appear under conditions above the curve. In order to enable the droplet breakup, the minimum T r decreases with P r . In addition, both the required T r and P r decrease when improving the drop velocity u rel .

Minimum ambient temperature required for droplet breakup versus ambient pressure at 5, 8, and 30 m/s u rel , respectively.
Ratios of the breakup time to droplet lifetime versus ambient pressure P r at various ambient temperatures T r are shown in Figure 17. u rel is equal to 5 m/s and initial drop temperature is 300 K. According to Figure 17, the ratio reduces as T r and P r increase. It shows that, in comparison with the evaporation process, the breakup occurs much earlier when increasing T r and P r , due to enhanced aerodynamic interactions caused by anomalous variations of thermophysical properties. The drop will break up immediately at the beginning, when T r and P r are high enough.

Ratio of droplet breakup time to lifetime versus ambient pressure at different ambient temperatures.
4. Conclusion
The dynamic deformation of an isolated droplet under convective transcritical conditions was studied numerically. The new deformation model was validated with the existing experimental results. According to the numerical results, the following conclusions are drawn.
In the case of higher ambient pressures, the surface tension reduces more smoothly with the fuel mole fraction and more rapidly with the droplet surface temperature.
Weber number increases continuously in the initial period and then decreases rapidly. Also, the drop exhibits continuous oscillations as time elapses, with the accompanying amplitude reduction.
The ambient temperature has almost no influence on the drop deformation and Weber number initially. The maximum deformation occurs in the later stage for high pressure levels (e.g., P r exceeding 1.0) but occurs in the initial stage for low pressures (e.g., P r lower than 0.7). When the ambient pressure (P r = 1.0) keeps constant, both y and We change very rapidly at high temperatures (e.g., T r = 1.8), and the peak deformation per oscillation cycle is increasing continuously until its maximum is reached.
The minimum ambient temperature required for drop breakup decreases with the ambient pressure. In addition, both the required ambient temperatures and pressures for breakup decrease when increasing the drop velocity.
Footnotes
Nomenclature
Conflict of Interests
The authors declare that there is no conflict of interests regarding the publication of this paper.
Acknowledgment
This work was supported by the Beijing Natural Science Foundation (3132021) and the National Natural Science Foundation of China (50606014).