
Abstract
This paper is concerned with experimental investigation of the linear opening-pressure drop (L−ΔP) relationship of new valve core in managed pressure drilling (MPD). Based on the linear L−ΔP relationship in theoretical results, the actual L−ΔP relationships are obtained by testing the flow rate, displacement of the valve core, and pressures at the import and export. Under all three working conditions, the theoretical L−ΔP relationship almost agrees with the experimental result, and the accuracy of the theoretical design is validated. In addition, the flow coefficient (C v ) is also tested in the experimental process to judge the throttling characteristics of the new valve core and the proper working conditions.
1. Introduction
Throttle valve works as a fluid velocity regulator and a wellhead pressure controller in managed pressure drilling (MPD) [1, 2]. Valve core is the key component in throttle valve because it is in direct contact with the drilling fluid and can adjust the flow area (Figure 1). Under certain working conditions (fixed flow rate, density, and viscosity), the actuator defines the flow area by changing the position (opening size) of valve core, which in turn helps obtain the ideal wellhead pressure [3]. That is to say, the geometrical structure of valve core equals the exact relationship of opening size-wellhead pressure under certain working condition [4, 5]. In other words, the throttling characteristics of one throttle valve could be generally determined once the geometrical structure of valve core is ascertained.
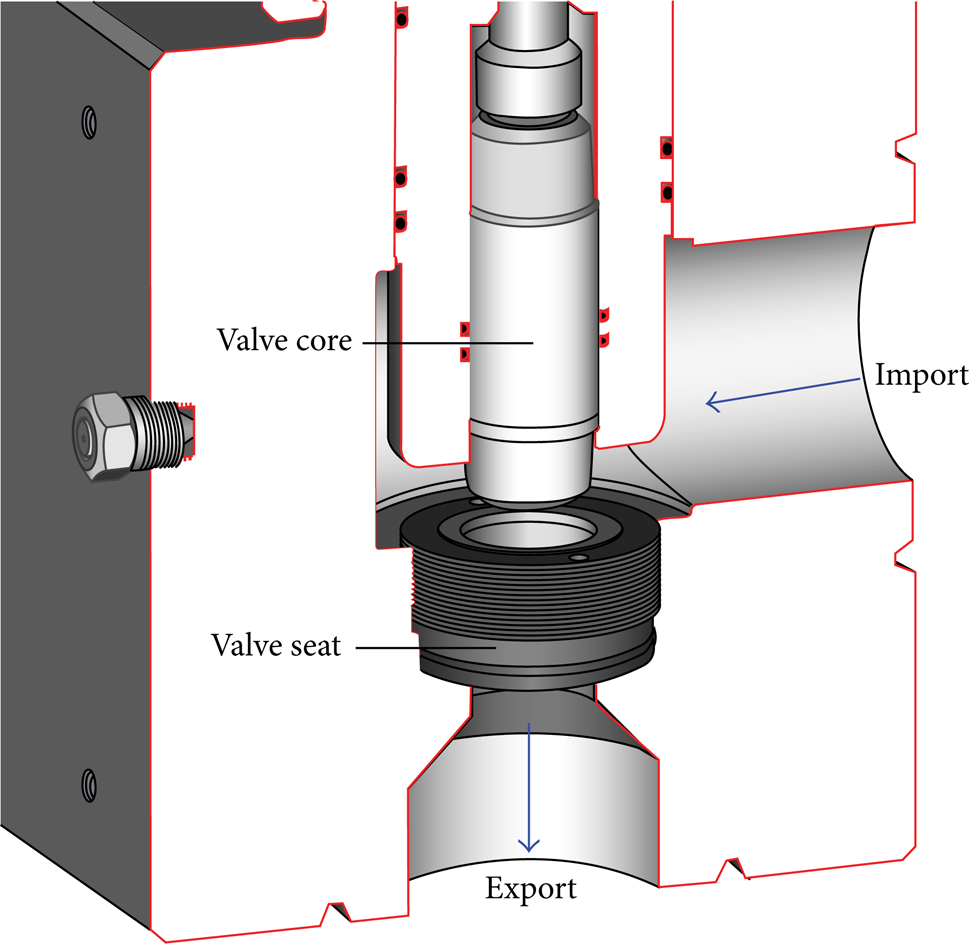
Internal structure of throttle valve.
Many advanced valve cores (needle, wedge, cylindrical, cage sleeve, hole plate, etc.) are widely used now, but few of them could be used in MPD due to the extremely atrocious working conditions (high temperature, high pressure, and mud erosion) [6, 7].
The cylinder valve core is one of the most stable and widely used valve cores in mud MPD. It eliminates problems such as erosion damage to the top end of needle core [8] and short service life and blocking of cage sleeve core and hole plate core under mud condition [9]. In addition, the regular geometry of the cylinder valve core allows for better processability and simpler assembly structure [10]. In this case, a special cylinder valve core for MPD has been developed by T3 Energy Services and Expro International Group Ltd. [10], which has been widely used by Schlumberger, Weatherford, Optimal, and other oil companies. The flow coefficient (C v ) of the new valve core changes with a linear relationship in the range of 30%–70% opening size, but the L − ΔP relationship of the new throttle valve changes nonlinearly, which means this valve core cannot meet all working conditions in MPD [11, 12]. If a new valve core with linear L − ΔP relationship is developed, C v will no longer be the only parameter from which the MPD control system calculates theoretical pressure drop, because theoretical pressure drop can also be calculated directly from the opening size (L) of the valve core. Hence, there is another point of reference for accurate pressure control and the control system simplification can be achieved.
In this case, Fu et al. [13] designed a new valve core which meets linear L − ΔP relationship under certain working conditions. Although the linear L − ΔP relationship had been validated in mathematical calculation and numerical simulation, the actual performance of the new valve core remains to be experimentally verified.
The present study aims to experimentally investigate the actual L − ΔP relationship of the new valve core. Flow rate, displacement of the valve core, and pressures at the import and export are tested in the experiment, and then the obtained L − ΔP relationship would be compared with the theoretical results.
It should be pointed out that, other than the L − ΔP relationship, C v is another important parameter in this study. C v refers to the volume flow or the mass flow of the fluid through the valve per unit time, and a higher value of C v means less pressure loss when fluid flows through the valve [14]. Since C v is an inherent parameter which does not change with working conditions, it can be used to judge the throttling characteristics of the new valve core and the proper working conditions. Furthermore, C v curves under different flow rates should be almost the same if the experiment is scientific and rational.
2. New Valve Core Proposing Improvement in Prior Work
Based on the achievements in Fu's study [13], the design parameters of the new valve cores are shown in Table 1. The theoretical profile curve of the new valve core, which meets linear L − ΔP relationship, is shown in Figure 2.
The design data of the new valve core.

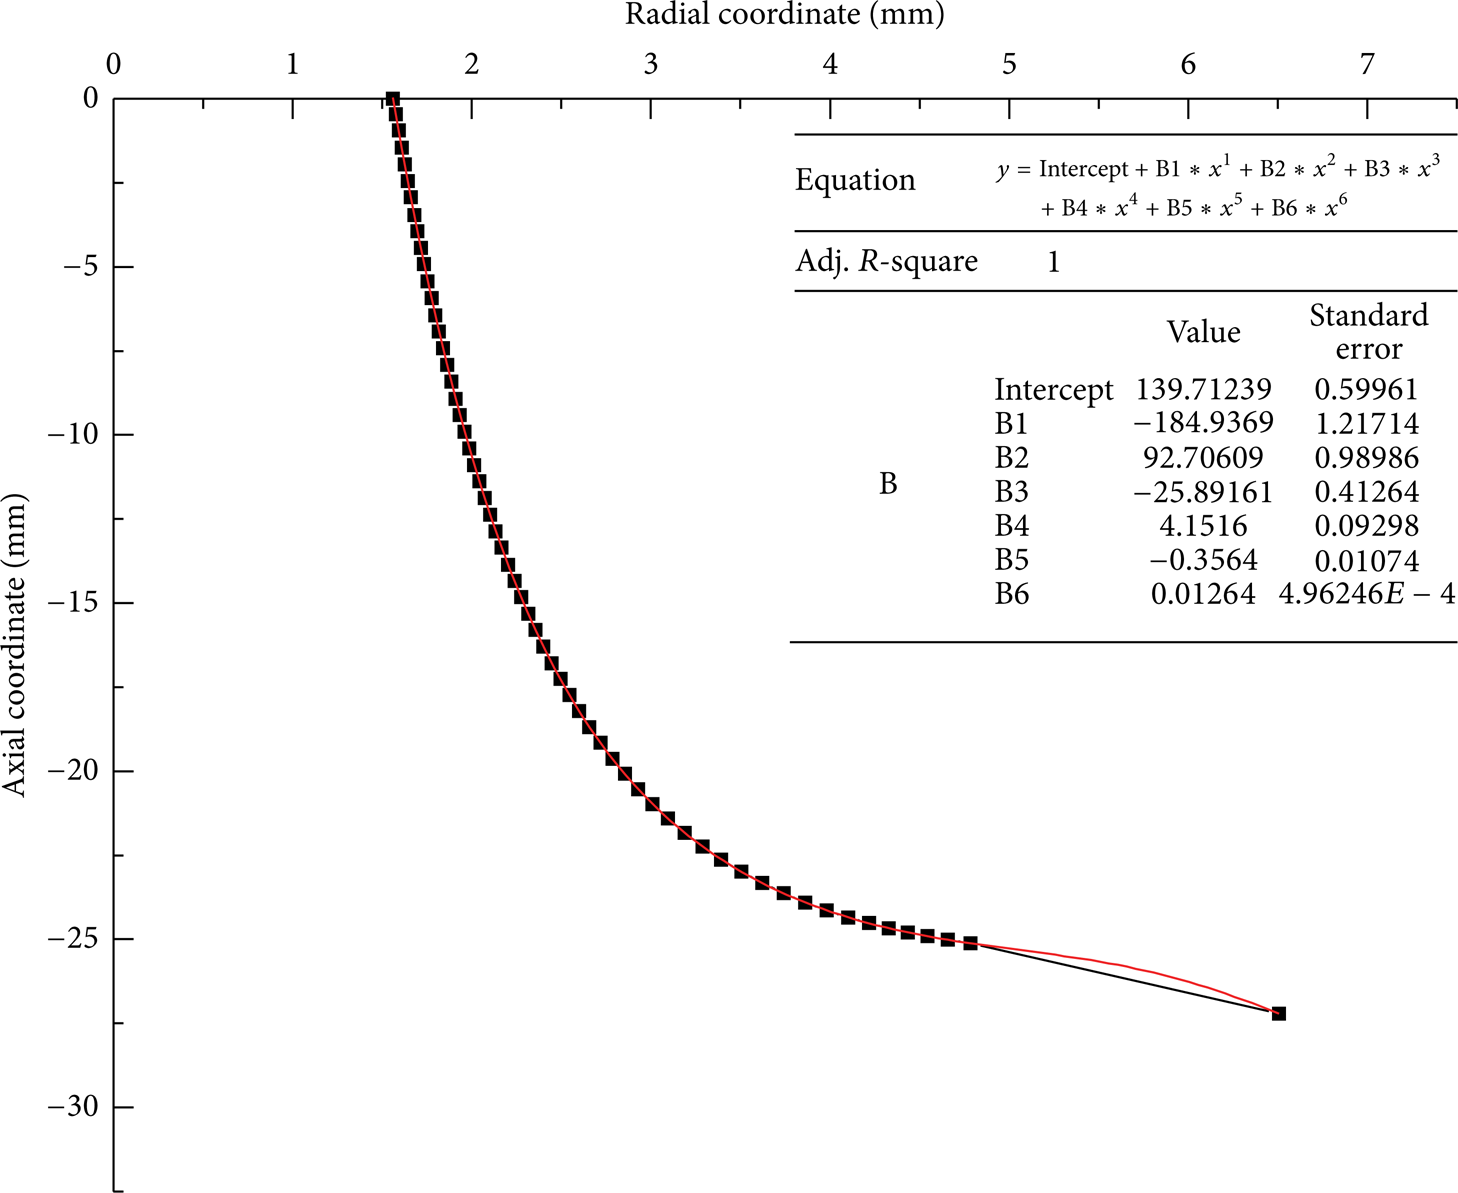
The valve core fitting curve.
3. Experimental Setup and Error Analysis
The actual L − ΔP relationship of the new valve core will be tested under three different diesel engine speeds (700 r/min, 800 r/min, and 900 r/min), corresponding to three different theoretical flow rates (65 m3/h, 78 m3/h, and 90 m3/h). Figure 3 provides a schematic view of the setup adopted to obtain the experimental data required in the present study. Displacement sensor with accuracy within 0.08% is installed on the valve stem to detect the opening size (L) of the valve core. Pressure sensors with accuracy within 0.5% are installed at the import and the export to detect the pressure drop (ΔP). Electromagnetic flowmeter with accuracy within 0.5% is selected to detect the actual flow rates (Q A ) because of the high-speed fluid and the existence of impurities. Then the actual L − ΔP relationship under different flow rates can be obtained.

Experimental schematic.
In order to improve the control precision as much as possible, worm and worm wheel driven by hydraulic motor are used as the actuator. Since the plunger pump outputs are with obvious and regular fluctuation and in order to avoid errors resulting from unsynchronized signal, data acquisition card is synchronized to acquire pressure, flow rate, and displacement data. In addition, an agitator is installed in the water tank to keep the fluid homogeneous because calcium chloride and clay are added into the water tank to increase the fluid density.
The valve core used in the experiment is shown in Figure 4 and it has been measured by 3D coordinate measuring machine to verify the agreement of actual size and theoretical size. 28 points along the opening direction of the valve core are measured and the actual diameters (D A ) of the valve core are compared with the theoretical diameters (D T ) in Figure 5, in which good agreement is easily observed. Furthermore, the machining error ratios ((D A − D T )/D T ) of the valve core are shown in Figure 6, and undoubtedly the machining precision can meet the accuracy requirement because the largest ratio is less than 0.02.

The new valve core used in experiment.

Comparison of D T and D A .
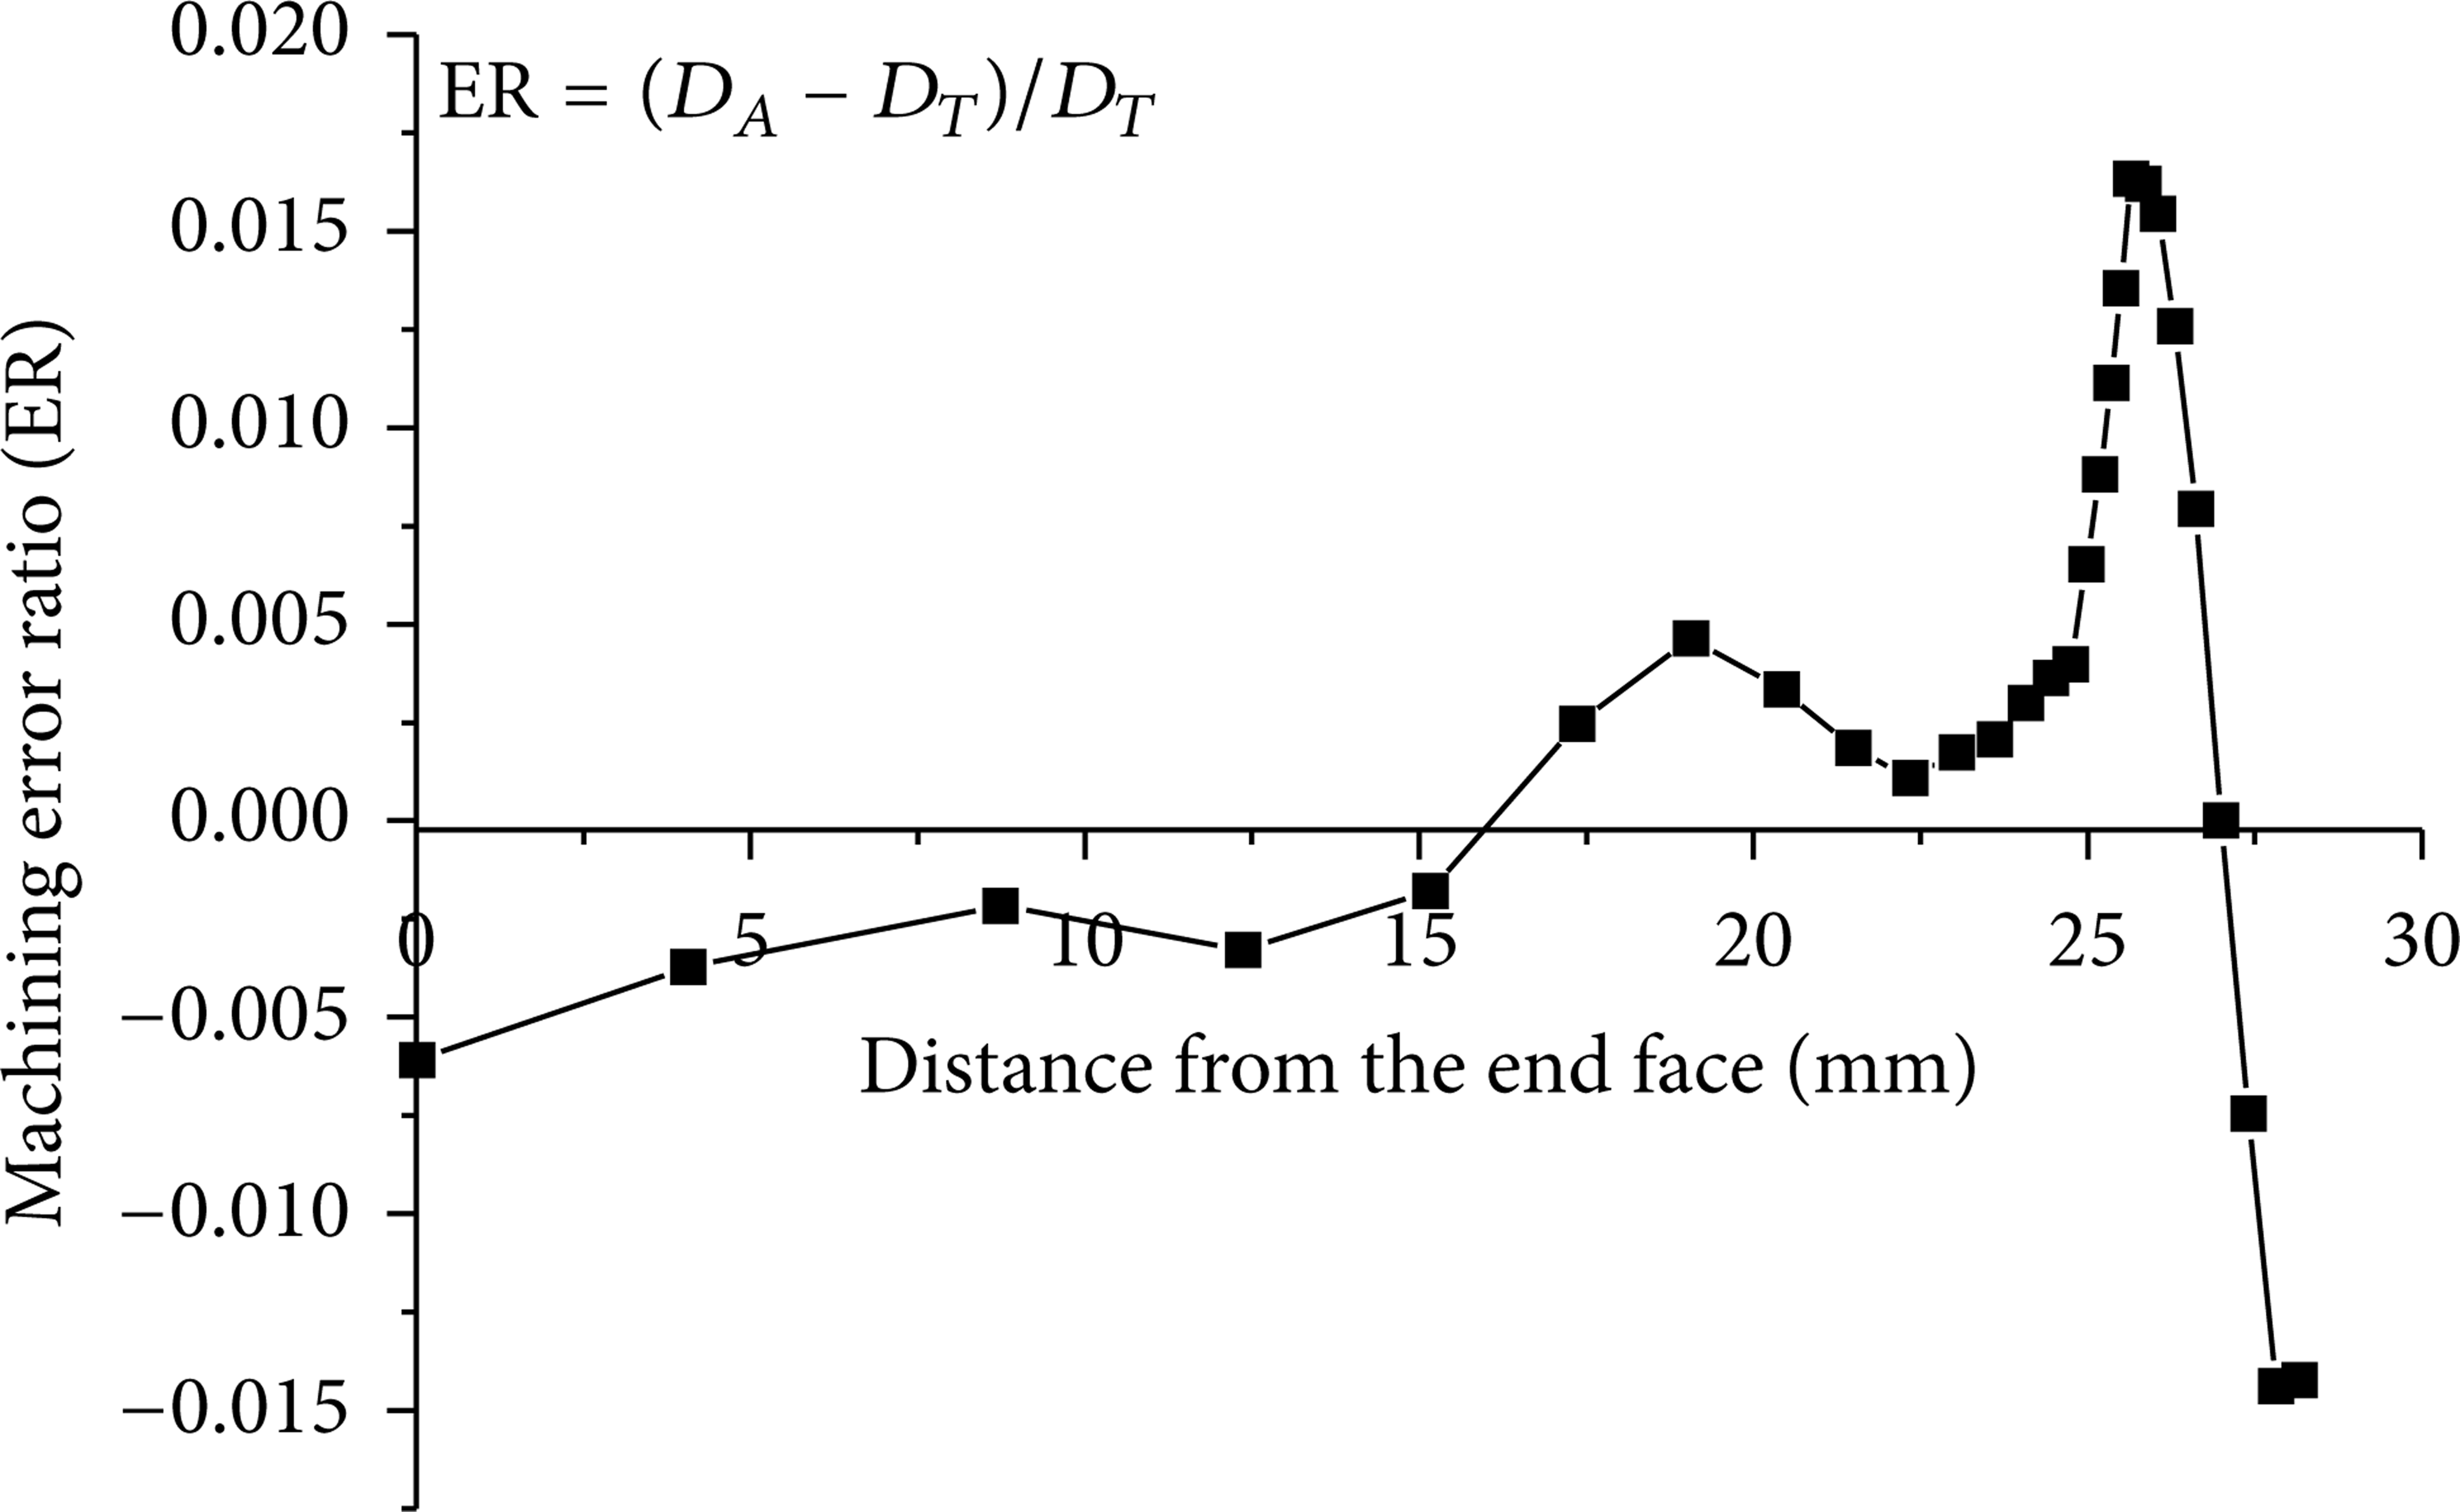
Machining error ratio.
Before commencement of the experiment, all the sensors have been calibrated. In addition, in order to eliminate errors due to sedimentation, fluid density in the water tank must be retested before the experiment begins. Then the pump is operated for five minutes to reduce gas content of the pipeline. During this process, the working state and response speed of sensors can be checked by adjusting the hydraulic station and the plate valve. The experiment is ready to start if all the equipment is in the proper working conditions.
All the measures proposed above can reduce the possibility of errors, but many details in the experiment might still result in errors. First of all, the pressure drop is very sensitive to the flow area formed by valve core and valve seat. Though the difference between D A and D T is very small, it may cause obvious error in pressure drop. Second, the output flow of plunger pump is constant in theory, which would not be effected by the flow area, but the real situation might be different and flow rate variation might exist. This problem will be verified in the first part of the experiment. Moreover, the sensors were calibrated under steady pressure, but their actual working states under high and changing pressures remain unknown, especially when the flow area changes at the same time. In this case, data recording cannot be started before the sensors’ displays are stable. Finally, a large percentage of fluctuation in the output flow can be reduced by the pressure compensation device in the pump and the synchronous sampling method, but the stabilities of pressure and flow rate are still likely to be affected. Hence, the data recording process needs to be continued for several seconds and the recorded data needs to be periodically filtered and averaged.
4. Results and Discussions
The real working conditions, including flow rates and fluid density, firstly must be recorded in order to get an accurate L − ΔP relationship. Figure 7 shows the theoretical flow rates (Q T ) and actual flow rates (Q A ) under three different diesel engine speeds. The same as an experience-based judgment, Q A are smaller than Q T , and Q A gradually increase with the enlarging of flow area, from 61.7, 75.35, and 87.8 to 64.24, 77.4, and 90.2, respectively. These differences might result from slight leakage in the seals and tiny decrease in diesel engine speed. In addition, flow variation percentage ((Q F − Q A )/Q F , Q F : flow rate when the valve core is fully opened) is shown in Figure 8 and there is a gradual upward trend with enlarging of the opening size. Since the largest percentage in Figure 8 is only 0.682%, the errors resulting from flow rate variation could be ignored and Q F can be used in the calculation below. In addition, the output values of the displacement sensor, pressure sensors, and flowmeter remain stable within an accuracy of 0.1 mm, 0.2 Mpa, and 0.5 m3/h, respectively; that is to say, the obtained data completely meet the accuracy requirements after being periodically filtered and averaged. On the other hand, the actual fluid density is determined to be 1682 ± 5% kg/m3, slightly smaller than that used in the theoretical design in Fu's study (1700 kg/m3) [13].
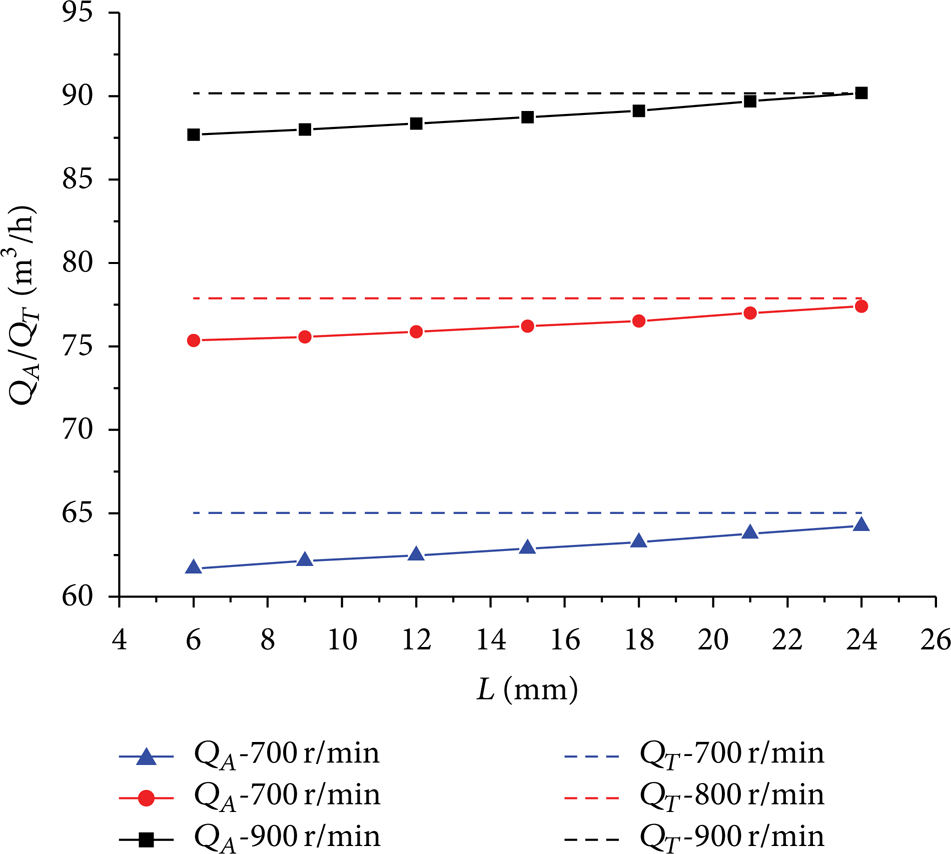
Theoretical and actual flow rates.

Flow variation percentage.
As previously mentioned, five groups of recorded data, including the import pressure (PIM), export pressure (PEX), Q A , and opening size of valve core (L), are periodically filtered and averaged, and then the actual L − ΔP relationships of the new valve core under different flow rates (ρ = 1682 ± 5% kg/m3) are obtained.
The experimental L − ΔP relationship of the new valve core under three different flow rates is presented in Table 2. As it shows, the overall pressures obviously increase with the climbing of the flow rates. PIM tapers with increase in opening of valve core (L), but there is almost no change in PEX as the export is connected to the water tank.
Experimental results (ρ = 1682 ± 5% kg/m3).

The final results of L − ΔP relationship under three flow rates are shown in Figure 9, including the theoretical results (PD T ), simulation results (PD S ), and experimental results (PD E ). Evidently, the linear L − ΔP relationships are proved in all three groups of experimental data and the flow rate variation does not affect them. Furthermore, the linear fittings (LF) of the experimental results are shown in Figure 10, in which the maximal standard error of intercept and slope is 0.29338 and 0.01599, respectively, up to the requirement of experimental accuracy.

Results comparison of L − ΔP.

Linear fitting of experimental results.
It is noted that the pressures in experimental results are approximately 5% higher than that in simulation, although Q A is slightly lower than Q T , indicating larger fluid resistance than figures from simulation model. This might have been because the simulation neglected fluid resistance of the downstream pipeline, as well as a simplification of the simulation model. On the other hand, the pressures in the simulation results are a little higher than the theoretical ones. Similarly, resistance of the valve chamber might be the primary cause, because the mathematical calculation considers the flow area only and all other structures in the throttle valve are ignored.
Based on the L − ΔP results, C v curves under the three flow rates could be obtained with formula (1). C v curves should be almost the same if the experiment is scientific and rational and they will be used to judge the throttling characteristics of the new valve core and the proper working conditions. Consider
where C v (m3) is the flow coefficient, Q (m3/h) is the flow rate, (g/cm3) is the fluid density, and ΔP (100 KPa) is the pressure drop [15, 16].
As shown in Figure 11, good agreement is visually observed when flow rate reaches 77.4 m3/h and 90.2 m3/h, indicating the rationality and validity of the experiment and the proper working conditions (Q A ≥ 77.4 m3/h). However, C v curve under 64.2 m3/h shows remarkable rise when the opening size (L) is larger than 14 mm. It means that flow rates equal to or less than 64.2 m3/h could not satisfy the working requirement of the new valve core.

Flow coefficient (C v ) from experimental results.
5. Conclusions
In this paper, we have acquired an experimental verification about the linear L − ΔP relationship of a new valve core in MPD. Good agreements are observed between numerical results and experimental results, indicating that the preliminary design of a new valve core that aims for a linear L − ΔP relationship is appropriate.
The linear L − ΔP relationship of the new valve core is stable in the experimental data because it was not affected by flow rate variations, while overall pressure drops increase significantly with the rise in flow rates. In addition, the experimental results are slightly higher than theoretical calculation and numerical simulation because of the extra resistance of downstream pipeline and the internal structures of valve chamber. Finally, the experimental results show that the new throttle valve is inapplicable to flow rate below 77.4 m3/h.
Footnotes
Nomenclature
Conflict of Interests
The authors declare that there is no conflict of interests regarding the publication of this paper.
Acknowledgments
This endeavor is financially supported by the Petroleum Engineering Technology Research Institute of Sinopec and National Natural Science Foundation of China (no. 50905149).