
Abstract
Frequent accidents have occurred in coal mine enterprises; therefore, raising the technological level of coal mine safety monitoring systems is an urgent problem. Wireless sensor networks (WSN), as a new field of research, have broad application prospects. This paper proposes a Web of Things- (WoT-) based remote monitoring system that takes full advantage of wireless sensor networks in combination with the CAN bus communication technique that abstracts the underground sensor data and capabilities into WoT resources to offer services using representational state transfer (REST) style. We also present three different implemented scenarios for WoT-based remote monitoring systems for coal mine safety, for which the system performance has been measured and analyzed. Finally, we describe our conclusions and future work.
1. Introduction
The natural conditions of coal mines are highly complicated, and mining conditions are extremely capricious. Many disasters can occur in mines, which increases the insecurity of coal mining and easily leads to major accidents, causing extreme difficulty in establishing safety. The structure of a coal mine environment is complex; the space for branch tunnels is limited, and the directions of branch tunnels are not fixed. Wired transmission systems are often installed only in the main tunnel, which substantially limits the expansion of the network. When underground mining advances continuously, no wired network can be established in real time; naturally, it is thus impossible to monitor these dangerous regions in real time. In addition, due to cost and maintenance limitations, no safety monitoring systems are installed in abandoned underground tunnels, creating a great potential safety hazard. Thus, for coal mine safety monitoring and control, there are still many shortcomings in wired monitoring and control that should be addressed. It is not easy to install wired coal mine safety monitoring and control systems in many coal mine regions, such as abandoned tunnels and mining sections. However, it is in these regions where there is the greatest potential safety hazard. Catastrophic coal mine accidents may occur if close attention is not paid, with inestimable consequences. Therefore, wired monitoring and control systems are not sufficient to meet the requirements of the safety production monitoring of an entire coal mine. Due to the limitations of wired monitoring and control systems and the complexity of underground coal mines, certain underground parameters, such as methane, dust, negative pressure, temperature, carbon monoxide, and wind speed, cannot be effectively monitored and controlled, causing great potential safety hazards [1–6]. Combining wireless monitoring systems with the existing wired monitoring and control systems can effectively compensate for the shortcomings of the existing monitoring and control systems, significantly increasing the level of coal mine safety.
For coal mine monitoring systems, data communication technology is the key to achieving the intellectualization and network of such systems and is also an important link to achieving a high-speed information platform for coal mines. Currently, the common communication modes that can be operated in the coal mine industry include the modulation and demodulation-based analog transmission mode, the distributed control system- (DCS-) based RS485 serial communication mode, the fieldbus control system (FCS) structure-based intelligent sensor transmission mode, and the wireless transmission mode. The fieldbus technique has been widely used in the industrial fields of various industries and can be used in either the master-slave mode or the multimaster mode as needed. The multimaster mode allows data exchanges among monitoring devices in different locations to be more flexible and direct. Due to its extremely high reliability and unique design, as well as its transmission characteristics (high speed, long distance), the fieldbus technique is especially suitable for use in the interconnection between field monitoring devices.
Established by densely distributing a large number of microsensor nodes capable of communicating and calculating in the unattended monitor regions, wireless sensor networks (WSNs) are intelligent autonomous control network systems that can self-complete planned tasks according to the environment. Based on the aforementioned main issues in the existing coal mine gas monitoring systems, the technological advantages of WSNs can be used to achieve seamless underground safety monitoring coverage by combining their advantages with those of wired networks.
Web services [7–9] are the services provided via Web technology. Generally, Web services are based on hypertext transfer protocol (HTTP). The World Wide Web Consortium (W3C) defines Web services as software systems marked by uniform resource identifiers (URIs); the common Web interface is defined and described by extensible markup language (XML) documents to provide outer calling. During the calling process, a Web service interacts with another Web service or other software systems using XML information encapsulation via HTTP. The Web is often used as the message transfer format between different services.
Representational State Transfer (REST) [10–13] is a network application framework first proposed by Dr. Roy Fielding in his doctoral dissertation. In the REST framework, all objects and capabilities within a system can be abstracted as resources, and every resource has a uniform resource location (URL). For instance, one data entry, one service operation, one picture, and one video can each be abstracted as a resource, and each resource has a unique URL within the system. In the REST framework style, every resource is exposed to the clients via a unique URL. Therefore, clients can distinguish these interactive objects via their URI. In addition, clients can also make any request to the resource based on a certain URI. One major difference between REST style Web services and traditional Web services is that REST does not treat HTTP as the transport layer protocol but the application layer protocol. Because the URI of a resource is unique, when a client uses the HTTP standard to operate GET, POST, PUT, and DELETE to request the target resource, the server will understand the HTTP request. GET reads the data of the resource; POST establishes a new resource; PUT updates a resource; and DELETE deletes a resource. Operating resources via a uniform interface increases the unity of interaction, reduces the coupling degree between components, simplifies the realization of the client, and increases the extensibility of the system.
The Web of Things (WoT) [14, 15] describes the Internet of things from the aspect of technical implementation. The WoT uses the design concept and technology of the Web to abstract the devices in the network environment of the WoT into resources and service abilities and connects them to the Web space to establish a heterogeneous network and distributed terminal-based application environment, which allows easier access to the embedded devices and services on the WoT. The WoT uses the Web standard and expands the entire ecosystem of the Internet to all types of sensing devices.
In this study, a wireless sensor network was combined with the controller area network (CAN) bus technology for the comprehensive and timely monitoring and intelligent early warning in the underground environment, the production data, and the operating state of the equipment. In addition, based on the WoT technology, all types of parameters were collected and transmitted to the remote monitor center for analysis to provide decision-making information for clients. If there was a parameter anomaly, the local sensor node could set off the sound and light alarm on site and simultaneously set off the alarm in the remote monitor center window. The rest of the paper is organized as follows. In Section 2, we describe the proposed system architecture. In Section 3, we describe different scenarios. In Section 4, we present the performance and discussion. Finally, the conclusions and future work are discussed in Section 5.
2. Proposed System Architecture
The WoT monitoring platform combines the WSN and the CAN bus technology to achieve comprehensive and timely monitoring and early warning of underground environmental parameters; in addition, the WoT technology is used to achieve remote monitoring of underground parameters in the remote monitor center. The entire system makes the abilities of the various underground sensors available to the application layer on the access gateway side and the operational system side via the Web technology; in addition, the system encapsulates the open interfaces via the REST-based framework and allows the application layer to access resources via HTTP. Figure 1 shows the overall architecture of the entire system.

Proposed platform architecture.
The service gateway of the WoT is the core node, which can provide Web services, enabling applications to directly access the gateway in the Web form to communicate with the sensors/controllers.
The WoT service server provides WoT services to WoT applications and also provides such management functions as identification, routing, and registration for the WoT service gateway. Hence, applications based on this architecture can obtain different WoT services by accessing the WoT service gateway and the WoT service platform.
WoT applications comprehensively and timely monitor and provide intelligent early warnings on the underground environment, the production data, and the operating state of the equipment. In addition, all types of parameters are collected and transmitted to the remote monitor center for analysis to provide decision-making information for clients.
2.1. Underground Wireless Sensor Network Deployment
The ZigBee protocol supports star topology and peer-to-peer topology. In practice, wireless sensor nodes are not spread randomly, nor are they a self-organized, centerless network. In this proposal, the tree cluster structure was used to increase the stability and reliability of the network [16, 17]. The tree cluster structure is an application form of the peer-to-peer network topology as shown in Figure 2. In this proposal, the monitor center serves as the personal area network (PAN) coordinator, that is, the cluster head with a cluster labeling (CLD) of 0. All the fixed nodes serve as fixed cluster head nodes (CLH), that is, PAN coordinators. For the convenience of integrating with the location, every fixed node establishes a PAN with a fixed PAN identification (PAN ID) during network initialization and sends beacon frames to the adjacent device by broadcasting. The candidate device that received the beacon frames applies to the cluster head for joining the network. If the head cluster permits the application, then the cluster head will join its adjacent table as a child node. In addition, the device that asked to join will join the head cluster as the parent node to its adjacent table, such that the device becomes a slave device of the network. Once the capacity of the network reaches a certain limit, the head cluster will designate one slave device as the head cluster of another cluster network. Subsequently, nodes from an even larger range will join one by one, expanding the network successively until all the nodes covered by the network have joined to form a multicluster network (Figure 2).

Tree cluster network.
Under normal situations, the node network process is as follows: when a ZigBee network is in initialization, a node is usually in a dormant state and wakes up at a random time point. After the node wakes up, the first step is to search for a network in its communication range. If a network is found, the node will select a parent device (a node that has already joined the network), based on the obtained network information, to apply to for permission to join the network and will await the request response from the parent node; if no network is found, then the node will declare itself the PAN coordinator and establish a network, accepting applications for permission to join the network as the parent device. After receiving an application to join the network, the parent device will make a decision on whether to approve the application based on the request information; if the parent device approves the application, then the parent device will send a request to inform the child device. After the child device receives the response message, it will obtain a network address assigned by the parent device as the only identifier within the network. The node has then successfully joined the network. After joining the network, the node will broadcast beacon frames as a coordinator and simultaneously accept requests from new nodes to join the network. Thus, through the level-by-level assignment of short addresses, all the nodes in the network-covered region will form a tree cluster network topology. Figure 3 shows the network setup process in the peer-to-peer wireless network nodes.

Network process setup process.
First, the coordinator scans the channels and detects energy, after which it establishes the network and accepts requests for permission to join the network from other nodes as the parent node. After the parent node receives a request to join the network, it first determines whether to allow the node to join the network; if the node is allowed to join the network, then the parent node will send a request response to inform the child node and assign a network address for the child node as its only identifier within the network. The node has then successfully joined the network. After joining, if the node is a router, it can in turn receive requests to join the network from new nodes. Through the level-by-level assignment of short addresses, all nodes in the monitor region will join the network. During the process of a node joining the network, a pair of nodes that communicate with one another form a parent-child relationship—the node that has already joined the network is the parent node, while the other node is the parent node's child node.
In coal mines, miners must constantly move due to work requirement. The ZigBee nodes carried on the miners move within, join, and exit the network. In addition, further mining results in the corresponding expansion of the network, which causes dynamic variation of the network topology. Nodes exchange data through the multihop data forwarding mechanism, which requires a special routing protocol for packet forwarding. In the proposed system, the data interaction primarily occurs between the monitor center and each monitoring node. The majority of data flow is from each monitoring node to the monitor center, followed by the instruction data sent from the monitor center to the devices; there is little data exchange between monitoring nodes. Therefore, the routing selection is optimized to some extent based on this feature. The data sent to the monitor center directly selects an upward vertical route along the cluster tree, while the data sent from the monitor center to a certain node directly selects a downward vertical route along the cluster tree; route discovery and route selection are only begun for the small amount of data exchange between nodes. When the network layer receives data from the upper layer, it first determines whether the transmission is a broadcast frame; if so, then it processes the data according to the broadcast frame procedure. The network layer determines whether the data should be sent to the monitor center; if so, the network layer uses its parent node as the route for the next hop; if not, then the network layer starts route selection or sends the data based on the known route for the next hop. If the node neither has the route discovery capability nor executes route selection, then it performs route selection along the tree. If the data are sent from the monitor center to a monitoring node, the data are first sent to the CAN bus. A fixed node checks whether the data belongs to its own PAN ID section; if so, then the node selects a downward vertical route along the cluster tree, and the data successively hop to the target node. If the data are an interaction between monitoring nodes, route discovery and route selection may be necessary.
2.2. WoT Gateway for Underground Sensors Networks
Underground sensor networks nodes must also address data delay tolerance, loss tolerance, distributed filtering, time synchronization, security, real time, low power, and other situations. The sink node then gathers the data and transmits them to a smart control gateway with better processing, storage, and communication capabilities than the sensor nodes. The smart control gateway receives data from sensor network nodes and instrument devices and accepts remote control commands from the external network. At the same time, the smart gateway control gateway has an embedded database to store data received from the sensor network nodes and instrument devices, which facilitates data management. For the higher level monitoring and control applications, any type of device looks the same, even if the underlying implementation differs. The framework for the WoT gateway is shown in Figure 4.

Web of Things gateway framework.
As seen in Figure 4, for underground physical devices that are not supported by HTTP over TCP/IP and that do not have an IP stack, the smart control gateway is responsible for translating the web request into a protocol understood by the physical device. The smart control gateway transforms the special communication protocol to general HTTP. It receives control messages and translates them to commands understood by the underground physical devices. Similarly, it collects data from the devices and forwards them to the monitoring center. Here, it contains the device management, data collection management, control command management, and protocol management.
The data collection management converts and parses data among different underground dedicated communication protocols. Sensors transmit data to a sink node, and the sink node receives the data and transmits it to the data collection management by the serial port. Further details of the control flow for data collection are illustrated in Figure 5.
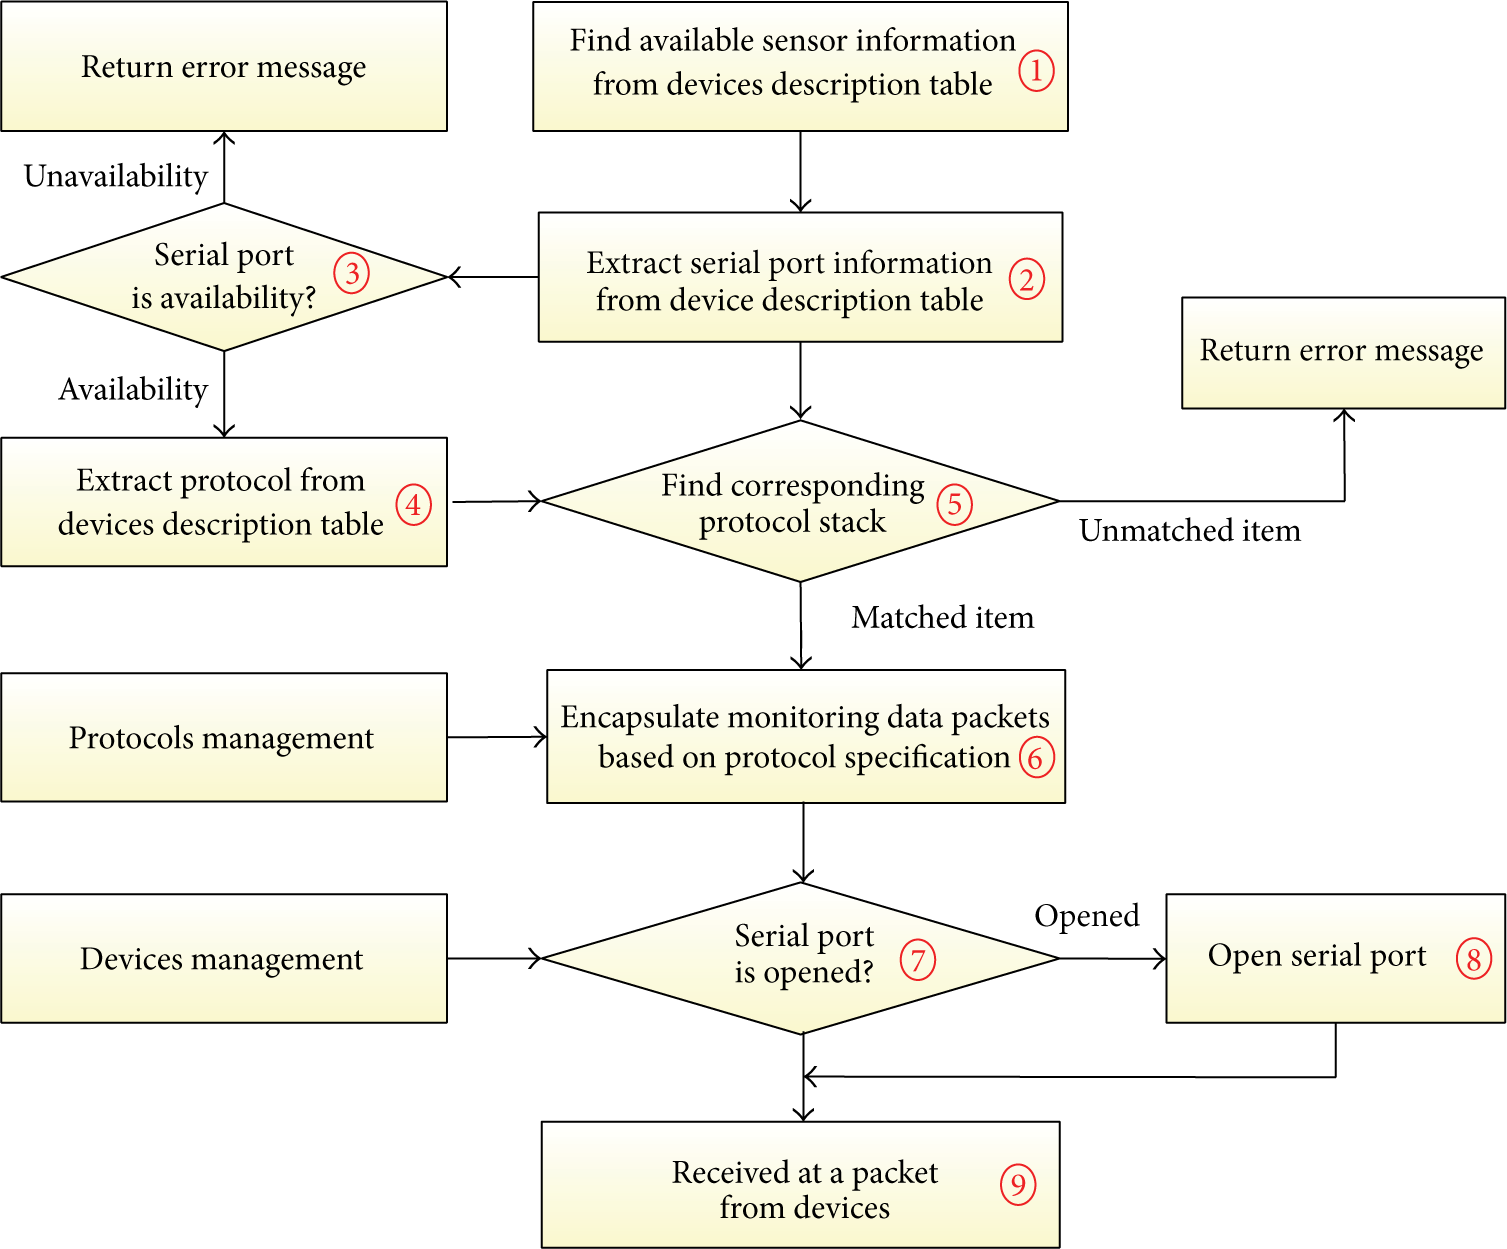
The control flow for data collection.
Step 1. Find available information for sensor devices from device description table. The STATUS field can equal 1, which means the device is available, or zero, which means the device is unavailable.
Step 2. Extract the serial port COM_ID from the matched sensor devices, which indicates which serial port ID should be used for the sensor devices.
Step 3. Judge whether the serial port COM_ID can be used, which can be determined based on the COM_ID from the serial port description table. If there are no matched items, or if there is a matched item but the STATUS field is equal to zero, which means this serial port is unavailable, then return an error message.
Step 4. Extract the protocol information for the devices and extract the DEVICE_PROTOCOL from the matched device items.
Step 5. Search the protocols from the protocol management module for the DEVICE_PROTOCOL protocol. If there is no matching protocol item, then return an error message.
Step 6. Encapsulate the data packet based on the protocol specification.
Step 7. Judge whether the serial port COM_ID is opened after the protocol data packet is encapsulated.
Step 8. Open the serial port, and if the serial port COM_ID is not opened, then open this serial port.
Step 9. Send the protocol data packets, and once the data channel is established when the serial port is opened, receive the data packet from the devices.
The control command management must perform any action commands. Automation control must send the command “ON” to turn on switches and the command “OFF” for shutdown. The control command management will analyze and parse the URL and send the commands to the devices. Further details of the control flow for command control are illustrated in Figure 6.

The flow for command control.
Step 1. Receive the control commands. The control command contains the name of the sensor device as NAME, PLC_ID, SENSOR_ID, and VALUE.
Step 2. Judge whether the device can be used based on the PLD_ID and SENSOR_ID, which are obtained from the device description table. If there are no matched items, or if there is a matched item but the STATUS field is equal to zero, which means this serial port is unavailable, then return an error messages.
Step 3. Extract the serial port COM_ID from the matched devices, which will be the serial port used for data access for the devices.
Step 4. Judge whether the serial port COM_ID can be used, which can be determined based on the COM_ID from the serial port description table. If there are no matched items, or if there is a matched item but the STATUS field is equal to zero, which means this serial port is unavailable, then return an error message.
Step 5. Extract the protocol information for the underground physical devices and extract the DEVICE_PROTOCOL from the matched device item.
Step 6. Search the protocols from the protocol management for the DEVICE_PROTOCOL protocol. If there is no matched protocol item, return an error message.
Step 7. Encapsulate the data packet based on the protocol specification.
Step 8. Judge whether the serial port COM_ID is opened after the protocol data packet is encapsulated.
Step 9. Open the serial port, and if the serial port COM_ID is not opened, then open this serial port.
Step 10. Send the protocol data packets, and once the data channel is established when the serial port is opened, send the control command data packet to the devices.
The device management is responsible for the interaction and management of devices, treating all the devices in the same manner, and it is responsible for sending and receiving messages to and from the devices. It deals mainly with low-level communication and is responsible for the interaction between the upper layers and the device threads. The device management maintains a high-level view of devices registered at the smart control gateway by using the device abstraction. It maintains a list of all the devices connected to the smart control gateway. The device management periodically sends a message to maintain the device list. If a new sensor device attempts to connect to the smart control gateway by sending a request message, when the request message is received successfully, it will immediately return the response message. Meanwhile, the newly added sensor device will be added to the device list for the smart control gateway and will also send a second response confirmation message to the sensor devices. Therefore, by sending a request to the device management with the device driver parameter class and a unique device identifier ID, new instances of the driver instances can be invoked, and the new sensor device drivers can be loaded through dynamic class loading. In particular, the device management receives a response message from the sensor device, which will generate a single URL address and the corresponding resource representation. However, if the response message is not received within five minutes because of the power consumption or abnormal work, the sensor device will be removed from the device list, and the corresponding URL will be destroyed.
The data management is responsible for real time management of data from the physical devices. It is necessary to collect the environmental data on the underground coal mine, such as methane gas, temperature, humidity, air pressure, wind speed, wind direction, and water level for each environmental parameter through the underground instrument and sensor network, then pass the data to the smart control gateway through the serial port and store those data in the database SQLite, which is a SQL database engine that is independent, embeddable, and zero-configuration, and occupies very few resources. The application can operate the tables in the SQLite database with different requirements.
The thread management is responsible for the device thread lifecycle management, which runs constantly, maintains all the threads for the smart control gateway, and initializes all the components of the smart control gateway. Once the smart control gateway discovers a new physical device, a new thread is automatically created, and inside every thread for physical devices, information is stored concerning the device description and a list of the services supported by the devices.
2.3. RESTful Remote Monitoring for Coal Mine
The underground coal mine sensing equipment is connected to the gateway via the communication network. The capabilities of the equipment are encapsulated by the proxy/gateway and are made accessible via the Web services on the gateway. The REST services use the four standard methods of HTTP to complete operations on resources. The operating targets are the resources marked by URLs. Every message is independent. This mode fully utilizes the characteristics of the existing HTTP. Figure 7 shows the request/response process.
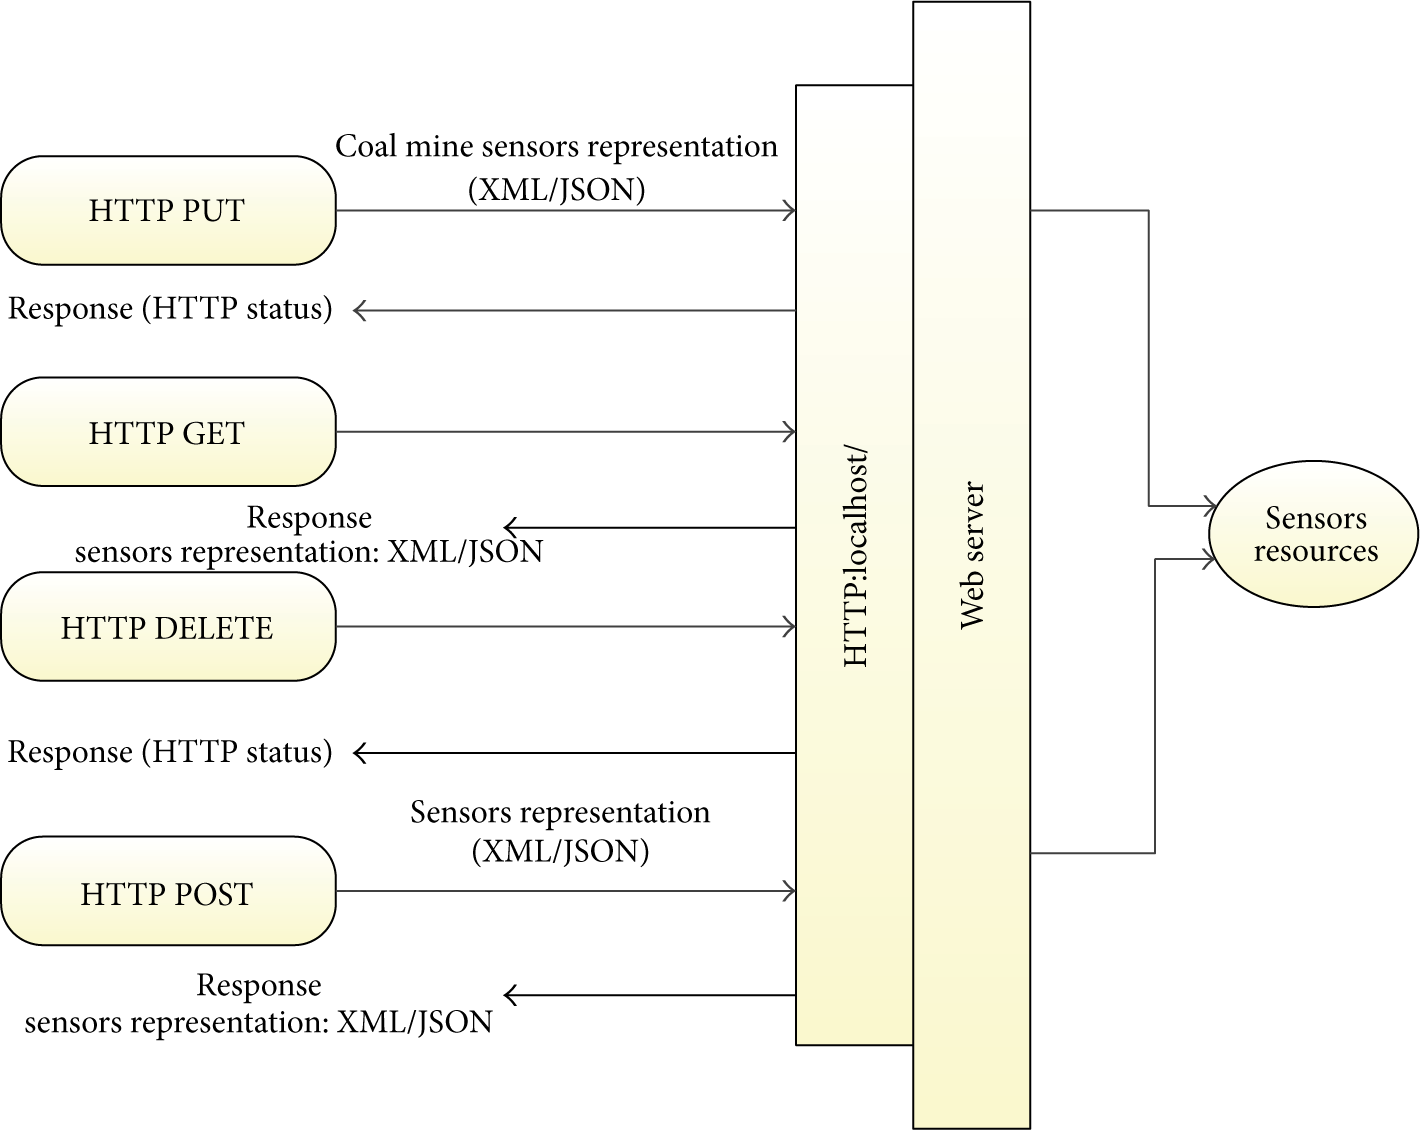
Request and response of REST services.
We classify transmitted messages into two types: data messages and downlink control messages. Due to the open interfaces encapsulated by REST style-based WoT services, HTTP is used to encapsulate both types of messages; in addition, both types of message support XML and JavaScript object notation (JSON) data exchange formats. Because HTTP serves as the application protocol, request messages will include both messages for operating the resources and the messages for transmitting resources. The resources are queried, modified, increased, and deleted via the HTTP methods GET, POST, PUT, and DELETE, respectively.
When an application sends a query request for data messages to the WoT architecture, the request mode-GET-of the HTTP head reflects the query to the WoT resources. Then, a returned data message includes a message head and a message body. Table 1 lists the field definitions of the response data structure.
Field definitions of data structure.
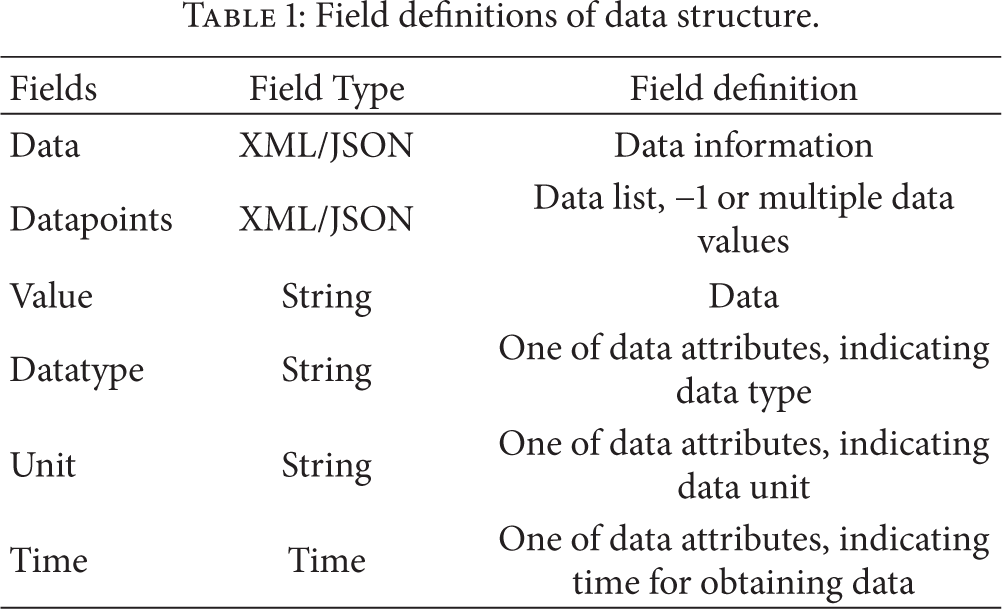
Box 1 is an example of an XML data format-based data query message body. In this example, the response was the data on methane concentration at 16 : 22 : 10 on 2013-05-10.
<Data xmlns:xsi=“http://www.w3.org/2001/XMLSchema-instance” Xmlns:xsd=http://www.w3.org/2001/XMLSchema svc_ID=“222”> <Datapoints> <value datatype=“methane” Unit=“Con” Time=“2013-05-10T16:22:10”>5</value> </Datapoints> </Data
Box 1
For the command control messages, when an application sends a command control request to the WoT gateway, the request mode of the HTTP head, POST, reflects the modification of the WoT resources. Modifying a resource will require new data information. Therefore, the request packet also includes the information on the new resource, which is attached to the end of the request head. Table 2 lists the field definitions of the control information.
Field definitions of control information.

Box 2 is an example of an XML data format-based downlink control message. In this example, the device that needed to be modified was the device with a Svc ID 111, and the first channel of the device was opened.
<Device Svc_ID=“111” version=“1.0”> <Operation_ID=“ON”> <parameters> <parameter name=“channel”>02</parameter> </parameters> </Operation> </Device>
Box 2
For operation requests, a response message only includes the message head; whether the request was successful is indicated by the message object code.
RESTful Web services use the 4 standard methods of HTTP to complete the operations on resources. The operating targets are the resources identified by URLs. The detailed realization of the REST design of each operation is discussed in detail as follows. The design follows the standard of Java API for RESTful Web Services (JSR-311) (JAX-RS). The standard defines a number of annotations, which are used to encapsulate a class of resource or a class of Java into a Web resource. The main annotations used here include the following: @Path (annotating the relative path of a resource class or method); @GET, @PUT, @POST, and @DELETE (annotating the HTTP request type of the method); and @Produces and @Consumes (annotating the multipurpose internet mail extensions (MIME) media type that is returned to the client and introduced by the server). The following are the parameter types: @PathParam, @QueryParam, @HeaderParam, @CookieParam, @MatrixParam, and @FormParam, which annotate the parameters of the method from different locations of an HTTP request. For instance, @PathParam is from the path of the URI; @QueryParam is from the query parameter of the URL; @HeaderParam is from the head information of an HTTP request; and @CookieParam is from the cookie of an HTTP request.
The resource register interface mainly registers the basic resource information of each underground sensor to the WoT gateway server, enabling the client to obtain all the necessary information for operating services on the WoT gateway server. Box 3 gives the detailed definition of the interface.
@POST @Path (“/{servicename}”) @Consumes (“application/x-www-form-urlencoded”) String addService(@PathParam(“servicename”) String servicename, @FormParam(“user”) String user, @FormParam(“type”) String type, @FormParam(“descrip”) String descrip, InputStream servicestream);
Box 3
Here, @POST indicates that the service register interface submits a request in the form of HTTP POST. @Path(“/{servicename}”) defines the URI of the operation; the base address of the interface operation is http://localhost:8080/; the path can be directly defined with a variable; and the final URI is base address + path. @Consumes(“application/x-www-form-urlencoded”) indicates the request type, that is, the transmission type of the parameter of the request that the server received.
The resource update interface mainly updates the state of the resource of each underground sensor. Due to the effects of variation in the original requirements, the data source address, and the parameter configuration. Box 4 shows the definition for the interface.
@PUT @Path (“/{servicename}”) @Consumes (“application/x-www-form-urlencoded”) String updateService(@PathParam(“servicename”) String servicename, InputStream servicestream);
Box 4
Here, @PUT indicates that the service update interface submits requests in the form of PUT. @Path(“/{servicename}”) is used to configure the Web address that the interface accesses; the base address is http://localhost:8080/mashup, and the final accessed Web address is the base address + the configured path, http://localhost:8080 /servicename. @Consumes(application /x-www-form- urlencoded) is used to configure the format of the parameters transmitted to the server, which is mainly used to configure the service stream.
The resource deletion interface mainly deletes the resources of the sensors that cannot be called to clear useless information from the database on the WoT gateway server. The definition of the interface is as shown in Box 5.
@DELETE @Path (“/{servicename}”) Boolean deleteService(@PathParam(“servicename”) String servicename;
Box 5
Here, @DELETE indicates that the resource deletes interface requests called in the form of HTTP DELETE. @Path(“/{servicename}”) is used to configure the Web address that the interface accesses; the base address is http://localhost:8080, and the accessed Web address is the base address + the configured path, http://localhost:8080/ servicename.
The main functions of the resource query interface are to search for the services that meet the requirements among the services that have been registered in the server according to the client's specified query parameters, such as the registered service client, service type, and service name, and to return the service list to the client. The definition of the interface is as shown in Box 6.
@GET @Path (“/services”) List<Service> queryService(@QueryParam(“user”) String user; @QueryParam (“type”) String type, @QueryParam(“servicename”) String servicename);
Box 6
Here, @GET indicates that the service query interface submits requests in the form of HTTP GET. @Path(“/services”) defines the Web address accessed by the query interface. Because the query interface will return multiple service lists according to the query conditions, it is not possible to use the base addresses used in the four aforementioned interfaces + service name as the web address. A new path, /services, is added to the path variable. The final accessed web address of the service query interface is http://localhost:8080/services.
3. WoT Monitoring for Coal Mine Scenarios
In the first example, an all-around monitoring viewgraph of the underground environment is provided in Figure 8, which mainly includes displays of real-time monitor data. Therefore, clients can browse the environmental parameters, such as coal mine gas, carbon monoxide, negative pressure, temperature, and wind speed, as well as the operating state of such equipment as the blowers, the ventilators, and the air doors at any time at any location. Overlimit warning messages are displayed in bright red. Reports of various monitor data can be generated for statistical analysis and printing. Reports include the analog data statistical report, the analog warning statistical report, the analog power outage report, the analog feed anomaly report, the variation of the state of the switch signal report, the switch signal warning report, the switch signal power outage report, the switch signal feed anomaly report, and the monitoring equipment failure report.

All-around monitoring viewgraph for coal mine.
In the second example, coal mine safety information is vibrant, dynamic, and spatial location-related information. The geographic information system (GIS) collects, stores, updates, analyzes, transmits, and inquires about geographical information; the GIS is a widely used tool in the management process. The GIS can be used to provide the coal mine supervisors and the higher authority department with fast, accurate, visual, and systematic information with pictures and text for coal mines. Thus, GIS technology plays a more and more important role in remote monitoring systems for coal mine safety. Figure 9 shows the graphical integrated view for a monitoring and control system for a coal mine based on mobile PDA devices.
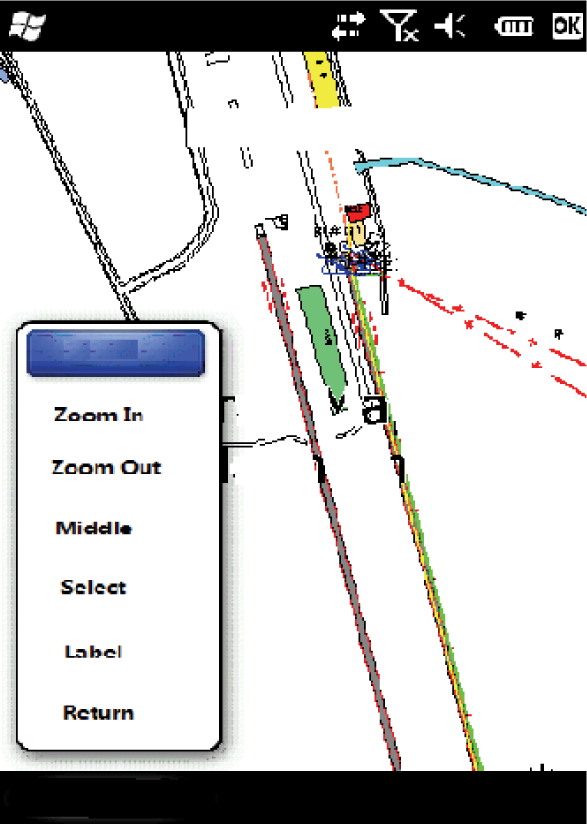
Mobile GIS for coal mine.
After the mobile terminal is connected to the remote server of the coal mine, the communication and data exchanges between the two are completed. The coal mine on-site measuring point data on the mobile terminal is established via the mobile network. The diverse management applications of the GIS space monitoring services, such as correlation, positioning, and real-time alarm, alter the traditional situation, in which coal mine safety production management systems are all PC-based and provide a brand new method for coal mine safety production monitoring and management.
In the third example, suitable cameras are installed at each substation according to the actual situations (e.g., lighting, appearance of the pit and the mine, locomotive equipment). Cameras are installed on the cradle head and controlled by the ground monitor center (rotating, zooming, and adjusting the angle) to ensure all-around monitoring on the underground observation points. Figure 10 shows the mobile video monitoring scenario for the underground coal mine.

Mobile video monitoring for coal mine.
The mobile phone video monitoring system can transmit the videos of the monitored objects collected by the cameras to smartphones in real time via the 3G data network to allow the supervisors to check the state of the monitored objects at any time at any location. When viewing the monitoring videos, supervisors can control the cradle head of the cameras via their smartphones (e.g., zooming, focusing, and adjusting the direction).
4. Performance and Discussion
In this section, we attempt to evaluate our system experimentally. We created different scenarios to test our system under real-time and heavy workload circumstances. Through these tests, we measure the performance and reliability of our system. The experimental setup used to evaluate our framework is as follows. The remote monitoring software was installed on a PC server (Intel Xeon E5420 2.5 GHz with 10 G RAM). Around the REST smart gateway, we deployed 30 Mica2 motes. These sensor nodes were distributed on a tunnel wall approximately 10 meters wide and 5 meters high. Additional sensor devices were also deployed.
Experiment 1.
The service registry interfaces and the service query interfaces of simple object access protocol (SOAP) and REST were tested, respectively. The service registry already included the database operation and the service script file operation, while the service query operation only included the database query operation. The access modes were as follows: RPCServiceClient and HttpClient client terminals were used for access five times, and the service access times were recorded. The service access time refers to the duration from the time when the client terminal requests the service to the time when the server response is received. Figure 11 compares the results.
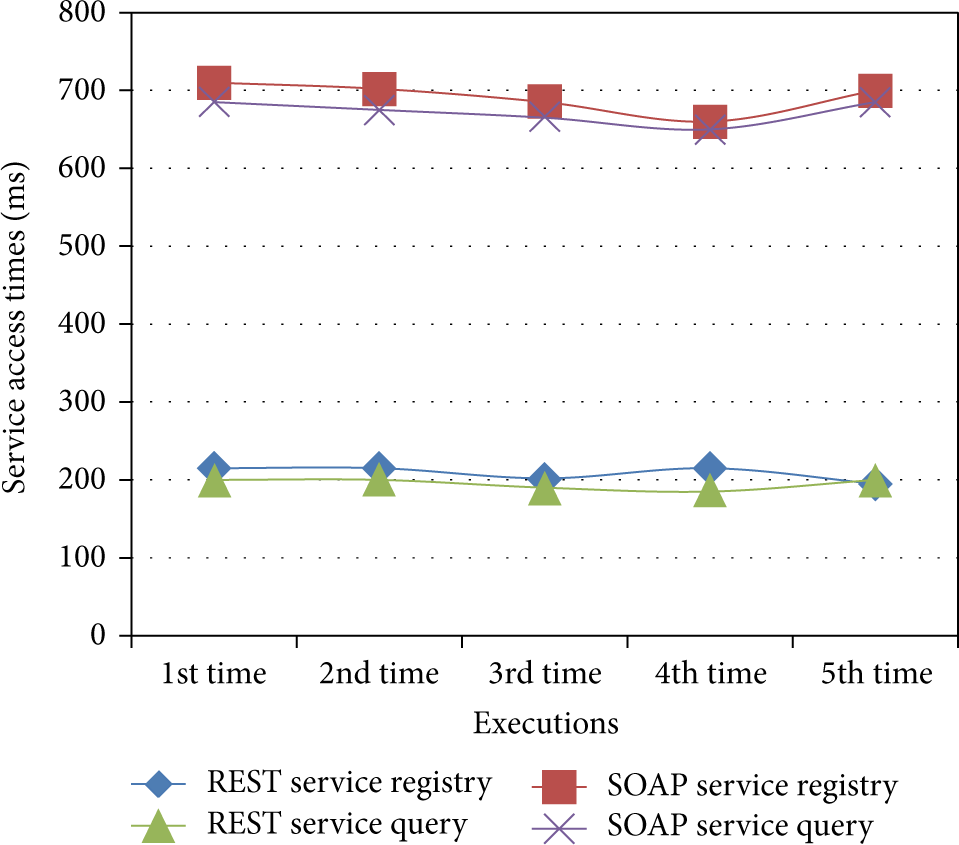
Comparison for response time between REST and SOAP.
It can be seen in Figure 11 that the access efficiency of the REST Web services was significantly higher than the access efficiency of the SOAP Web services, mainly due to the following: it was necessary to construct SOAP messages when accessing the SOAP Web services; SOAP messages needed to include the web addresses of the services to be accessed and the corresponding operation and parameter information; in addition, the number of sent request messages was far greater than the number of REST Web service-based HTTP requests for access. HTTP received a significantly optimized network transmission protocol; thus, the response efficiency of HTTP was higher than that of SOAP messages.
Experiment 2.
Based on the performance test results, the video monitoring service was taken as an example, and a table of comparison test results was provided, mainly for comparison of the average completion time parameters under different concurrent numbers; the result is shown as in Figure 12.

Comparison response time bet SOAP and REST.
Figure 12 shows that with the increasing concurrent number, the time parameters of the two types of services exhibited an increasing nonlinear trend. When the concurrent numbers were the same, all the time parameters of the SOAP Web services were greater than the time parameters of the REST Web services. With the increasing concurrent number, the difference between the time parameters of the two types of services became more and more significant. Therefore, the REST Web services were superior to the SOAP Web services in terms of performance and efficiency, which was mainly due to such advantages as the simple packet structure of the REST Web services and the HTTP cache that gave the REST Web services higher efficiency under the concurrent conditions.
Experiment 3.
When implementing the REST Web services, either JSON or XML can be selected as the data format. The Windows communication foundation (WCF) framework can serialize and deserialize these two types of data formats. We took video monitoring as an example and conducted performance tests on the REST Web services established using the JSON and XML data transmission formats, respectively. Figure 13 compares the results.

Comparison response time between JSON and XML REST Web services.
As seen in Figure 13, when the concurrent numbers were the same, the minimum time of the JSON data format was slightly shorter than the minimum time of the XML data format; however, the maximum completion time of the JSON data format was generally longer than the maximum completion of the XML data format; in addition, there was no significant difference between the two types of services in terms of the mean time. With the increasing concurrent number, there was only a slight difference between the two types of services in terms of the time parameter. Overall, the JSON data format was slightly better than the XML data format in terms of performance.
5. Conclusions and Future Work
This paper proposes a WoT-based remote monitoring system that takes full advantage of wireless sensor networks in combination with the CAN bus communication technique abstracts the underground sensor data and capabilities into WoT resources to offer services using REST style. The different remote monitoring scenarios for coal mine safety are illustrated, and the system performance is also tested and analyzed. In the future work, we plan to improve and optimize the deployment for the wireless sensor network underground coal mine and also to improve the coal miner localization precision using ZigBee wireless sensor network.
Footnotes
Conflict of Interests
The authors declare that there is no conflict of interests regarding the publication of this paper.
Acknowledgments
This research is supported by the National Grand Fundamental Research 973 Program of China under Grant nos. 2011CB302506 and 2012CB315802, National High-tech R&D Program of China (863 Program) under Grant no. 2013AA102301, National Natural Science Foundation of China under Grant no. 61132001, and Program for New Century Excellent Talents in University (Grant no. NCET-11-0592).