
Abstract
Automatic detection and location of traffic signs is an important part of intelligent transportation, especially for unmanned vehicle technology research. For the morphological feature of China road traffic signs, we propose a traffic sign detection method based on color segmentation and shape analysis. Firstly, in order to solve the problems of traffic signs color cast, distortion, and cross-color in natural scenes, the images are processed by white balance, Retinex color enhancement, and affine transformation. Then, the type of traffic signs is discriminated and detected, according to the color and shape characteristics of traffic signs. The experimental results show that this method can effectively detect and recognize traffic signs.
1. Introduction
Traffic sign recognition system is an important part of intelligent transportation systems, which can take images by the cameras installed on the front side of the motor vehicle and transfer the images to the image processing module of the system. It plays an important role in drivers and pedestrian safety. The natural scene of traffic sign recognition often exists in complex scenes: disturbance, climate interference, illumination changes, dirty or blocked traffic sign, and skew distortions due to anthropogenic factors or disrepair. Therefore, the recognition of traffic signs is of great significance in natural scenes.
Studies of the detection and recognition of traffic signs abroad were conducted since 1980s. France's de Saint Blancard [1] developed a red flag recognition system with the average recognition rate of 94.9% in 1992. Koblenz-Landau University and Daimler-Benz AG developed a real-time traffic sign recognition system [2] with the max processing speed of 3.3 seconds/parcel in 1994. Piccioli et al. [3, 4] developed a traffic sign detection and recognition system from Italian Genoa University; detection accuracy rate of the system was about 92%, traffic signs of triangles and circles processing time was 6 seconds/parcel and 15 seconds/parcel, respectively, traffic signs recognition accuracy rate was about 98%, and the processing time was about 0.5 seconds/parcel. In china, much research on traffic signs recognition has been done. For warning traffic signs, GangYi and Yi [5] introduced an automatic recognition algorithm based on mathematical morphology. Ming and Fei [6] designed four layers BP neural network for traffic signs classification. These scholars have made great achievements, but their research is not enough when the gray level difference of different colors is small; especially in the natural scene, traffic sign images contrast smaller, light more uneven, and the things interfering with traffic signs, will increase the error rate.
Given the characteristics of the traffic signs in natural scenes, we studied traffic sign detection and recognition algorithm and introduced a solution that can quickly detect and recognize traffic signs by white balance, color image enhancement, and affine transformation correction. The method can correct projection distortion image in natural scenes and improve traffic sign recognition rate.
2. Road Traffic Sign Colors and Geometric Shapes
Traffic signs are divided into three categories in China, which are 29 directional signs, 49 warning signs, and 43 prohibition signs.
Directional signs indicate the vehicles and pedestrians running in the specified direction and location; traffic signs are white pattern on blue, circular or rectangular.
Warning signs warn the vehicles and pedestrians to be careful about a dangerous place. Warning signs are black borders and pattern on yellow triangle with upward angle.
Prohibition signs prohibit or restrict the vehicle, such as no vehicular traffic, no parking, no left turn, no honking, speed limits, limiting weight. The signs with red borders and black pattern on white are circular, regular octagon, and regular downward triangle. The signs with black border are circular.
On the whole, traffic signs borders are 3 colors (blue, black, and red) and 3 shapes (circle, triangle, and rectangle). We can detect and recognize traffic signs according to their border color and shape.
3. Image Preprocessing of Traffic Signs
It can bring great difficulties to detect and recognize when traffic signs appear partial color, distortion, and color distortion in the natural scenes. In order to improve the accuracy, the preprocessing methods were introduced. White balance and Retinex color enhancement can correct and enhance image's color, and affine transformation can correct shapes.
3.1. Automatic White Balance Processing Based on Dynamic Threshold
White balance is that the object can be restored to the original color regardless of the lighting. Automatic white balance is designed to eliminate the color deviation caused by different light conditions so that the picture taken as far as possible may meet the human visual habit. We can make the object restore its original color by compensating color when images appear reddish or bluish phenomenon for different lighting conditions. We can take steps to minimize them by dynamic threshold algorithm when images display large single color. According to the color characteristics of the traffic signs, we design its processing steps with a dynamic threshold algorithm.
S1: Convert from RGB color space to YC b C r space; conversion relations are as follows:

C b and C r are the blue and red chrominance and Y is the luminance in function (1).
S2: select the reference white point.
The image is divided into 3*4 blocks.
Calculate the average M b of C b and the average M r of C r for each block.
Calculate the variance D b of C b and the variance D r of C r for each block, where N is the number of pixels:

where (i, j) is coordinate.
Judge which is the near-white region to each region. The formula is as follows:

Set a luminance matrix A of “reference white point,” the size of m*n. If formula (3) is satisfied, the point (i, j) is the “reference white point,” and A i,j = y (the luminance of (i, j)); otherwise, A i,j = 0.
S3: select the max ymax*10% and the min y min of “reference white point”; if R i,j < y min , A i,j = 0; otherwise, A i,j = 1.
S4: calculate R2 = R*A, G2 = G*A, B2 = B*A. Calculate the average Rav of R2, the average Gav of G2, and the average Bav of B2.
S5: compute a gain

Ymax is the maximum brightness of the entire image.
S6: according to the formula (4), adjust the image. Consider

R, G, B are from the three-channel values of image pixels and R′, G′, B′ are from the three-channel values by adjusting image pixels.
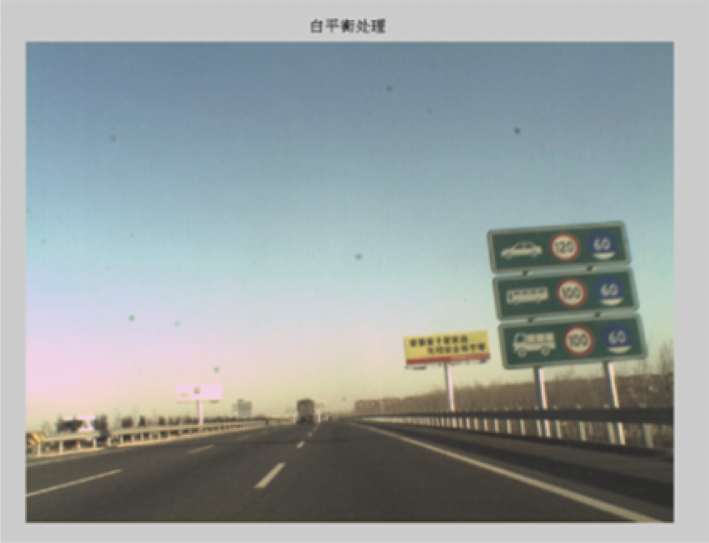
Figure 1 is the result of the original image and Figure 2 is white balance processing effect chart. Figure 1 appears blue because of the color temperature, which will lead to inaccuracy when we extract color features. The color of Figure 2 has been greatly improved after white balance processing.

The original image.
The white balance processing image.
3.2. Color Image Enhancement
The image effect is not good because of lightness, climate, and other factors in natural scenes. Image enhancement can improve the visual effect and highlight the image's features. There are a lot of image enhancement algorithms, but Retinex algorithm based on color constancy has stronger ability to adapt than any other methods and can reach consistency in color constancy, edge enhancement, and dynamic range compression. Multiscale Retinex algorithm has a prominent effect on the image of traffic signs from natural scenes.
Image S(x, y) from natural scenes can be decomposed into the incident light and reflected the image by Retinex. L(x, y) is the incident image and R(x, y) is the reflected image. Each pixel S(x, y) can be represented as follows:

According to Retinex, the color of the object is formed by the light reflected; the light reflectance is inherent and is with absolute no dependence on light intensity. So, we can compute all of the pixels color value by color correction of the relative light and dark relationship between pixels. Multiscale Retinex is as follows:

R M (x, y) represents the image pixel after the Retinex processing, I(x, y) represents the original image pixel, and F(x, y) is the center surround function after normalizing and a Gaussian function. * represents the convolution operation.
W k is the weight. Multiscale Retinex is composed of a single scale Retinex. We assign a reasonable value to every single scale. The multiscale Retinex algorithm can not only highlight the image details but also ensure nondistortion of the image.
Figure 3 is a chart of Figure 1 enhancement. It has been processed by the Retinex image enhancement algorithm. In Figure 1, the red edge of speed limitation sign is very light, and the sign is not easily split by color; in Figure 3, the red edge of the speed limitation sign becomes very bright and deep; the image segmentation becomes easy. The experimental results show that multiscale Retinex image enhancement algorithm plays an important role in color feature extraction.
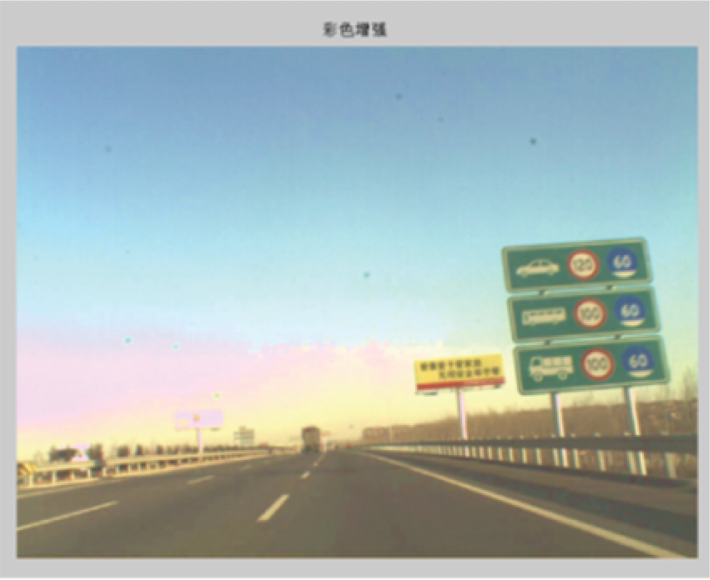
Color enhancement effect.
3.3. Traffic Signs Correction Based on Affine Transformation
Traffic signs may appear to be deformed, rotated, and with other phenomena from natural scenes. If so, it will affect the recognition of traffic signs. The shape correction of traffic signs plays a very important role in traffic signs recognition system. We improved the detection accuracy by the traffic signs shape with affine transformation.
When applying affine matrix, we can correct some deformed circular, triangular, and rectangular traffic signs to standard ones by translation, rotation, scaling, and so on, of Affine transformation. The basic principle is the following. In geometry, a vector space is transformed into another vector space by a linear transformation and a translation. The vector x translation b, and pinch, rotate A, Affine transformation is:

Figure 4(a) is deformed traffic signs image from natural scenes and Figure 4(b) is the binary image after the affine transformation. Experimental results showed that the affine transformation can be very effective in dealing with twist and deformation of traffic signs images and greatly improve the detection accuracy by the shape.
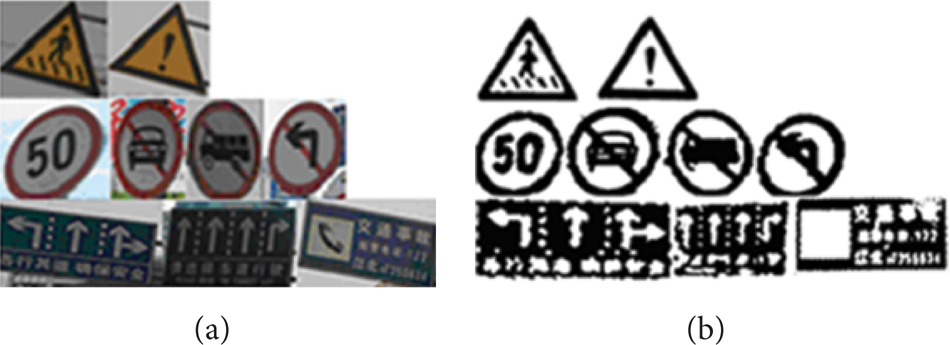
Affine calibration results.
4. Traffic Signs Detection and Location
Traffic signs have color characteristics and the specific shape properties. By the analysis of 49 warning signs, 43 prohibition signs, and 29 directional signs in China, we know that the color of traffic signs are mainly red, yellow, and blue. Traffic signs are circle, rectangle, and triangle except “stop and give way,” while the “stop and give way” sign is octagon. So we can segment traffic signs based on color and shape. Figure 5 is a flow chat of the traffic signs detection and location based on the color and shape.
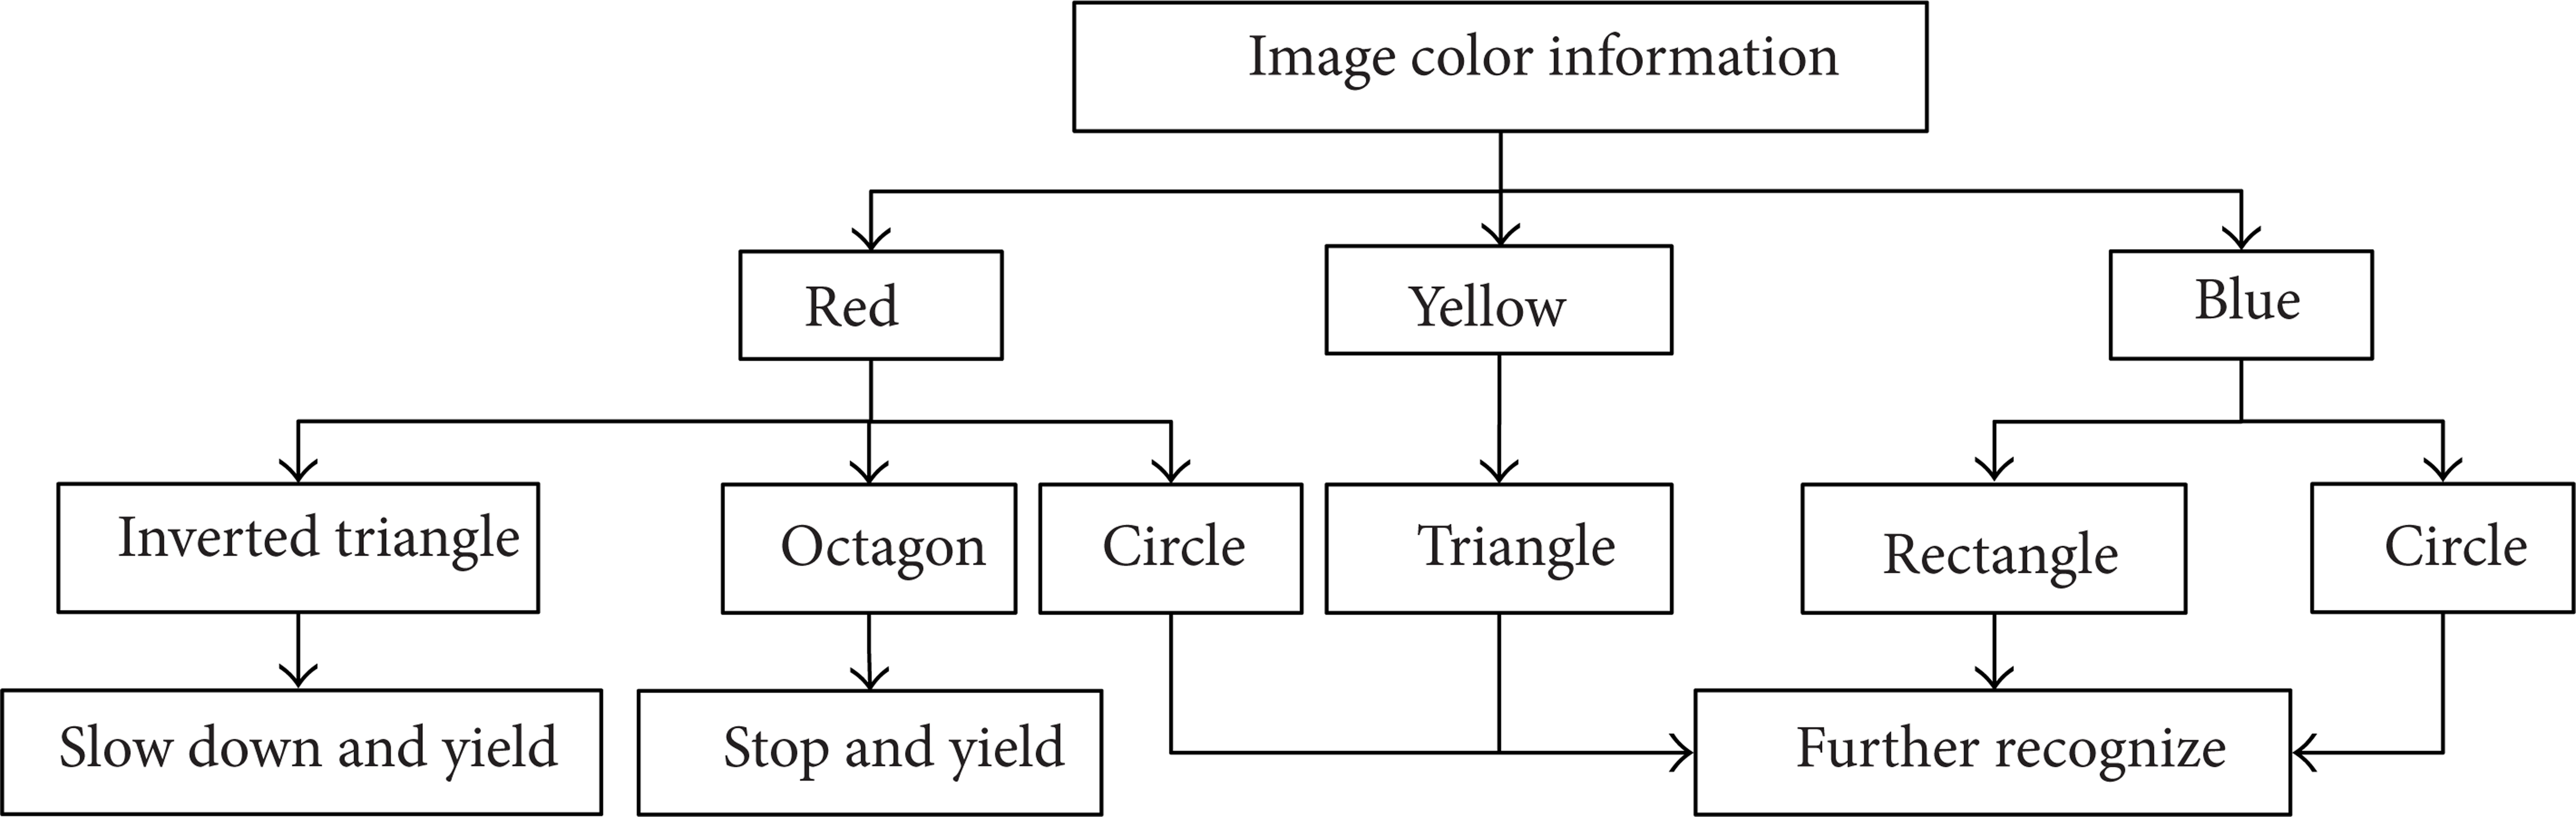
Basic flow chart based on color segmentation and shape location.
4.1. Image Segmentation of Traffic Signs Based on HSV
Image segmentation is to separate the special region and other regions. Image segmentation of traffic signs is a key to traffic signs recognition system. The selection of segmentation algorithms will directly affect the real-time and the accuracy of recognition, so researchers always study the fast and accurate traffic sign image segmentation algorithm.
Through the comparison of color space model, the luminance V and hue H are separate and the saturation S and the color information of an image are unrelated in the HSV color space. HSV color space is more suitable for human vision. We can handle color hue and luminance information in the HSV color space. So, we can segment the traffic sign images by HSV color space model from natural scenes.
The hue H is going to be right at its center in the process of the image segmentation based on color features, because the hue component H does not change in different lighting conditions and also is not affected by the saturation S. However, the color will be affected by saturation and luminance. When the brightness is too large or too small, the hue is meaningless; also when the saturation is too small, the hue component is of no significance. After analyzing the colors of more than 600 different traffic sign images, we got a conclusion; when the saturation S is less than 0.25, or the luminance V is less than 0.2 or greater than 0.9, the H is useless. Therefore, these interfering factors must be removed when we segment the traffic images in color space model.
The colors of traffic signs are different in different countries. We studied more than 600 traffic signs images in natural scenes and determine the threshold of red, yellow, and blue according to the traffic sign color rules in China. H, S, and V three components are normalized to [0, 255] in Table 1.
HSV space of different color threshold.

4.2. The Accurate Detection Based on the Shape
Due to the obvious color and shape characteristics of traffic signs, we detect and recognize traffic sign images based on region shape characters.
(1) Calculate Roundness C, Rectangularity R and Elongation E. The shapes of traffic signs are triangle, rectangle, and circle in natural scenes. Different traffic sign shape attribute values are different, such as roundness, rectangularity, elongation, and distance from centroid to edge curve. We can pinpoint the location of traffic signs by them (roundness, rectangularity, elongation, and distance from centroid to edge curve). Figure 6 shows the round, triangular, and rectangular traffic signs.

Typical shapes of traffic signs.
In Figure 6, H is the width and W is height of the region, S is the area of the region, and L is the region circumference. Then C is roundness, which is calculated as

C indicates the proximity of the region and circle; moreover, the higher the value of C is, the more the region approximates to a circle. C is 0-1.
When R is rectangularity and R is larger, the region is close to rectangular. R is 0-1, which is calculated as

E is elongation, which is calculated as
In the formula (11), max(W, H) and min(W, H) represent the larger and the smaller value in H and W; E represents the proximity of the region and circle or square or triangle; moreover, the closer the value is to 1, the smaller the ratio of length to width is. E is 0-1.
In order to unify standard, the size of all the traffic signs is normalized to (64 * 64) in this paper. Under ideal conditions, the parameter values of equilateral triangle, roundness, rectangularity, and elongation are shown in Table 2.
Attributes of different shapes.

Experimental results provide the value of roundness, rectangularity, and elongation of traffic sign images in natural scenes, as shown in Table 3.
Attributes of different shape in the natural scene.

(2) Detection and Recognition. Based on region recognition, the steps are as follows.
S1: traffic sign image is segmented based on the color characteristics; we get the target area.
S2: segment images and remove the image noises, the outer burr, filling the region.
S3: calculate the area of the target region, and remove too large or too small blocks.
S4: calculate roundness C, rectangularity R, and elongation E of the target area.
S5: determine which traffic signs the target area is.
4.3. Experimental Results and Analysis
We took over 600 images of three weather conditions including sunny, cloudy, and rainy at experiments; the results are shown in Table 4.
Detection rate and misclassification rate in different weather.

We can find from Table 4 that when it is sunny, detection rate is the highest and misclassification rate is the lowest; cloudy weather follows; when it is rainy, detection rate is the lowest and false positive rate is the highest. Thus, weather has an impact on the detection rate of traffic signs. In addition, the main factor causing false recognition is due to the billboards, trees, buildings, and so on in the natural scenes.
5. Conclusions
We discuss a traffic signs detection and recognition algorithm from the natural scenes in the paper. The color and shape are the main features of the traffic sign recognition. For the inclement weather of natural environment, the white balance algorithm changes color cast, Retinex's image enhancement improves the visual effect and highlight characteristics of the images, and affine transformation corrects the distortion of traffic sign images. In image segmentation, HSV color space model is not affected by light and is more suitable for color segmentation than RGB space in natural scenes. Moreover, we get the thresholds of different colors by many experiments. We analyse the traffic sign shapes and get some properties of different shapes and compute the value of roundness, rectangularity, and elongation.
Conflict of Interests
The authors declare that there is no conflict of interests regarding the publication of this paper.
Footnotes
Acknowledgments
This paper is supported by Special Fund for Agro-scientific Research in the Public Interest, the Bureau of Science and Technology Hebei (no. 2014055214), Science and Technology Fund of the Agricultural University of Hebei 2009, National Natural Science Foundation of China under Grants (no. 60873236), Natural Science Foundation of Hebei Province in China under Grants (no. F2009000653 and no. 14227404D). In addition, our research is also supported by the Youth Science Research Foundation of Hebei Province in China under Grants (no. 2010251).