
Abstract
Aiming to reduce the number of crashes caused by speeding at night on road section with a crosswalk, a study was conducted on the maximum speed limit and safe average luminance at night. In order to investigate the potential relationship between drivers’ recognitive characteristics and driving speed under different road lighting features, data of remaining driving time (period from the time that crossing pedestrian is recognized to the time that vehicle arrives at crosswalk with an uniform speed) were recorded. The results of the data analysis show that it is more difficult for divers to recognize crossing pedestrian at night when a single pedestrian is statistic and wears dark clothes. The remaining driving time decreases with the increase of driving speed and the decrease of road luminance. With the collected data, several multivariate nonlinear regression models were established to capture the relationship among the variables of remaining driving time at night, the driving speed, and the average luminance. Then the modeling results were used to develop the reasonable speed limit and safe average luminance by physical equations. The case studies are also introduced at the end of the paper.
1. Introduction
In China, pedestrian crashes at night account for 10% of the total fatal crashes, so setting proper maximum speed limit and providing enough road luminance at night are effective countermeasures. However, it lacks systematic theoretical study on maximum speed limit and road lighting at night on road section with a crosswalk in China. The purpose of the project was to study how to properly develop the maximum speed limit and safe average luminance for road section with a crosswalk at night based on the remaining driving time modeling.
Night-vision enhancement systems and driving performances at night have been a focus topic. Two night-vision enhancement systems were examined by Lim et al. through analyzing driver performance at night [1]. Fuchs et al. assessed driver behavior in interacting with different human-machine-interfaces (HMI) for night-vision systems [2]. Brown et al. concluded that automatic warnings (AW) may minimize workload, improve performances, and increase safety level [3]. Lim et al. analyzed driver performance in a pedestrian-detection task assisted with night-vision enhancement systems [4]. Wood et al. concluded that the driver's age, clothing configuration, headlamp beam, and glare all affect the driver's ability to recognize pedestrians at night [5]. Wood and Owens confirmed that older drivers’ visibility was seriously degraded during night driving [6]. Okombi-Diba et al. evaluated the effectiveness of a night driver's support system providing an advance notice of the pedestrian location [7]. Easa et al. found that the driver's recognition could be improved by increasing road light level [9].
Understanding impact of night visibility on the driver's visual recognitive ability has been an interesting study subject for many years. Konstantopoulos et al. gave a comparative analysis on the moving locus of the driver's eyes at daytime, night, and on a rainy day by driving simulator and discovered that low visibility decreased the validity of driver's visual search [8]. Easa et al. studied the effects of improved lighting on driver's visual recognitive ability. Their research results showed that improved lighting was helpful for boosting driver's visual recognitive ability to traffic sign on straight section, but it produced negative impacts on horizontal curve section due to overestimating improved lighting [9]. Babizhayev et al. investigated some elderly driver's driving information at night and found that glare affected driving characteristics greatly with the increasing of driver's age [10]. Some scholars advocated that design or management measures should be adopted to improve driving environment at night. Hu and Donnell studied driver's acceleration and deceleration models on rural highway at night. They regarded curve direction, curvature, and curve length as variables of these models in order to apply their fruits to highway design [11]. Horberry et al. compared the benefits of enhanced and regular traffic sign through simulation of wet pavement at night and concluded that enhanced traffic sign was advantageous to drivers at night [12].
This paper is organized as follows. The following section analyzes the influence of the crossing pedestrian amount, the state of their motion, and their clothing color on the driver's recognition. Then, Section 3 analyzes remaining driving time changing rule with driving speed and average luminance and builds up models. In Section 4, proper maximum speed limit and average luminance for crosswalk are developed and corresponding examples are also given. The final section then gives a conclusion and some recommendations.
2. Influence of Crossing Pedestrian Feature
Considering the crossing pedestrian amount, the state of their motion, and their clothing color, three tests were conducted and pedestrians were divided into two groups in each test. The driver's recognition distance (distance between a pedestrian and the location where the pedestrian was clearly recognized the first time) data were observed, respectively. Furthermore, both good lighting and adverse lighting conditions were considered.
2.1. Pedestrian Amount
The distribution of the driver's recognition distance to one pedestrian and three pedestrians in different road lighting conditions is illustrated in Figure 1.
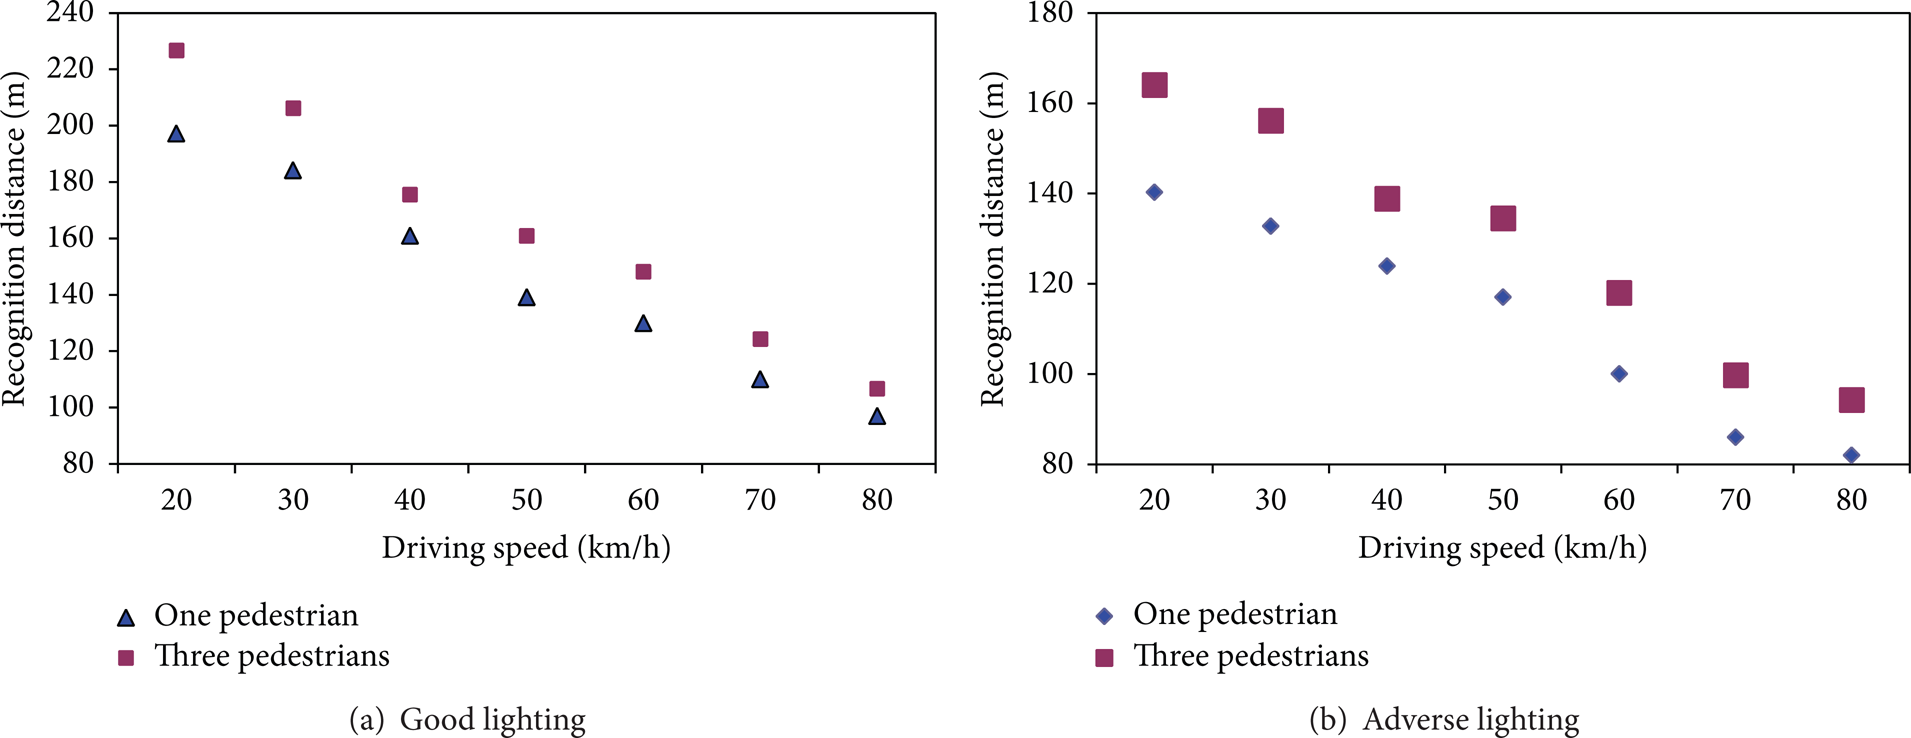
Driver's recognition distance versus pedestrian amount.
As shown in Figure 1, driving speed increases and recognition distance decreases. Whether road lighting is good or not, pedestrian amount produces effect on driver's recognition. Pedestrian group can be recognized by driver earlier than single pedestrian. Adverse lighting also results in the decline of the driver's recognitive ability.
2.2. State of Motion
The driver's recognition distance to movable and static pedestrian is shown in Figure 2. As is shown in Figure 2, the driver's recognition distance to movable pedestrian is more than static pedestrian. Therefore, it is more dangerous for statistic pedestrian on crosswalk at night.

Driver recognition distance versus pedestrian state of motion.
2.3. Clothing Color
The driver's recognition distances to pedestrians wearing black and white were shown in Figure 3. As is shown in Figure 3, clothing color produces effect on driver recognition to pedestrians at night. Compared with dark clothing, light-colored clothing is easier to be recognized by drivers at night.

Driver's recognition distances versus pedestrian's clothing color.
3. Results and Discussion
3.1. Experiment Design and Data
In this experiment, eight drivers with three to ten years of driving experiences were arranged to recognize crossing pedestrians. According to above analysis, the most adverse condition was only one static pedestrian with dark clothing. Experiment time was from 8:00 p.m to 12:00 p.m. Experimental sections were located in Song-bei District of Harbin City, China. Road luminance was recorded by illuminometer and five observed spots located at crosswalk with same interval between curb line and central line. The observed road luminance data were listed in Table 1.
Luminance on crosswalk of experimental sections.

Seven trips were arranged for each driver and speeds in each trip were 20 km/h, 30 km/h, 40 km/h, 50 km/h, 60 km/h, 70 km/h, and 80 km/h, respectively. The drivers need report to the designated on-board passenger when recognizing a pedestrian ahead and the passenger recorded the time as t1 by a stopwatch. When a vehicle passed through the pedestrian, the passenger recorded again the time as t2.
Remaining driving time is defined as period from the time that crossing pedestrian is recognized to the time that vehicle arrives at crosswalk with a uniform speed. Thus, the remaining driving time t r , which means the period from the time that crossing pedestrian is recognized to the time that vehicle arrives at crosswalk with a uniform speed, was calculated as in formula (1). The observed data were listed in Table 2. The sample size was 336:

Observed data of remaining driving time.

3.2. Data Analysis
3.2.1. Remaining Driving Time versus Driving Speed
The distribution of remaining driving time versus driving speed was shown in Figure 4. It indicates that remaining driving time decreases with the increase of driving speed. Thus, it can provide more time for drivers to react and brake by conducting speed limit at night. Moreover, by comparing remaining driving time data corresponding to different road luminance, it can be found that road luminance is also a factor that affects remaining driving time. Thus, it is necessary to analyze the relation between remaining driving time and road luminance.

Distribution of remaining driving time versus driving speed.
3.2.2. Remaining Driving Time versus Average Luminance
The distribution of remaining driving time versus road luminance was shown in Figure 5.

Distribution of recognition distance versus average luminance.
It shows that remaining driving time increases with the increase of driving speed when road luminance is low. When road luminance is high, this trend is not evident.
Thus, it can enhance safety level of crosswalk by improving low road luminance at night. When speed is no more than 50 km/h, low luminance ranges from 20 lx to 80 lx. When speed is more than 60 km/h, low luminance ranges from 20 lx to 100 lx.
3.2.3. Model Establishment
The preliminary results show the potential relationship among remaining driving time, driving speed, and road luminance. Different functional forms were explored with SPSS program. Regression models were listed in Table 3.
Nighttime recognition distance models.
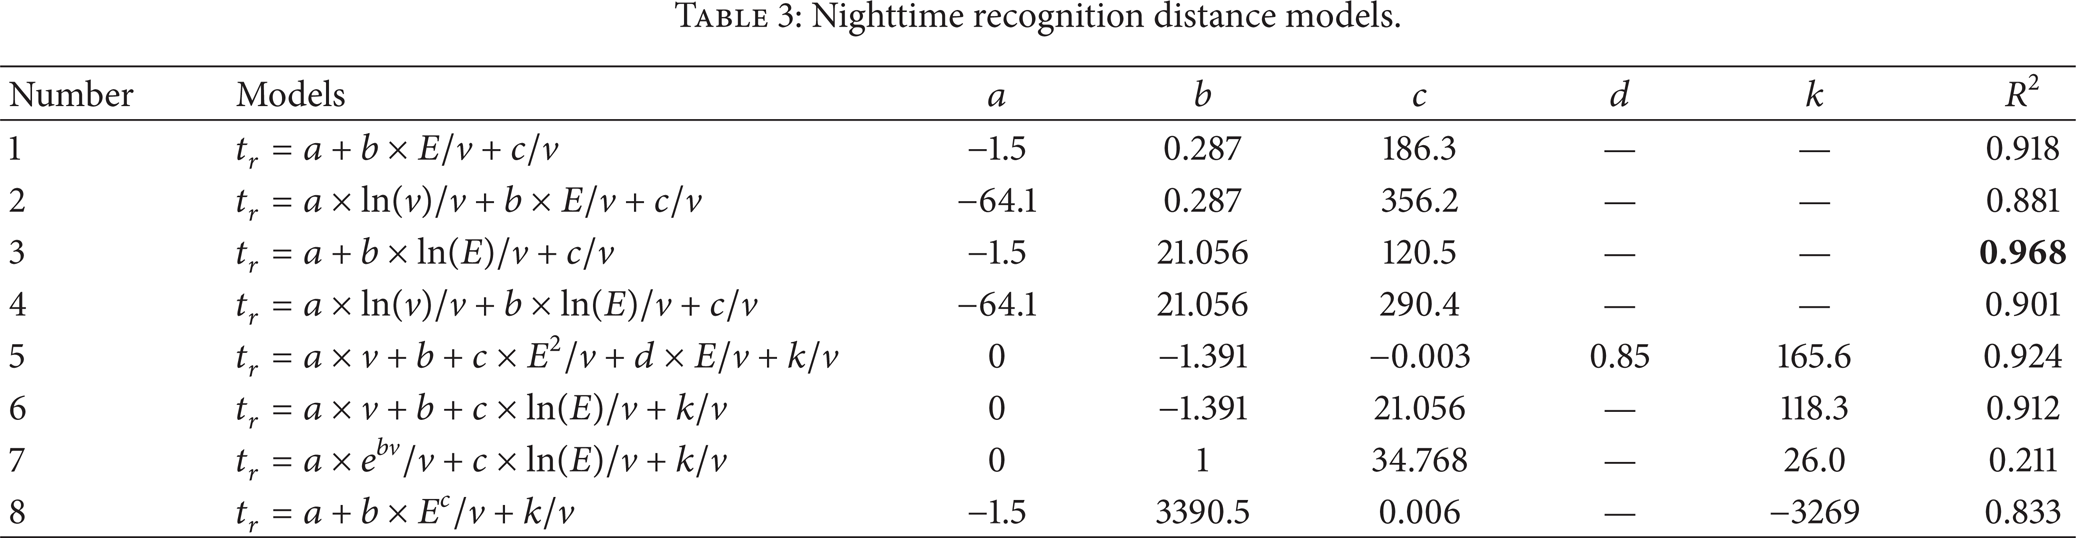
In Table 3, the third model is the best model to capture the relationship for its highest R-square of 0.968. It is shown as in

where t r is remaining driving time at night, m; v is driving speed, km/h. E is average luminance, lx.
3.3. Maximum Speed Limit and Average Luminance
3.3.1. Suggestions on the Maximum Speed Limit
For safety, (3) should be met:
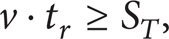
where S T is stopping sight distance, m. S T is composed of three parts shown in the following equation:

where S R is driving distance during driver's reaction time, m; S B is braking distance, m; S0 is safe distance, m.
Driver's reaction time can be taken as 2.45 s, which is 95% value of statistic data [13].
S B can be calculated by [14]:

S0 ranges from 5 m to 10 m and it is taken as 8.0 m in this paper.
Therefore, S T can be obtained by

Combining (2), (3), and (6), there is

Thus, the theoretical maximum speed limit on road section with crosswalk at night v l can be obtained below:

Taking experimental sections as an example, the maximum speed limit on road section with crosswalk at night was calculated as listed in Table 4.
Maximum speed limit value on experimental road section.

3.3.2. Suggestions on Average Luminance
It can be seen from the above analysis that when the average luminance reaches certain value, the driver's recognitive distance equals stopping sight distance. Combining (2) and (6), the minimum safe average luminance can be given by

As shown in Table 5, the minimum safe average luminance corresponding to different speed can be calculated according to (9). When speed is 70 km/h and more, safe average luminance should be no less than 9,797 lx, which nearly equals luminance at daytime. However, it is very difficult and unnecessary to provide such high luminance. It is not effective through raising luminance to guarantee crossing pedestrian safety when speed is high. Thus, the maximum speed limit is very necessary at nighttime.
Calculation results of minimum safe average luminance.

4. Conclusions
Drivers’ recognition distance is affected evidently by the pedestrian amount, the state of their motions, and their clothing color. A single pedestrian, the static state, and dark clothes will result in the driver's worst recognition. And it is applicable whether the road lighting is good or not. Remaining driving time decreases with the increase of driving speed when road lighting conditions are same. The modeling results show that there is reciprocal and logarithm relationship between the remaining driving time at night and driving speed and average luminance, respectively.
Based on the remaining driving time and the stopping sight distance, the calculating method was given to obtain the theoretical maximum speed limit value on road section with crosswalk at night. It can guarantee the crossing pedestrian's safety when emergent braking takes place at night. The minimum safe average luminance value on crosswalk corresponding to different speed was calculated. When speed exceeds 70 km/h, the raising luminance produces little effect on the pedestrian's safety. At this point, the maximum speed limit can be adopted to ensure the pedestrian's safety.
Conflict of Interests
The authors declare that there is no conflict of interests regarding the publication of this paper.
Footnotes
Acknowledgments
This research is sponsored by National Natural Science Foundation of China (51208238), Jilin Province Science and Technology Development Project (20140204026SF and 20140413011GH), and Science and Technology Planning Project of Yunan Province of China (2013CA025).