
Abstract
The abnormal activity detection in smart environments has experienced increasing attention over years, due to its usefulness in pervasive applications. In order to meet the real-time needs and overcome the high costs and privacy issues, this paper proposes distributed abnormal activity detection approach (DetectingAct), which employs the computing and storage resources of simple and ubiquitous sensor nodes, to detect abnormal activity in smart environments equipped with wireless sensor networks (WSN). In DetectingAct, activity is defined as the combination of trajectory and duration, and abnormal activity is defined as the activity which deviates greater enough from those normal activities. DetectingAct works as follows. Firstly, DetectingAct finds the normal activity patterns through duration-dependent frequent pattern mining algorithm (DFPMA), which adopts unsupervised learning instead of supervised learning. Secondly, the distributed knowledge storage mechanism (DKSM) is introduced to store the mined patterns in each node. Then, the current triggered sensor adopts distributed abnormal activity detection algorithm (DAADA), in which the clustering analysis plays a critical role, to compare the present activity with normal activity patterns, by calculating the similarity between them. The feasibility, real-time property, and accuracy of the DetectingAct algorithm are evaluated using both simulation and real experiments case studies.
1. Introduction
User activity detection is one of the key applications in smart environments. As detecting users' normal activities is interesting and important, it has attracted attention of a lot of researchers. Activity recognition is based on learning and analyzing the patterns of activities extracted from occupants' regular activities. The abnormal activity detection also has great significance in building pervasive and smart environments applications. Due to the importance of using it to monitor signature or suspicious activities, the abnormal activity detection can be applied to various application domains ranging from the smart home for healthcare to the intelligent building for security, as mentioned later in details.
Medical professionals believe that one of the best ways to detect an emerging medical condition before it becomes critical is to look for the changes in the activities of daily living (ADLs), that is, to detect the abnormal activities in daily life. For example, in elderly care assisted living, a healthy old person in home has a regular routine, with almost regular activity trajectories patterns. But once he or she feels physical discomfort or physical state declining, the abnormality of the activity trajectory or the routine (e.g., more or fewer trips to the bathroom) will be detected. Moreover, whether the activity is normal can be more efficiently reflected by the combination of trajectory and duration. For instance, in the elderly care, a person staying at a location for a longer duration than usual might indicate the onset of illness and need to alert a family member or formal care provider.
Intelligent building, especially in high-security areas, such as military region, warehouse, and office building, will enhance security and provide proactive service by allowing the environment to detect abnormal activities [1]. When coming into a strange place, due to being unfamiliar with the location of room, furniture, or lamp switches, the stranger will spend longer time than the familiar to find the right way, and the trajectory is messier. Hence, it is feasible to identify such suspicious activities and send an alarm for immediate attention.
For the data collection equipment, there are two kinds of approaches to detect abnormal activity: video-based and sensor-based.
Video-based approaches mainly adopt image processing technologies. However, these approaches have the following serious limitations:
costing much but only covering a small area [2]; violation of user privacy; only identifying the type of activity with short duration and small scope.
Sensor-based smart environment, which is an emerging research field, can well overcome the above mentioned shortcomings [3, 4]. Studies in the literature have gotten some achievements, but they occasionally adopt centralized data processing and only process simple trajectory data. So many of them have the following disadvantages:
focusing on sequence information of activity and ignoring the importance of temporal information; using centralized approach, consuming large bandwidth, and long response time; disregarding the activity variation.
Our motivation in this paper is to solve two main challenges. (1) In activity detection, what kind of activities that should be defined as abnormal is subjective. Therefore, it is necessary to find a series of quantitative metrics for different applications (e.g., healthcare, security etc.) to effectively define abnormal activity. (2) The large bandwidth and long response time of the centralized approach are inadequate for real-time detection.
So in this paper we design a new approach DetectingAct to deal with them. (1) A more accurate distinguishing feature, which introduces other relevant information in addition to sequence such as temporal information, is discovered to detect abnormality. (2) A distributed mechanism is proposed, including (i) storing these compressed patterns in each related sensor with the distributed storage mechanism (duration-dependent frequent pattern mining algorithm) and (ii) deciding whether the present activity is normal is based on the distributed detection mechanism (distributed abnormal activity detection algorithm). The main contributions of this paper are as follows.
Considering the variation of activity, duration is introduced into our model, which reveals not only the trajectory abnormality, but also the duration abnormality caused by unpredictable interference. DetectingAct, a novel distributed abnormal activity detection algorithm, is proposed to store the learned parameters using mining-training into each sensor and to detect abnormal activity real-timely based on sensor node's limited resource. Simulation and real data based experiments are conducted to verify that our approach can efficiently detect abnormal activity in smart environments.
The rest of the paper is organized as follows: in Section 2, related works in the literature are thoroughly overviewed. The activity model is presented in Section 3. DetectingAct is presented in Section 4, followed by a series of simulations and experimental studies in Section 5. Finally, conclusion is made in Section 6.
2. Related Work
Lots of efforts have been made in the literature for detecting abnormal activity. According to the equipment used in various approaches, they can be typically grouped into two types: video-based and sensor-based.
Video-based approaches mainly use 2D cameras to collect data and adopt image processing technologies to analyze the data. In these approaches, users wear no sensors. These techniques are well proven and mature. Zhong et al. [5] proposed an unsupervised approach for unusual activity detection in a large video set using simple features. Stauffer and Grimson [6] presented a real-time approximate method for learning patterns of activity. The experiments show that this method is stable and robust, and this system is successfully implemented in indoor environments and in some outdoor environments. Recently, 3D cameras have been introduced in video-based approaches. Liu [7] proposes an activity recognition using 2D and 3D depth cameras. However, video-based approaches intrude on privacy issues and video equipment also costs too much. Sensor-based activity detection has attracted much attention and most of the works have focused on centralized data processing. Tapia et al. [3] proposed a system for recognizing activities in the home environment. The experiments prove that activities can be recognized using a lot of small and simple state-change sensors. Wren and Tapia [1] presented a model that uses simple motion sensors to recognize activities. In abnormal activity detection research, Yin et al. [8] proposed a two-step approach for abnormal activity detection based on attached sensors. The authors have first built a one-class support vector machine (SVM) to filter out most normal activities, and then they derive abnormal activity models through kernel nonlinear regression (KNLR).
However, according to [9, 10], due to the network lag of centralized methods possibly resulting in detecting errors, they cannot meet the real-time demand. Hence, other researches have used distributed methods [11] trying to alleviate the drawbacks in centralized methods. Hasan et al. [2] presented a distributed probabilistic model for activity recognition of daily life and experiments show that with enough labeled data, this model recognizes the activities successfully. Amft et al. [12] proposed a distributed model for online recognition of user activities. The authors have used a two-layer model based on the concept that activity sequences are composed of activity events, and activity events are composed of atomic activities. But [2, 12] define activity merely by the trigger sequence of sensors. Lee and Mao [13] present an anomaly detection mechanism based on correlation graphs of sensor network for identifying abnormal home events. Most of the mechanism merely works well in specified abnormal event detection because of only trajectory being taken into account, while the duration was ignored.
As far as we know, there is no similar research on the abnormal activity detection by feature-based statistics and unsupervised method which is significantly different from the traditionally used method (detecting the abnormality by recognizing the activity first). Hence, in this paper we have proposed the overall research on the distributed abnormal activity detection system, including definition of activity model, detection mechanism, detection algorithm, and verification method.
3. Activity Model and Activity Variation
In this section, we describe the details of our proposed activity model and the concept of activity variation. Figure 1 depicts the structure and sensor layout of a realistic smart home test bed, where an old man lives alone for the help of health and security monitoring.
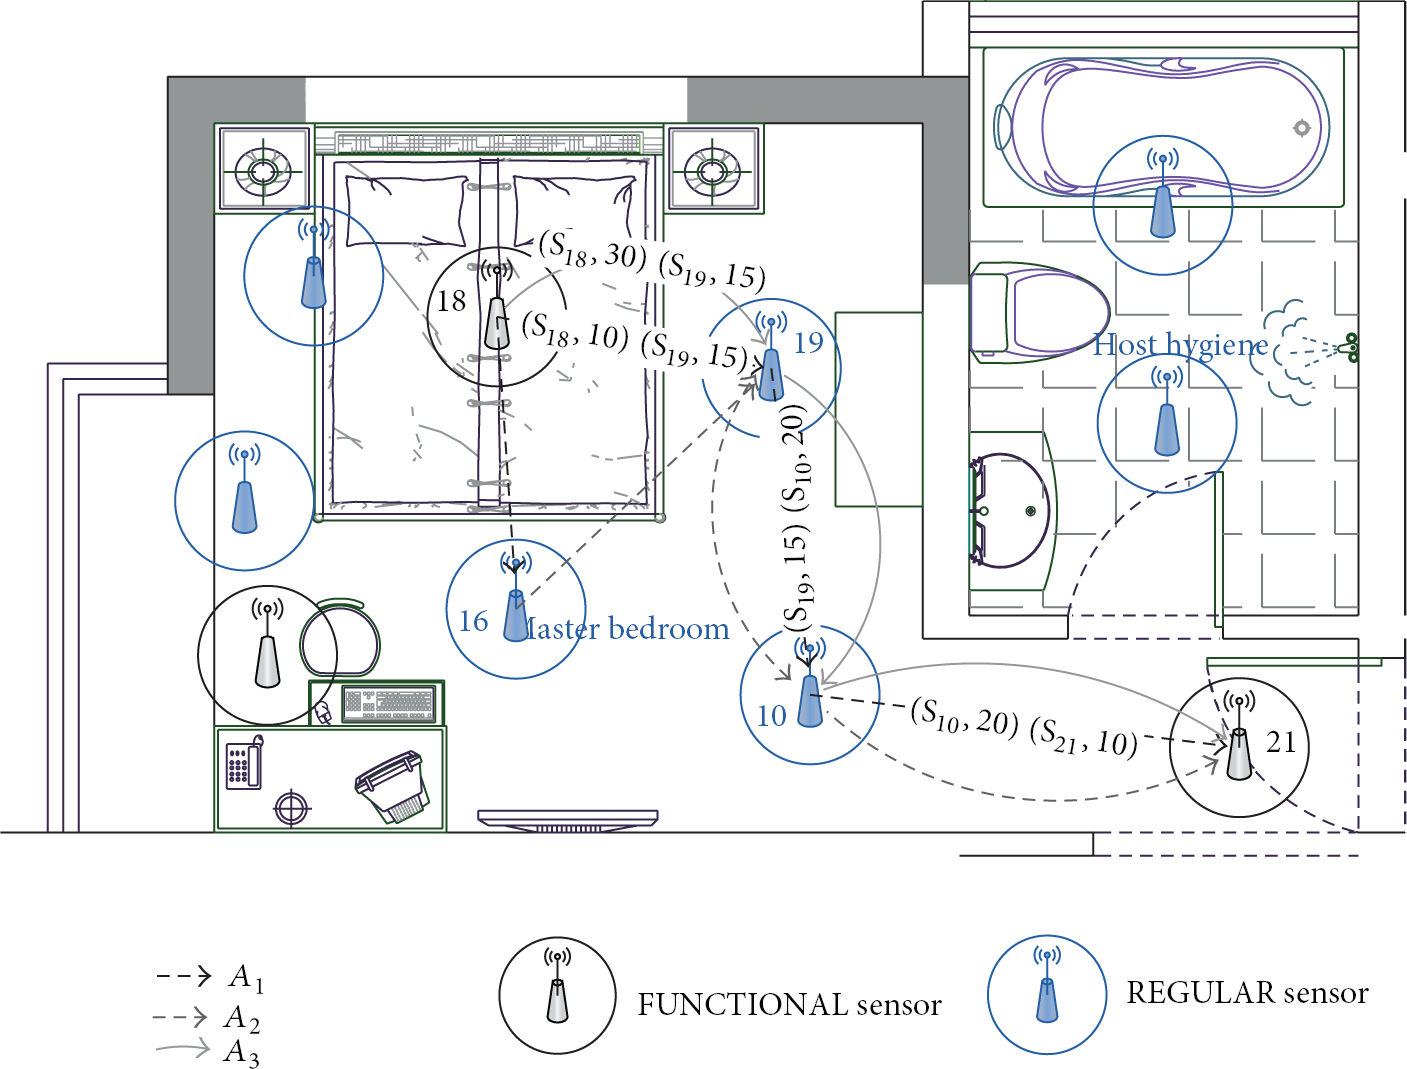
Basic structure of smart environment. Based on the position of sensors, sensors are divided into FUNCTIONAL sensors and REGULAR sensors. The lines represent the activity of trajectory and the tuples in the line express the ID and the duration of sensor.
3.1. Activity Model
Now we define the terminologies used in this work. Let
An atomic activity
A basic activity
An Activity
The trajectory set
In this paper, sensors have been divided into FUNCTIONAL sensors and REGULAR sensors according to the deployment location for data segment. In order to mine more valuable knowledge from sensors triggering history data, a complete trajectory set
Definition 1.
When the frequency of an activity
In trajectory-based activity recognition, the temporal relationship is merely the foundation of sequence determination [12], and this could lead to errors of activity recognition. Taking activity
Fuzzy Logic [15] is adopted to measure the duration time
(i) Membership Function. We choose trapezoidal function as membership function to reduce the computational complexity [17]. The relevant parameters are set according to the classification of duration.
(ii) Rule Base. The duration

Rule base: the three levels of duration.
(iii) Defuzzifier. The mean of maximum method is the most suitable for our approach.
Take activity
3.2. Activity Variation
Activity Variation. It is a common sense that the same pattern of activities may not be repeated exactly the same. So some small differences between these same activities are shown in spatiotemporal information of data set. According to the definition of activity model, the activity variation which contains trajectory variation and duration variation is introduced to measure these tiny differences.
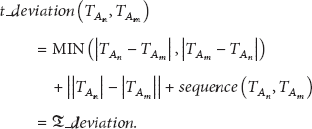
(i) Trajectory Variation. Take
(1) extract the subset in which the items correspond to the items in (2) (3) (4) (5) (6) (7) (8)
(ii) Duration Variation. As mentioned above,
(1) extract the subset in which the items correspond to the items in (2) (3) (4) get (5) (6) (7) (8) (9)
Based on (1) and Algorithm 2,
Definition 2.
Abnormal activity is defined as the one which has a great deviation in the data against normal activities. According to the proposed (2), abnormal activity can be calculated as follows: for an activity
If hash function is employed [18], then the time complexity of (2) can be
4. DetectingAct
The process of DetectingAct is as follows. Firstly, it extracts the normal activity patterns from the original data and introduces compression algorithms to reduce the number of mined patterns of activity. Secondly, it stores the mined patterns in each node according to the storage mechanism. Thirdly, it detects the abnormal activity using the distributed detecting algorithm.
4.1. Frequent Pattern Mining, Compression, and Storage
In order to detect the abnormal activity, it is necessary to mine normal activity patterns from the sensor data. Currently, most of the learning algorithms for sensor data are supervised which requires large amounts of labeled data, so the unsupervised learning algorithm can save labor and accelerate the learning speed [19]. Based on the Definition 1, it is feasible to use frequent pattern mining technique [19] to mine normal activity patterns. By the frequent pattern mining technique [19], if the frequency of an itemset, which is an activity in this paper, exceeds the minimum support threshold λ, it is a normal activity. Each path from root node to leaf node represents a pattern
FP-Tree. Frequent-pattern Tree, or FP-Tree in short, is an extended prefix-tree structure storing crucial, quantitative information about frequent patterns [17]. According to the definition of activity model, the FP-Tree for trajectory-based mining cannot meet the requirement in this paper; thus, duration-dependent FP-Tree is proposed. Taking

Difference between two types of FP-Tree. (a) The right one is trajectory-based FP-Tree and (b) the left one is duration-dependent FP-Tree.
Before introducing the mining algorithm duration-dependent frequent pattern mining algorithm (DFPMA), related variables are defined in Table 1. The mining algorithm is shown in Algorithm 3.
Definitions of variables related to Algorithm 3.

(1) (2) (4) (5) (6) (7) (8) (9) (10) assigns the next item in database to (11) (12) (13) (14) (15) add (16) (17) (18) (19)
Here we explain the
Considering the limited storage of sensors, it is necessary to compress mined frequent patterns. Thus, normal patterns compression algorithm (NPCA) is introduced. It is shown in Algorithm 4 and related parameters are defined in Table 2.
Definitions of variables related to Algorithm 4.

(1) sort represents the count of activities in (2) (3) get the first activity pattern (4) (5) delete (6) (7) delete (8) (9) (10) delete (11) sort (12) (13)
In order to detect abnormality distributedly, normal activity patterns need to be stored in each sensor. Distributed knowledge storage mechanism (DKSM) is introduced to store the knowledge distributedly. DKSM consists of sensor ID
The

Field previous sensor stores the sensor IDs before triggering
4.2. Distributed Abnormal Activity Detection
Communication protocol and detection algorithm are necessary to detect the activity. This paper designs the abnormal activity detection protocol (AADP) to transmit the activity data among the sensors.
4.2.1. Abnormal Activity Detection Protocol
Figure 4 illustrates how AADP works. State-change message is designed for AADP to record the present activity and it is composed of the previous triggered sensor set

Workflow of AADP.
4.2.2. Distributed Abnormal Activity Detection Algorithm
According to Definition 2, distributed abnormal activity detection algorithm (DAADA) is proposed and the related parameters are defined in Table 4. The detection algorithm is shown in Algorithm 5, and the time complexity of the algorithms is
Definitions of variables related to Algorithm 5.

(1) (2) add (3) add (4) restructure (5) (6) (7) (8) (9) (10) (11) label (12)
5. Experiments
To prove the feasibility and to estimate the accuracy of DetectingAct, the simulation experiment and the real experiment are conducted.
5.1. Simulation Experiment
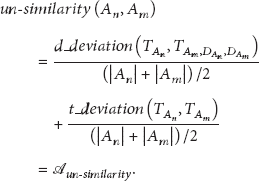
As a simulation example with ground truth, we adopt smart environment simulator tool [14] to simulate the motion sensor-based smart environment and manually set the knowledge instead of real environment training.
(i) Sensor. We set up a total of 35 sensors in the simulation environment which is shown in Figure 5.
The simulation smart environment with motion sensor installed.
(ii) Trajectory. 10 normal trajectories whose average length is 12 and that reflect the typical situation when user lives in the simulation environment are designed.
(iii) Duration. According to sensor
After these settings, the simulation detection system corresponds to a real system which has completed the operation of the DFPMA, the NPCA, and the DKSM.
Detecting.
Ground truth versus discovered abnormalities.

The result of contrast test in simulation experiment.
Taking duration into consideration, there are two important indexes in the simulation experiment. First, the average-speed is denoted by
Accuracy. Experimental results under variation threshold
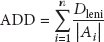
Real-Time Property. The parameter average detection distance (ADD) is designed to measure the real-time property, and ADD is calculated as follows:
Stability. The increasing amount of data and artificially raising of variation threshold lead to the increasing of false rate (
Figure 7 shows the following. (1) Under the same data environment, the larger γ is, the higher the compression ratio and the false rate are. However, with appropriate thresholds selection, with appropriate thresholds selection is able to achieve a good balance between the compression ratio and the false rate. (2) The false rate is increasing as the amount of data increases, but the growth is limited and the false rate is acceptable. Thus, DetectingAct also keeps strong stability.

The result of contrast test with different γ.
5.2. Real Experiment
In this section, a real experiment is conducted to prove the feasibility and to estimate the accuracy of DetectingAct.
5.2.1. The Feasibility of DetectingAct
The algorithm that each sensor will execute is DAADA (Algorithm 5). As the time complexity of the main statement in Line 7 of Algorithm 5 is Using MSP430 with a considerable computing capacity as MCU (microcontroller), TelosW can meet the computational demands of DetectingAct. Having the wake-on sensing capability, TelosW can construct a completely event-driven wake-on sensor network that remarkably reduces energy consumption. Being equipped with an onboard energy meter TelosW can precisely measure in situ energy consumption making it possible to practically analyze energy-efficient protocols.
TelosW has the flash storage of 1 MB, which means that if the average length of stored pattern is 10, then
Performance test.

5.2.2. Experimental Setup and Results
The test bed for validating our algorithms is a workplace located on the Chongqing University campus. The experiment allows participants to find the specified room within the workplace. A total of 12 student volunteers are invited to participate and divided into two groups. Members of group 1 are familiar with the environment, while members of group 2 are not. About 41 sensors evenly are arranged in the rooms and hallways of the building which is shown in Figure 8. The deployed sensor node is TelosW and the sample position of sensor node is represented in Figure 9. Two experiments are conducted to validate the effectivity of DetectingAct, and six tasks, which need participants to start from specific rooms and find other specific rooms in the workplace, are designed. For example, task 522-523 represents that the participant should start from NO.522 room and find NO.523 room. Furthermore, the specified room is randomly appointed in order to ensure the fairness of the results. In the first experiment, each participant in group 2 is invited to accomplish the assigned tasks. In the second experiment, participants of group 1 are asked to repeat the same tasks under a different experimental condition.

Motion sensor network deployment in a smart workplace environment. The sensor node position and SensorID are shown.

The smart environment example deployed with motion sensors.
Training. Before the beginning of the experiment, the detection system is set up by using a real-world trajectory dataset which is generated by three weeks of normal daily life in the test bed of group 1. Based on the collected data and proposed DFPMA, 762 activity patterns are extracted. After that, the related knowledge is distributedly stored into each sensor node by utilizing NPCA and DKSM, and the details are shown in Table 7.
The number of patterns stored in sensor.

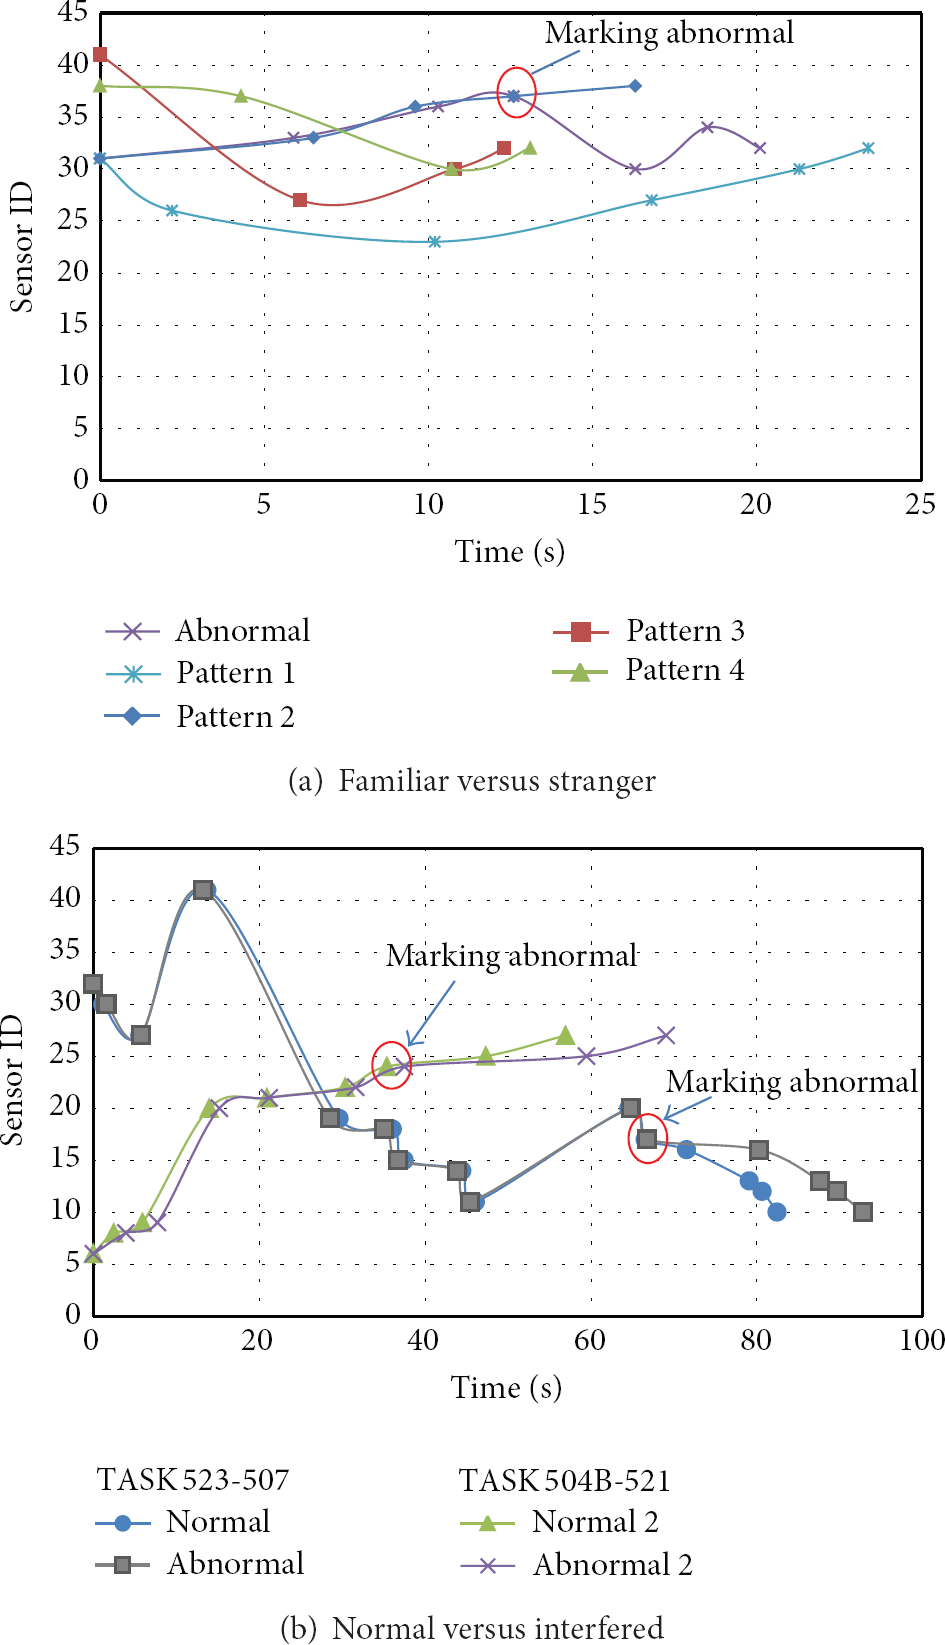
Familiarity and Unfamiliarity. In the first experiment, each participant must finish the six tasks alone without prompting or interference. Their trajectories with durations are tracked to implement the real-time abnormal activity detection by utilizing DAADA as shown in Algorithm 5. From Table 8, we can see that, in practice, the numbers of sensors that participants triggered in the same task mostly have significant difference; in other words, the unfamiliar participant (stranger) makes an uncommon trajectory which is different from the regular pattern; therefore, it can decide whether the activity is normal. Taking task 516–500 as an example, Figure 10(a) illustrates the detection process in details. The participant's trajectory is detected in real-time to match the approximate normal patterns. According to the first four triggered sensors, the present trajectory indicates a great possibility of pattern 2 stored in sensors. However, from 12.5 seconds it deflects from the previous possibility of pattern 2 and mismatches any normal patterns. So this activity is labeled as abnormal at the 5th sensor.
The number of sensors triggered by familiar versus stranger.

Experimental result.
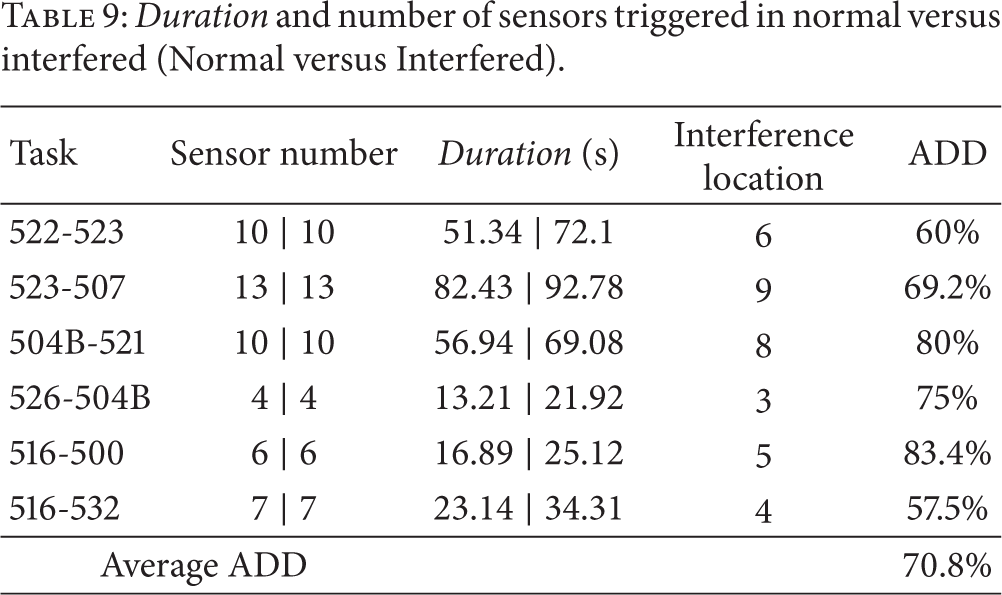
Normal versus Interfered Experimental Condition. In the second experiment, participants of group 1 are required to simulate abnormal situation. The real abnormal phenomena, such as illness and tumble, are difficult to simulate. Therefore, some disturbances, such as giving a call to a random participant during the task or arranging some publicity announcement column in the corridor, are added into the task to distract the participant's attention for simulating the approximate abnormal phenomenon. Due to employing distributed method instead of centralized computing which collects data and detects abnormality only after accomplishing the whole activity, our algorithm real-timely detects abnormality without waiting for the completion of activities, so that the performance of real-time is greatly enhanced by DetectingAct. Therefore, the interferences are randomly generated without too former or too later to avoid deliberate effect on the efficiency of detection. The result is shown in Table 9, which illuminates that the same tasks have the same number of triggered sensors whether the experimental condition is normal or interfered, but the durations are obviously different when the participant is interfered. Depending on the difference, the activities can be efficiently decided whether it is normal or abnormal by using DetectingAct. Taking task 523–507 as an example, Figure 10(b) shows the participant started from NO.523 room with transition
Duration and number of sensors triggered in normal versus interfered (Normal versus Interfered).
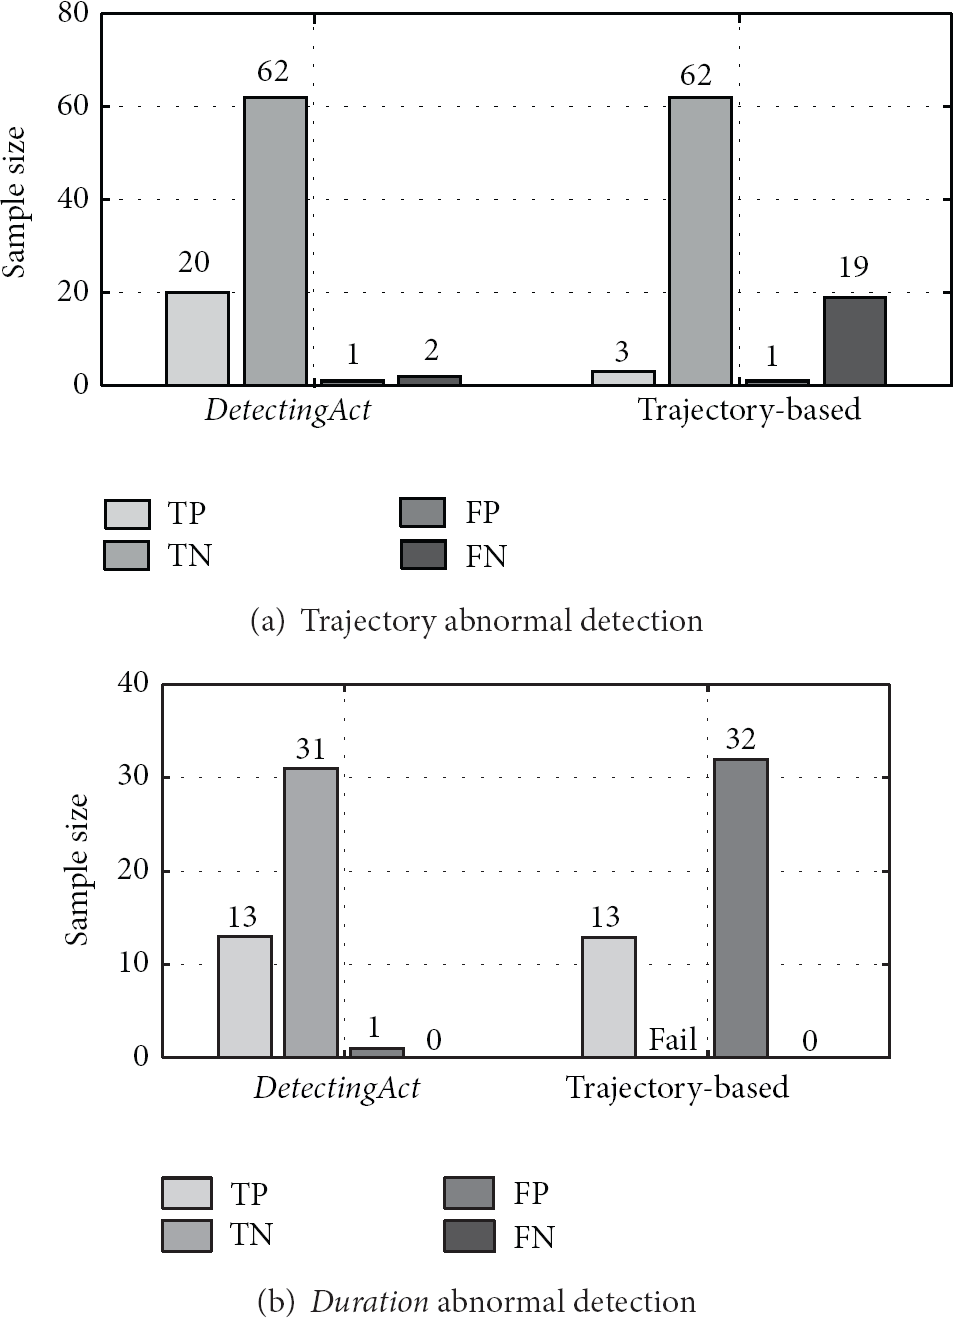
From Figures 11(a) and 11(b), it can be seen that, in practice, experimental results demonstrate the effectiveness and suitability of our approach.

Experimental result.
6. Conclusion
Based on the spatiotemporal information of data, this paper defines activity model and proposes DetectingAct which takes full advantage of computing and storage resources in each sensor node to detect abnormal activity. According to the definition of activity, we introduce the mining algorithm, the compression algorithm, and the storage mechanism to mine, compress, and store normal activity patterns. To detect abnormality distributedly, we apply the protocol AADP and the algorithm DAADA. The real experiment and the simulation experiments prove the feasibility and performance of DetectingAct.
Footnotes
Conflict of Interests
The authors declare that there is no conflict of interests regarding the publication of this paper.
Acknowledgments
The works is supported by the National Natural Science Foundation of China under Grant No. 61004112 and the Fundamental Research Funds for the Central Universities No. CDJZR12180006.