
Abstract
The configurational and dynamic characteristics of water entry supercavities influenced by turbulent drag-reducing additives were studied through supercavitating projectile approach, experimentally and numerically. The projectile was projected vertically into water and aqueous solution of CTAC with weight concentrations of 100, 500, and 1000 ppm, respectively, using a pneumatic nail gun. The trajectories of the projectile and the supercavity configuration were recorded by a high-speed CCD camera. Besides, water entry supercavities in water and CTAC solution were numerically simulated based on unsteady RANS scheme, together with application of VOF multiphase model. The Cross viscosity model was adopted to represent the fluid property of CTAC solution. It was obtained that the numerical simulation results are in consistence with experimental data. Numerical and experimental results all show that the length and diameter of supercavity in drag-reducing solution are larger than those in water, and the drag coefficient is smaller than that in water; the maintaining time of supercavity is longer in solution as well. The surface tension plays an important role in maintaining the cavity. Turbulent drag-reducing additives have the potential in enhancement of supercavitation and drag reduction.
1. Introduction
Experiments on water entry supercavitation formed by projectile can provide critical data to support fundamental research of supercavitating flow. When a projectile enters water from the air, its behavior comprises a series of complicated events which occur both above and below the original water surface. For vertical water entry flow of a projectile, the forward portion of the projectile nose is first wetted. The nose gives a velocity to the water and the flow surface is separated from the projectile nose forming a cavity. The air rushes in and fills the cavity. Later on, the splash forms a dome which closes over the entry point and seals the cavity from the air above. When this “surface closure” occurs, the cavity usually expands so that the cavity pressure tends to decrease. The pressure above the water is then greater than that in the cavity; the cavity is then pushed down from the water surface. The separation of the top of the cavity from the water surface has been called “pull-away.” The cavity then travels with the projectile down into the water. Since the pressure inside the cavity is smaller than the pressure in the surrounding water, the cavity boundary is accelerated inward. When opposite boundaries of a cavity touch at a point, “deep closure” occurs. This closure separates the cavity into two parts and decreases the size of the cavity. A series of deep closures occur, and the air content in the cavity is continually reduced until, finally, no cavity remains and the projectile is fully wetted. Normally these cavities collapse immediately behind the projectile passage. However, with sufficiently high navigating speed and proper design features of the projectile, a large cavity enveloping the entire projectile body can be created, which may persist a long distance in the projectile passage. This phenomenon is called water entry supercavitation. In the studies of water entry supercavitation, an important topic is the fluid dynamics of the supercavitation formed behind the projectile after it impacts the water at some distance. The cavity formed during water entry of a projectile exhibits a wide range of dynamic response characteristics, such as drag alteration, velocity attenuation, penetration distance, and shape of the cavity, which depend primarily on the type of projectile and its impact velocity.
Scientific research of water entry phenomenon was initiated from the beginning of the 19th century. Worthington and Cole [1, 2] first used single-spark photography to examine the air cavity formed by the vertical entry of spheres into water. The advent of high-speed cine photography allowed for quantitative measurements of cavitating flow. The most extensive one was conducted by May with a view to naval ordinance applications [3]. Attention to water entry supercavitation research has been significantly increased over the past decade. The realization of supercavitation being used to reduce drag on an underwater vehicle occurred long time ago and a number of applications have emerged. A demand in this research area has arisen for the optimal design of cavitator. A projectile enveloped with a supercavity has only a wetted nose, resulting in a low drag environment for under water flight. Because the density and dynamic viscosity of air and vapor are much lower than those of water, the skin friction felt by the projectile in a supercavitating flow can be reduced dramatically. An appropriately designed projectile can utilize the phenomenon of supercavitation to achieve global stability and a reduction in overall hydrodynamic drag. If the configuration of the supercavity is effectively controlled, the drag can be reduced by one to two orders of magnitude [4]. The study of water entry supercavity and the underwater motion has wide applications in military field, such as the navigation of torpedoes and underwater bullets. Supercavitating projectile has been used for mine disarmament [5] and proposed for use as defense against torpedoes [6] as well.
Supercavitation can be formed either naturally or artificially. A natural supercavity is the result of hydrodynamic pressure reduction in the liquid surrounding a solid body. An artificial supercavity is formed with the help of ventilated gas from other sources. This gas can help a small natural cavity grow or can form a cavity in a low pressure liquid region, enabling supercavitation at much lower projectile speeds. The ventilation gas can come from a variety of sources including propulsion exhaust gases, compressed gas carried onboard the projectile, or entrained air from above the water surface. The present work deals with natural supercavitation. Excellent discussions of supercavitating projectiles were presented in [3]. The investigation in this work is about a kind of supercavitating projectile.
The study of supercavitating bodies has largely been conducted in water tunnels or using other large and elaborate facilities. For the case of simpler and smaller setups, there has been little documentation of experimental performance and test results. Experimental work in the US, for example, on supercavitating bodies has been carried out mainly at the Naval Undersea Warfare Center (NUWC) in Newport, Rhode Island, and at Pennsylvania State University, State College, PA. The numerous researches and development efforts have produced such items as the adaptable high-speed undersea munitions and projectiles for the rapid airborne mine clearance system. Application of supercavitation drag reduction at munitions scales can result in short-range vehicles capable of subsonic to supersonic velocities (exceeding 1500 m/s in water). Hrubes [7] gave a detailed description of an experimental study carried out at NUWC using very high-speed projectiles.
Cavitation number (σ), Froude number (Fr), and Weber number (We) are key parameters used for characterizing water entry cavitating flow, which are defined as follows:

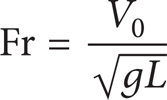

Herein, p∞ is the hydrostatic pressure in the ambient liquid and p v is the vapor pressure. In water entry supercavitating flows, this may not, however, represent the actual pressure difference since the cavity pressure may not equal the vapor pressure. The true scaling parameter is referred to as the relative underpressure of the cavity, where p v in (1) is replaced by the cavity pressure p c . Supercavitation usually occurs at cavitation numbers below approximately 0.1. ρ is the liquid density, V0 is the initial velocity of the projectile at water impact, L is the characteristic length (for the water entry of axially symmetric bodies, L is usually taken as the projectile diameter), γ is the surface tension coefficient, and g is the acceleration of gravity. The Froude number (Fr), which compares the inertial force with the gravitational force, has special pertinence to problems in which there is a free surface, that is, an air-water interface. Dependence on the Froude number is the strongest when its value is small, corresponding to greater influence of gravity. The Weber number (We) compares the surface tension force with inertial force, which is of importance for small projectile at low speeds. It is well known that the cavity shape depends principally on the cavitation number (σ) [8], in which the numerator p∞-p c is the pressure tending to close the cavity and the denominator 0.5ρV02 is the dynamic pressure effective in resisting this closure.
The key point of maintaining a cavity to survive is to stabilize the surrounding liquid-gas or liquid-vapor interface. As comprehensively expatiated in our previous paper [9], some aqueous solutions of surfactant may possess threefold effects, that is, reduced surface tension as compared with water, turbulent drag-reducing effect, and enhanced occurrence of boiling phenomenon, which may all play positive roles in the supercavitating drag reduction of underwater navigators. Based on such considerations, we have proposed a novel control strategy for supercavitating flows using turbulent drag-reducing surfactant additives [9]. Note that, in order to realize an environment of drag-reducing solution for water entry projectile, of course, we do not need to make the entire water reservoir be solution but only need to make a solution environment locally surrounding the navigator. In [9], we have performed numerical simulations of natural supercavitation around an underwater navigator in drag-reducing solutions. The influences of cavitation number, surface tension, viscosity, and viscoelasticity on the characteristics of underwater supercavitating flow have been investigated. In the present paper, we present our continuous study on the characteristics of supercavitation influenced by turbulent drag-reducing surfactant additives. Experiments and numerical simulations have been conducted for a water entry supercavitating flow of a projectile, through which we study how the drag-reducing surfactant additives influence a water entry supercavitating process.
2. Experimental Procedures
Figure 1 shows a schematic of the experimental apparatus. Launching device is fixed at the top of a water tank. Shots were launched vertically downward. The water tank is made of Perspex, with a cross-section of 30 cm × 30 cm and depth of 120 cm. To ensure the same water level at every launch, a straight line is marked at the one-meter height on the water tank and every time the water level was at this distinguishing mark. The tank wall is transparent, which allowed for visual imaging while keeping the camera on the exterior of the tank. This simplifies the setup and reduces the risk of equipment damage due to water or violent motion. A CCD camera was used to visualize the supercavitation image surrounding the projectile at three points along the projectile trajectory: one at the liquid free surface, one at half way down the flight path, and the third at a location close to the tank bottom. The sampled side view images provide quantitative measures of supercavity dimensions and projectile trajectory. Important supercavity dimensions are the maximum diameter and length after deep closure. Imaging at the liquid-surface location allows for observation of projectile water entry dynamics. Imaging at the midflight location provides side view frames of the fully developed supercavity. The lowest viewing window at the bottom location is used to observe the cavity collapses phenomenon. In doing so, the entire flight path scenario can be obtained, which enables the experimenter to see overall cavity shape and general projectile dynamics.

Schematic diagram of experiment setup.
The images of the projectile and supercavity during water entry process and free flying in the liquid were recorded at 638 fps (frames per second) using a Pco.1200s CCD camera and a Zoom 7000 lens. Lighting was achieved using two 1000 W/220 V dual camera lights (X5Jx1300x2). Typical image exposure time used in the experiments is 50 μs. Exposure time is dependent on the amount of light available and is desired to be as short as possible for clarity and accuracy of cavity dimension and penetration distance measurements. High image resolution, however, is also desired for measurement precision. The trade-off between image resolution and sampling frame rate leads to the use of the lowest frame rate of the used CCD camera that still captures enough frames for speed measurements and ensures that one frame captures the whole projectile body. The latter requirement is necessary so that the diameter of the supercavity along the projectile length can be measured. The resolution and frame rate used for the experiment was 240 × 1016 pixels at 638 fps (the interval between two images is 1.56 ms).
A pneumatic nail gun was used as the projectile launcher, which was connected to an air compressor (0–0.85 MPa). The projectile was designed to fly in a globally stable supercavitation regime. The projectile is made of stainless steel. It has cylindrical configuration with a blunt head, 7 mm in diameter and 30 mm in length. It is assumed that the projectile keeps the same velocity before it impacts the liquid surface (with negligible resistance when flying in the air in a short distance). The cavity dimensions were calculated based on a set of frames, where the whole projectile was visible. Because of the same set of the camera, the size of the pictures is exactly the same. Then the actual size Y is equal to k*y (k is proportion coefficient; y is the dimension in the picture). Before the experiment a visible ruler was fixed inside the water tank wall and the ruler was ensured to be taken into the picture. Thus, k = B/b, where B is the unit length of the ruler and b is the length of the image corresponding to the unit length B. Two adjacent pictures were used to calculate the initial velocity of the projectile (V0). The displacement of the projectile tip between the two pictures is noted as S and V = S/Δt (Δt = 1.56 ms). And then we got the relationship between the launching pressure P (in MPa) of the pneumatic nail gun and projectile initial velocity: V0 = 29.506 P + 10.782 with good linearity, as shown in Figure 2.
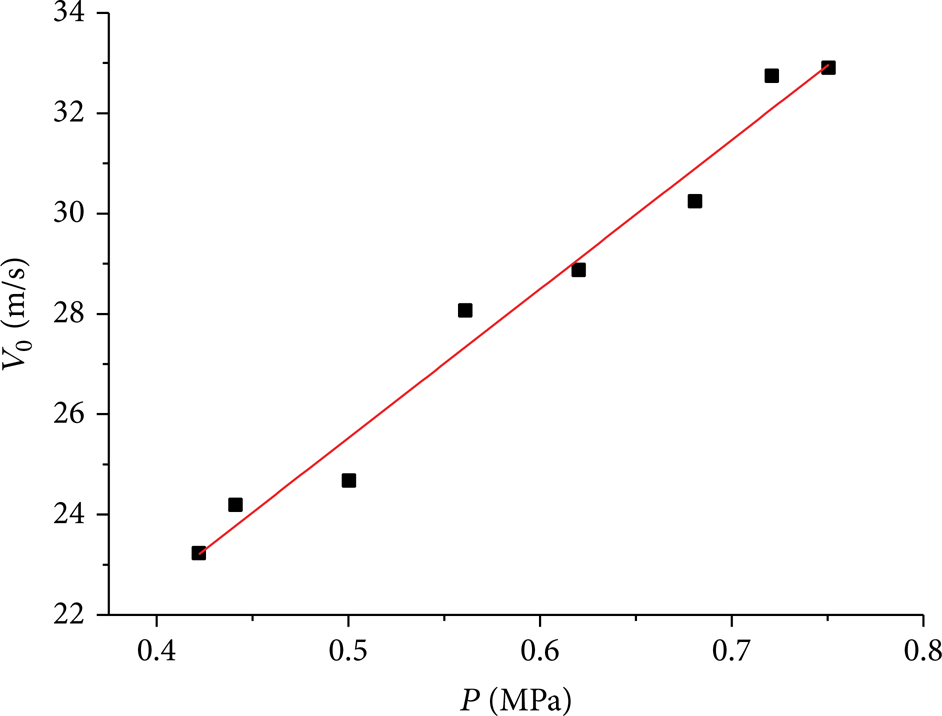
The initial velocity versus projectile-driving pressure.
The working fluid used in this experiment was a viscoelastic aqueous solution of surfactant with turbulent drag-reducing effect. The cationic surfactant used herein was cetyltrimethyl ammonium chloride (CTAC) with molecular weight of 320.0 g/mol, which is less affected by calcium and sodium naturally existing in tap water. Sodium salicylate (NaSal) with molecular weight of 160.1 g/mol was added to the solution with the same weight concentration as that of CTAC to provide counterions. The surfactant solution is only marked by CTAC concentration. Three mass concentrations of 100, 500, and 1000 ppm (part per million) of the surfactant solution were used in the experiment by dissolving CTAC and NaSal in tap water.
3. Experimental Results
Figure 3 presents an image taken by the high-speed camera showing an example of the supercavity produced by a projectile after the first deep closure in water. It shows a case where the projectile body was in the center of the cavity. The cavity is transparent and does not exhibit blisters on the wall.

A typical image of supercavity formed in water.
First we investigated the cylindrical projectile with a blunt head at low speed (4 m/s). Consider a solid cylindrical projectile with density ρ s and length L vertical impacting a horizontal water surface with speed V0. The impact of a cylindrical projectile that creates a subsurface air cavity has several distinct features. Figure 4 shows a time series of the cylindrical projectile (Fr = 54, We = 6682), demonstrating the entire process from the beginning of entry at the water surface to the formation of a cavity behind the projectile and finally the collapse of the cavity into bubbles. The first significant phenomenon is that, shortly after the impact of projectile on the water surface, upward moving jettings and a laterally expanding splash are formed above the surface, and the projectile is suddenly surrounded by the splash. The second significant phenomenon is that, as the projectile penetrates into water, a cavity under the surface is formed. During this time period, the air from atmosphere comes into the cavity continually. Initially, the air entrainment is due to the gas flow induced by the projectile. Then the air is entrained into the cavity by the negative pressure of the cavity. The reason for the negative pressure is that in water entry, the volume of the cavity increases rapidly and the cavity cannot keep its thermodynamic state in equilibrium. Later, the airflow into the cavity is ended by the surface closure by the splash and the enclosed cavity is pulled away from the surface by the downward moving projectile. An axisymmetric cavity is evident below the surface with a splash curtain above. The evolution of the splash curtain is described by Aristoff and Bush [10]. The cavity adjoins the projectile near its equator. As the projectile descends, it transfers momentum to the fluid by forcing it radially outward. This inertial expansion of the fluid is resisted by hydrostatic pressure, which eventually reverses the direction of the radial flow, thereby initiating cavity collapse. The collapse accelerates until the moment of pinch-off, at which the cavity is divided into two separate cavities. The upper cavity continues collapsing in such a way that a vigorous jet is formed that may ascend well above the initial drop height of the projectile. The lower cavity remains attached to the projectile and may undergo oscillations. A relatively weak downward jet is also observed to penetrate this lower cavity. The series of imaging observed in the experiment agree well with the description by May [3]. The discussion below is about the comparison of the water entry supercavity in water and CTAC solution at different concentrations. Experimental observation shows that the configuration of the supercavity in CTAC aqueous solution is significantly different from that in water at the same initial condition.
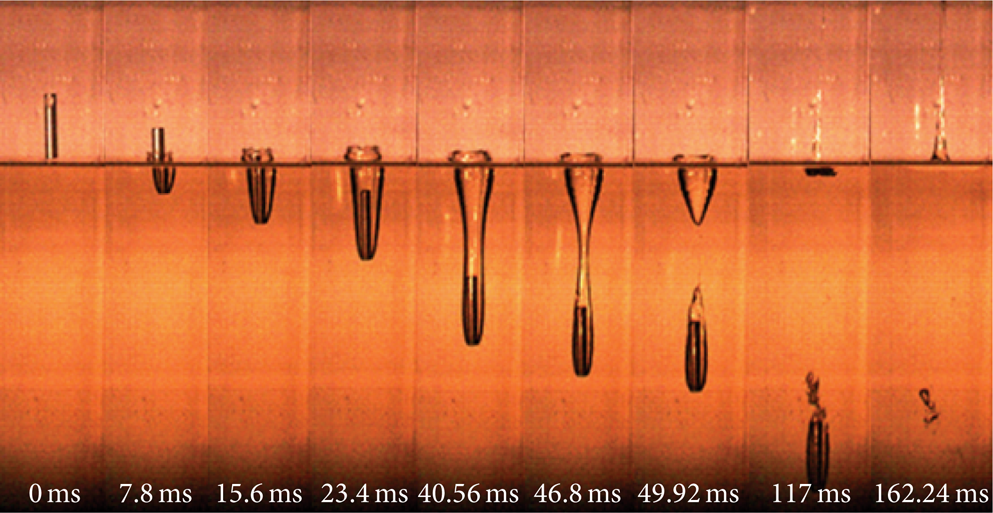
Time history of phenomena accompanying water entry for blunt-head projectile with entry velocity of 4 m/s.
Figure 5 illustrates the supercavity imaging in CTAC aqueous solutions at different concentrations and different depths. It is seen from Figure 5(a) that, at the same initial velocity, the cavity volume is distinctly larger in CTAC solution than that in water as the supercavity is formed after the deep closure. For example, the length of the supercavity in CTAC solution of 100 ppm concentration is about twice the length in water. Figure 5(b) shows an example of the typical configuration in the middle part of the trajectory. The cavity in water has already degenerated into sheet cavity; meanwhile the sheet cavity just appears in the tail of the supercavity in CTAC solution. Most part of the supercavities in CTAC solutions is transparent. When the projectile moves to the lower part of the trajectory as shown in Figure 5(c), the cavity in water cannot keep the ellipsoidal configuration and collapses to small bubble clusters, and the projectile cannot maintain its vertical moving direction; nevertheless the cavity in 100 ppm CTAC solution becomes cloudy cavity, and the cavities in 500 ppm and 1000 ppm CTAC solutions are still sheet cavities with ellipsoidal configuration. The above experimental results show that the size of supercavities in CTAC aqueous solutions are larger than those in water and maintaining distances of supercavity are longer than those in water as well, indicating that the resistance of projectile travelling in CTAC aqueous solution is smaller than that in water.

The configurations of supercavity formed around the water entry projectile in CTAC aqueous solutions at different concentrations, taken in (a) the upper part, (b) the middle part, and (c) the lower part (as indicated in Figure 1) of water tan.
For projectile projected into water, the supercavity length increases with the decrease of cavitation number. Reichardt [11] stated that for axially symmetric cavity the ratio of length to cavitator diameter is the function of cavitation number. It is shown in our experiment that the size of supercavity after deep closure relates to both cavitation number and concentration of CTAC solution. The nondimensional length L = L c /D n and diameter D = D c /D n of the cavities (where L c is the cavity length, D c is the biggest cavity section diameter, and D n is the diameter of the cylindrical projectile) in water and drag-reducing CTAC solutions are compared in Figures 6 and 7, respectively. For water entry supercavitation in both water and CTAC solution, the relationships between the nondimensional length and diameter and the cavitation number can be fitted by the power law functions, as shown in Table 1.
The fitted power law functions showing the relationship between the nondimensional length and diameter of water entry supercavity and the cavitation number.


Nondimensional length versus cavitation number.

Nondimensional diameter versus cavitation number.
For water case, the fitted power law function of L = f(σ) is similar to that reported by Jia et al. [12], which demonstrates that the presently measured data are reliable. As shown in Figure 6, the fitting curves of L = f(σ) for CTAC solutions at three different concentrations are all above that of water, indicating that at the same cavitation number the length of supercavity formed in drag-reducing solution is larger than that in water. The differences of the fitting curves for the three CTAC solution cases at different concentrations may be caused by the increasing viscosity. Similarly, it can be seen from Figure 7 that the diameter of supercavity in drag-reducing solution is larger than that in water; meanwhile, the solution concentration has effect on the diameter of the supercavity as well.
When the projectile impacts on the liquid surface, part of kinetic energy transports to the liquid, which causes the liquid jet and radial splash. The energy loss of projectile can be calculated by the projectile kinetic energy before water entry subtracting it after water entry. Figure 8 illustrates the energy loss rate, δE = (Ebefore − Eafter)/Ebefore, when the projectile is projected into water and CTAC solution at three different concentrations, respectively. We can see from Figure 8 that δE is between 39% and 51% overall in the experiment; for the cases of water, 500 ppm and 1000 ppm CTAC solutions, δE keeps almost constant; for 100 ppm CTAC solution, δE decreases with the increase of the water entry velocity of the projectile; δE is the largest in 1000 ppm CTAC solution. When the projectile velocity is below 21 m/s, δE in water is smaller than that in solutions; when the projectile velocity is above 21 m/s, δE in 100 ppm CTAC solution decreases to the value smaller than that in water. The explanation will be presented afterwards.
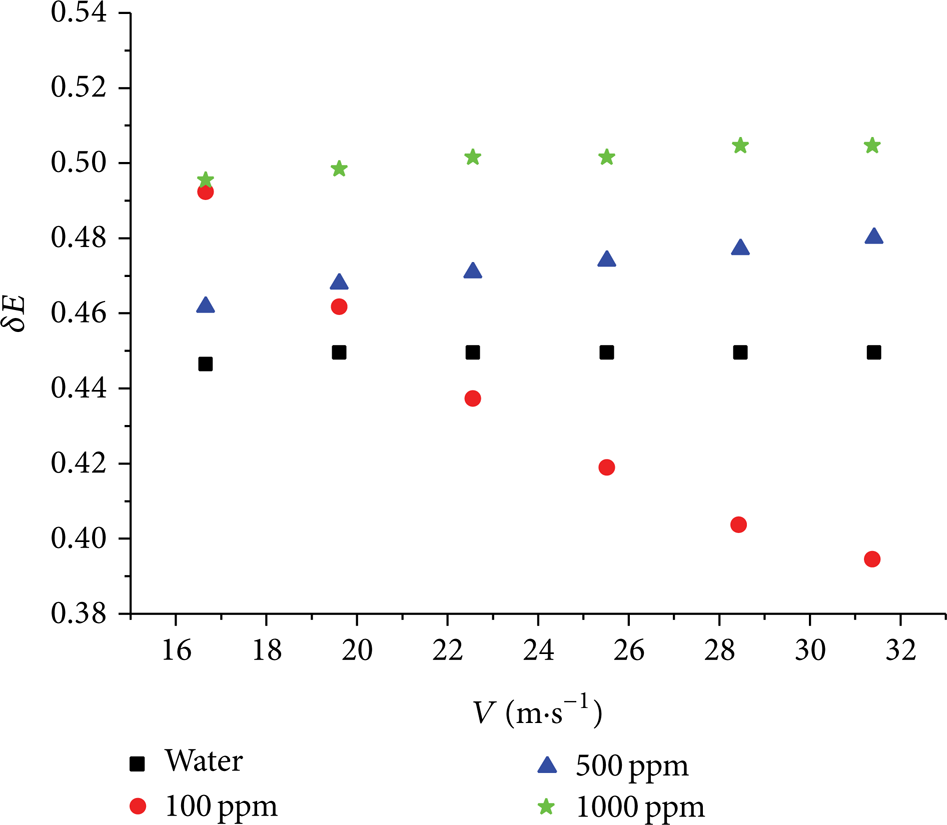
The kinetic energy loss of the projectile impact on the liquid surface.
Figure 9 is the graphical representation of projectile velocity at different depth when the projectile is projected into water and 500 ppm CTAC solution, respectively, at the same initial velocity (V0 = 28.4 m/s). At the upper part (0.1 m depth), the velocity is almost the same in water and in solutions; with the move of the projectile, in the middle part and lower part, the projectile velocities in solutions are both larger than that in water (see Figure 9 for the case of 500 ppm CTAC solution as an example). As shown in Figure 8, at the same initial velocity of V0 = 28.4 m/s, the projectile loses more kinetic energy in 500 ppm solution than in water when impacting the water face, but after moving some distance, the projectile velocity in CTAC solution becomes larger, indicating that the projectile flying in drag-reducing solution is subject to smaller resistance. Note that the used drag-reducing CTAC solution behaves two key characteristics, namely, viscoelasticity and the shear-thinning effect in the shear viscosity. Previous researches on turbulent drag-reducing flows of surfactant solutions indicated that the occurrence of drag reduction is attributed to both of the two characteristics. This should be also the case for the presently investigated water entry flows. On the other hand, the fact that more air rushes into the cavity formed in CTAC solution than in water can be another benefit accounting for drag reduction.

The velocity of the projectile at different depth in CTAC aqueous solutions with different concentrations.
Figure 10 shows time-serial pictures indicating the processes of projectile impacting on liquid free surface, forming open cavity and cavity closure after the projectile is projected into water and 1000 ppm CTAC solution, respectively, at an initial velocity V0 = 28.4 m/s. Comparing with Figure 4 showing the detailed process of water entry supercavitating flow at a much lower initial velocity V0 = 4 m/s, Figure 10(a) shows again the supercavitation forming process in water but at a much faster speed. Figure 10(b) shows that, in 1000 ppm CTAC solution, the open cavity process stays longer than that in water. The time of open cavity process is about 3.12 ms in water but about 4.68 ms in 1000 ppm CTAC solution, which means that before the surface closure there is more air rushing into the cavity. This phenomenon can explain why the cavity size is larger in solution than in water qualitatively. The supercavity is larger in size in solutions than in water, which can explain that the supercavity in solutions can maintain longer time than in water. The maintaining of supercavity makes the projectile resist smaller drag, which can explain the phenomenon shown in Figures 8 and 9: for the cases of 500 ppm and 1000 ppm solutions, in spite of the lager energy loss at water entry, the projectile still moves faster in the middle and lower parts of the trajectory. The key point of maintaining a cavity in liquid to survive is to stabilize the surrounding liquid-gas or liquid-vapor interface. In the process of growth or collapse of a gas bubble in liquid, or the initiation stage of supercavitation, surface tension plays a significant role. For the CTAC solution used in our study, the lower surface tension is an important factor, which was measured to be 0.033 N/m for solution as compared with 0.071 N/m for water at room temperature. It was reported by He [13] that the surface tension suppressed the growth of a laser-induced cavitation bubble and enhanced its collapse. The surface tension suppresses the expansion process of a vacuole and accelerates its shrinkage process and always reduces the volume of the cavities. As stated by Shi et al. [14], when the cavity grows, the surface tension keeps the process stable and keeps the cavity orbicular; when the cavity begins to collapse, the surface tension will accelerate the process. This indicates that, at a similar environmental condition, the cavitation bubble can be larger in size and longer in life-time if the surface tension is decreased. Hence, changing the local surface tension could be an effective way to control cavitating process. The phenomena we observed proved that smaller surface tension indeed enlarged the size of the cavity.
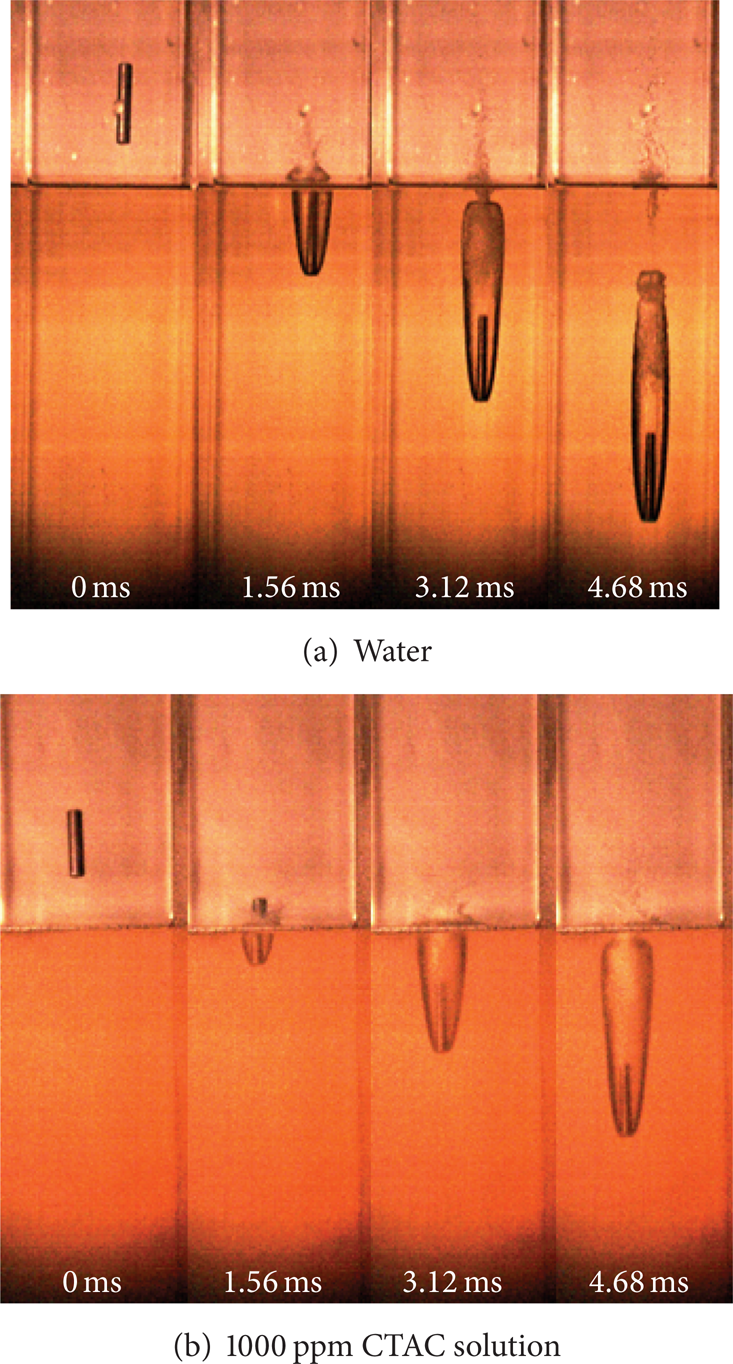
Time-serial pictures indicating the processes of impacting with liquid free surface, forming open cavity and cavity closure after the projectile being projected into water and 1000 ppm CTAC solution at an initial velocity of V0 = 28.4 m/s.
For the three cases of the projectile being projected into 100 ppm, 500 ppm, and 1000 ppm CTAC solutions at the initial velocity smaller than V0 = 21 m/s, the kinetic energy losses when impacting on the liquid surface are all larger than for the water case. This is because the viscosities of the CTAC aqueous solutions are larger than that of water (the viscosity of the CTAC solution increases with the increase of the concentration). At the condition mentioned above, the flow Reynolds number does not reach the valid range of the turbulent drag-reducing effect for this shear flow around the supercavity. The larger viscosity has retardation on the water entry projectile making the energy loss larger in solution. For the cases of the projectile being projected into 100 ppm CTAC solution at initial velocities larger than V0 = 21 m/s, the energy losses become smaller than in water, which is the reflection of the turbulent drag-reducing effect. For these cases, the Reynolds number has reached the valid range of the turbulent drag-reducing effect, which makes the turbulent frictional resistance smaller.
4. Analytical Calculation and Numerical Simulation Procedure
In our study it is observed that the drag-reducing surfactant has great influence on the configuration characteristics of the water entry supercavity: the size is larger and the maintaining time is longer in CTAC solution. Nevertheless, some detailed information cannot be detected: the drag of the projectile in the water entry process is just qualitative; the velocity variation in the trajectory is not measured in the experiment. In order to get more quantitative information mentioned above, analytical calculation and numerical simulation are implemented for the initial stage of water entry.
The water entry cavity induced by projectile is connected with atmosphere at the initial stage of the trajectory. It is assumed that the pressure difference is constant during the water entry process, and the cavitation number varies with the projectile velocity. The cavitation number can be defined as follows:

where Δp is pressure difference, h is water depth (which is negligible here), ρ w is water density, ρ a is air density, C a is airflow pressure drop coefficient C a = 5∼15 [3], V0 is the initial velocity of the projectile, and V p is the instantaneous velocity.
For the drag coefficient of the blunted cavitators, when σ is sufficiently small, the following approximate formula is valid [15]:
where Cd0 is the cavitator drag coefficient when σ = 0. Value Cd0 ≈ 0.82 was established experimentally for the disk cavitator.
Consider a projectile at an initial velocity V0 penetrating into a fluid along a straight trajectory in the + z direction (as schematically shown in Figure 11 for the cavity growth model). For normal penetration of the free surface of a half-plane, the deceleration from the impact velocity can be described by Newton's second law,

where m is the projectile mass, z is the penetration axis, t is the time, A0 is the projected area of the projectile, and C d = C d (V p ) is a velocity-dependent drag coefficient. Except for very low-speed water entry, the effect of g will be negligible, and so it is ignored in the remaining analysis:
We assume that velocity attenuation coefficient k = ρ w A0Cd0/2m. By integrating (7), we get that


Cavity growth model.
The configuration of the water entry supercavity is an important point to predict the trajectory at preliminary stage, which, however, cannot be solved analytically with consideration of the complicated dynamics of the water entry supercavity. So such problem should be solved approximately with some related assumptions. The combined effect of the projectile and the cavity on the fluid motion is approximated by using distributed point sources along the axis of penetration. These sources include a time delay that accounts for the motion of the projectile along its computed trajectory. The source strength at any point along this trajectory is determined by employing energy conservation, where it is assumed that the kinetic energy loss of the projectile equals the total energy (kinetic plus potential) in a fluid section. For water entry of a spherical body, Lee et al. [16] proposed the kinetic energy (dE k ) as follows:

where R is the cavity radius at the penetration depth, N = ln(R a /R) is a dimensionless geometric parameter, and R a represents the maximum disturbance radius at the penetration depth. If we ignore the gravity effect, the formula can also be used to describe the fluid kinetic energy surrounding the cavity for water entry of cylindrical projectile. The potential energy inside the cavity for projectile with blunt head can be expressed as follows:
where
The rate of kinetic energy with respect to depth can then be express as

where m p is the mass of projectile. At the initial stage of water entry, it is assumed here that the drag coefficient is constant. By employing energy conservation law, it can be got that

By solving (12), the relationship between the cavity radius and the penetration distance can be got:

In addition to presenting analytical results for initial stage of water entry, the experimental results for water entry supercavitation forming process are also realized through numerical simulations. The commercially available CFD (computational fluid dynamics) FLUENT code is used in this study to simulate the complex phenomena appearing in the initial stage of water entry. The governing equations for two-phase one-fluid model are the following continuity and momentum equations for the mixture, respectively:
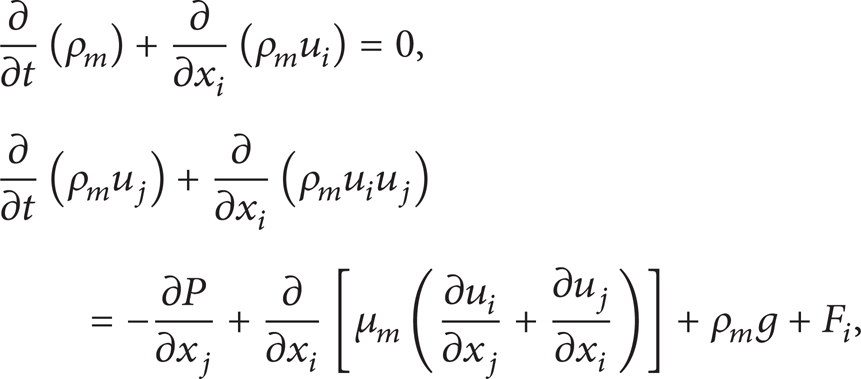
where u is velocity vector, P is pressure, ρ m and μ m are density and dynamic viscosity of the simulated mixture, and F i is body force.
The standard k-ε model with standard wall functions was adopted to provide turbulence closure:

where k and ε are the turbulent kinetic energy and dissipation rate, respectively; the model parameters are chosen as follows: Cμ = 0.09, Cε1 = 1.44, Cε2 = 1.92, σ k = 1.0, and σε = 1.3.
Since the simulated water entry projectile (a cylindrical bullet) is axially symmetric, the simulation model was then simplified to be 2-dimensional, as shown in Figure 12. The simulated cylindrical projectile has exactly the same geometry and dimensions as that used in the experiments: 7 mm in diameter and 30 mm in length. The total computational domain was 300 mm wide (the cylinder was in the middle) and 800 mm long. Water entry supercavitation in water and turbulent drag-reducing solution, respectively, were numerically simulated based on unsteady Reynolds averaged Navier-Stokes scheme, together with application of VOF (volume of fluid) multiphase flow model. The VOF model is used to simulate this two-phase flow, which treats the flow as two phases with an averaged mixture density continuously varying between liquid and vapor extremes. Meanwhile, the dynamic mesh method was used to simulate the water entry phenomena. The User Defined Functions embedded in the FLUENT platform were used to control the movement of the projectile. The resistance of the projectile was simulated and the mesh was updated after every time step. The velocity varies depending on the force acting on the projectile, which is also resimulated after every time step. A segregated solver with SIMPLE scheme as the velocity-pressure coupling algorithm was selected. The pressure field was discretized using PRESTO scheme. The second order upwind scheme was used for the discretization of the velocity field. Georeconstruct method was used for the volume fraction. Inherently, the values of all the parameters were stored and calculated with double precision. The numerical simulations were for transient flows. The time step was set to be 0.00001 second, which gives 20 time steps per cycle.

Physical model, computational region, and grid system.
In all the simulations presented below, the working fluid was at 298 K, with liquid and air densities of 998.2 and 1.225 kg/m3, respectively. An exit pressure was specified at the top (outlet) boundary (shown in Figure 12, left part). Both side boundaries were set to be solid wall (no slip for velocity and no penetration). A structured grid system was employed to discretize the region around the projectile with boundary layer clustering around the cylindrical body (shown in Figure 12, right part). The unstructured mesh was employed for the other region considering the dynamic mesh technology.
In order to have a deep insight into the mechanism of water entry supercavitating flow influenced by turbulent drag-reducing activities, the supercavitations in drag-reducing solutions were numerically simulated as well. The Cross viscosity model [17] was utilized herein to characterize the viscoelastic turbulent drag-reducing solution. The viscoelastic drag-reducing solution was characterized through modeling the dynamic viscosity by the Cross viscosity equation:

where μ0 is zero shear viscosity; λ is relaxation time;
Numerical simulations were performed for the water and surfactant solution (μ0 = 0.01 Pa·s, λ = 1 s, m = 0.3, and σ s = 0.036 N/m) flow cases at the initial velocity V0 = 28.4 m/s, respectively.
5. Analytical and Numerical Results and Discussion
In the following presentations, the experimental data used for comparisons with analytical calculation and numerical simulation are all for the case of 1000 ppm CTAC solution.
Figure 13 shows the numerical simulation results for the dimensions of supercavity as compared with the analytical calculations. Both of the two lines represent radii: the positive value and negative value mean that they are symmetrical about the axial plane. Excellent agreements have been obtained, verifying the currently conducted numerical simulation procedures. Furthermore, the supercavity shapes between water and solution are almost the same, which means that, at early stage of water entry cavity, the drag-reducing additives have negligible influence on the cavity shape (within the first 1 ms interval, the cavity shape could not be measured in the current experiments). Comparing Figures 13 and 7, it can be conjectured that the size difference between the cavities in water and solutions might come from the stage after the surface closure. Smaller surface tension of drag-reducing solution makes more air rushing into the cavity, which leads to the larger size of the cavity.

Comparison of the supercavity analytical model with the numerical simulation results.
Figure 14 shows a comparison of the supercavity forming process at the initial stage of water entry between numerical simulation and experiments for the 1000 ppm CTAC solution case. As shown in Figure 14(b) for the “open-cavity phase”: the flow separates from the projectile nose with the generation of the cavity; air rushes in from above the liquid surface to fill the cavity; during this phase the projectile is cavity running; that is, it is generating a cavity as it travels, but the cavity is open to the atmosphere at its upper end (at the liquid surface). In Figure 14(c), the experimental data shows that the splash is forming a dome and closing over the entry point of the projectile to seal the cavity from the air above. As shown in Figure 14(d), “surface closure” occurs and the cavity is then pushed down from the liquid surface. From this stage, the cavity has closed above the liquid surface and envelops the projectile, forming the supercavity. In the process of water entry, the shape of the cavity in solution is consistent well with the experimental observations. It again demonstrates that the presently conducted numerical simulation procedure is suitable for simulating the supercavitating projectile in drag-reducing solutions.

Comparisons of cavity configurations at water entry between numerical simulation and experiments for the 1000 ppm CTAC solution case (“E” and “N” represent the experiments and numerical simulations, resp.).
The numerical simulation results for the variation of projectile velocity as compared with the analytical predictions are shown in Figure 15. It can be seen that, for water entry supercavitation at initial velocity V0 = 28.4 m/s, the drag obtained from the numerical simulation is comparable to that predicted using the analytical model, with the maximum discrepancy of 25%. In consideration of the impact process, because the projectile is launched at some distance above the water surface, when the projectile impacts the water surface, it will lose more energy than the analytical formulation. From the numerical simulation results, we can see that the velocity in solution decays slower than in water, which means that, at the same instant, the projectile in solution flies faster than in water.

Comparison between analytical calculation and numerical simulation for velocity attenuation of the projectile with supercavitation.
The numerical simulation results compared to the predicted penetration distance based on the analytical formulation and the experiment data are shown in Figure 16. It is seen that the projectile in solution moves in longer distance than in water at the same instant. Actually, the projectile cannot move as far as the analytical calculation due to the loss of projectile kinetic energy at the water entry process. From the results mentioned above, it is clear that the numerical simulation approach developed in the present study allows one to investigate the characteristics of water entry induced supercavitation influenced by turbulent drag-reducing additives.

Comparison of experiments, analytical and numerical simulation for penetration distance.
Figure 17 plots drag coefficients versus time for both water and drag-reducing solution cases. The drag coefficient C d is defined as follows:

where F is the overall drag force.
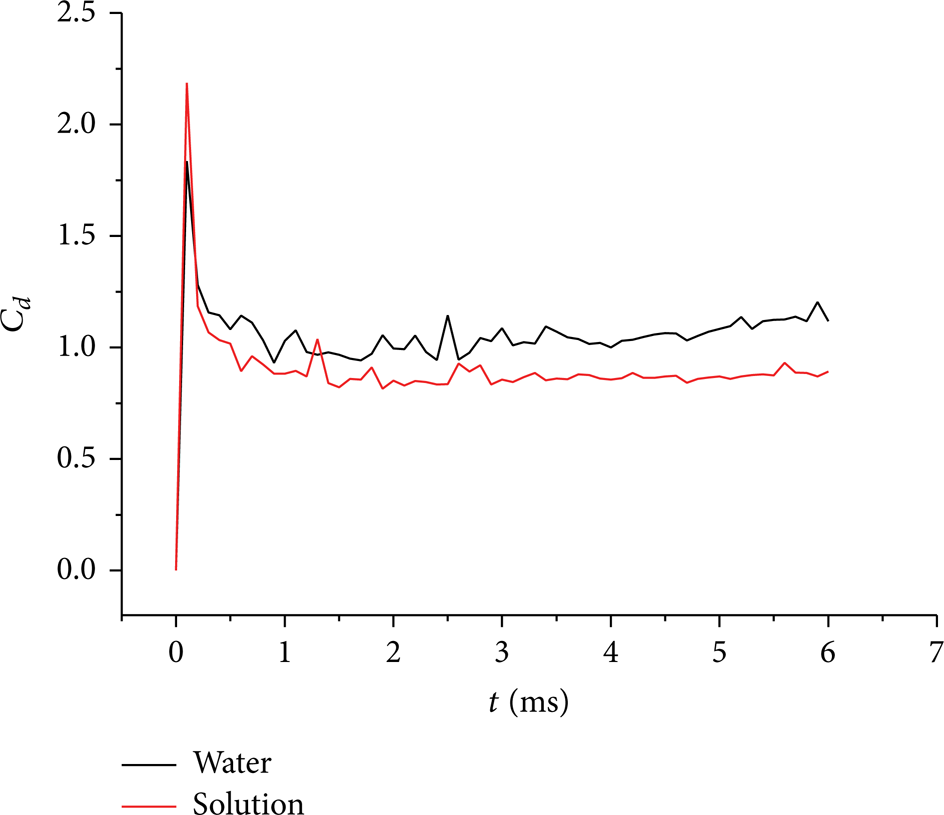
Drag coefficients for projectile in water and in drag-reducing solution varying with time by numerical simulation.
It can be seen that the drag coefficients rise sharply when the projectile impacts the liquid surface and then decrease, which can quantitatively explain why the projectile loses much kinetic energy and the velocity decreases much when impacting the liquid surface. The drag coefficient is obviously smaller in drag-reducing solutions than that in water. From these results, it can be conjectured that, adding small amount of drag-reducing additives, projectile can move faster in the drag-reducing solution than in water provided the driving power is the same. It is expected that the actual drag coefficient would be greater than that predicted for a disk cavitator because there are drag forces on the projectile body. The occurrence of tail-slap is probably the main contributor.
As illustrated above, we have numerically realized that the turbulent drag-reducing additives do have evident and positive effects on the formation of water entry supercavitation, resulting in further decrease of flow resistance of the projectile, as happened in the experiment.
6. Conclusions
The effect of drag-reducing surfactant additives (CTAC) on water entry supercavitation was examined by experimental and numerical simulation methods. The overall appearance of supercavity was altered by the CTAC additives, showing a smooth and regular characteristic with enhanced cavity size and reduced drag coefficient. The smaller surface tension and shear-thinning effect of the drag-reducing solution are believed to be responsible for these results. The following conclusions are drawn from this study.
The size of the supercavity in drag-reducing solution is larger than that in water, and the penetration distance in solution is longer than in water.
The open cavity stage in solution is longer than that in water, resulting in the fact that more air rushes into the cavity, and the configuration of the cavity becomes larger in solution.
The maintaining time of the supercavity in turbulent drag-reducing solution is longer than that in water.
In the initial stage of water entry, the configuration is almost the same in solution and in water. The effect of the drag-reducing solution mainly acts after the surface closure.
The projectile in the drag-reducing solution receives smaller resistance than in water, and the projectile moves faster in solution than in water.
Conflict of Interests
The authors declare that there is no conflict of interests regarding the publication of this paper.
Footnotes
Acknowledgments
This work is supported by National Natural Science Foundation of China (51276046), Foundation for Innovative Research Groups of the National Natural Science Foundation of China (51121004), and Specialized Research Fund for the Doctoral Program of Higher Education of China (no. 20112302110020).