
Abstract
By considering turning vehicles of a platoon that travels on arterial link, a new procedure for calibrating dispersion parameter α of Robertson's model is proposed. Upstream edge of channelized section is served as the boundary and the link between two adjacent intersections is divided into two sections, which are road section and channelized section. Typical investigation site is selected in Changchun city and data are collected to study the relationship between α and internal frictions, such as traffic volume and turning proportion. Double Gaussian function and logistic function are used to fit the curves among optimum values of α and internal frictions in the two sections, respectively, which allow the determination of α that varies as the volumes and turning proportions change. The study results are of great importance for arterial progression because Robertson's model can depict platoon movements more accurately using the calibrated values of α.
1. Introduction
It has been known that platoons, formed at signalized intersections, do not remain intact or compact as they travel along an arterial road link to the next intersection. Platoons may disperse along the road either quickly or slowly. This dispersion of vehicle platoons is caused by the diverse speeds of vehicles in the platoon [1]. Analyzing the dispersion of a traffic platoon is of considerable significance for traffic forecasting, simulation and signal timing.
Platoon dispersion models attempt to simulate the dispersion of traffic flow by estimating vehicle arrivals at downstream locations based on the upstream vehicle departure profile and the desired traffic-stream speed. The most widely used platoon dispersion model is Robertson's model [2]. It has become a benchmark platoon dispersion model and has been implemented in some famous traffic control systems, such as TRANSYT [2] and SCOOT [3]. However, the model's quality is significantly affected by two parameters, which are platoon dispersion factor α and travel time factor β. Some researchers have proved that unsuitable setting of the two parameters would affect progression quality and cause additional vehicle delays and stops [4]. Thus, the two parameters should be carefully calibrated based on the field survey. Because of the importance of parameters calibration, many related studies have been conducted on this subject since 1960s, which can be roughly categorized into two groups. In the first group, the parameters are constant, and, in the second group, the parameters depend on the traffic volume.
Studies in the first group attempted to calibrate α and β directly based on field survey. The calibration procedure is, based on a given upstream flow profile, selecting the parameters that minimize the sum of squared error between field observed and estimated downstream flow profiles. Most of current studies should be classified into this group. The empirical studies performed by the Transport and Road Research Laboratory in the United Kingdom suggested some default values for platoon dispersion modeling. The work performed by Tarnoff and Parsonson [5] and the University of Florida [6] suggested a set of default values for the platoon dispersion parameters for the North American version of TRANSYT, referred to as TRANSYT-7F. Although many research findings [7–10] have indicated that the platoon dispersion parameters should be site specific and a function of the road grades, curvature, parking, opposing flow interference, traffic volume, and other sources of impedance, no methodology that can quantitatively calibrate the platoon dispersion parameters exists.
Some researchers pointed out that the parameters of previous models can not reflect the dynamic changes of traffic conditions, thus they attempted to establish dynamic functions for such reflection, which gives the studies in the second group. Manar and Baass [4] proposed a parabolic model for the mapping between platoon dispersion factor and volume. As traffic volumes and densities increase, the platoon dispersion approaches a maximum value, which can be attained at half of the capacity. Moreover, as traffic volumes and densities further increase, the dispersion decreases and reaches a minimum value where the volumes equal the maximal capacity. Yu and Van [11] and Yu [1] not only demonstrated that the travel time factor β was dependent on the platoon dispersion factor α, but also developed three equations for calibrating α, β, and smoothing factor F directly from average link travel time and its standard deviation. Their achievements are more suitable for applications at networks with advanced traffic management system, wherein the required link travel time data could be obtained on a real-time basis. Rakha and Farzaneh [12] showed that because Yu and Van [11] and Yu [1] considered travel times in units of seconds in the derivation of their calibration procedure, the procedure was only valid when a 1 s (second) time slot was considered. Consequently, the cyclic flow profile prediction error increased as the duration of the modeling time step increased. Then, they provided three enhanced formulations to overcome the shortcomings. Farzaneh and Rakha [13] verified the importance of calibrating Robertson's model and showed that the value of β was critical in estimating appropriate signal timing plans. Furthermore, they also demonstrated that the value of α did not significantly affect the estimated downstream cyclic flow profile. Because TRANSYT software only allows the user to calibrate α rather than β, they proposed a formulation using the basic properties of the recursive relationship to enable the user to control β indirectly by altering the link average travel time.
Wang et al. [14] intended to calibrate α and β simultaneously and developed a new platoon dispersion model based on nontransformation normal distribution to improve the prediction precision of Roberson's model. Bonneson et al. [15] developed a procedure for predicting the arrival flow profile for an intersection approach. The relationship between platoon decay (due to midsegment driveway access and egress) and platoon dispersion was studied. The research indicated that platoon decay tends to have a more significant impact on the arrival flow profile than platoon dispersion. Shen et al. [16] assumed the vehicle speed followed a truncated normal distribution ranging from a minimum speed to a free flow speed. The dispersion characteristics of the queue under the impact of signal control are analyzed. Then, they developed a platoon dispersion model. Day and Bullock [17] developed a methodology for automatically measuring platoon characteristics on links between signalized intersections with high-resolution signal event data. The methodology estimated the parameters of the Robertson's dispersion model that characterize platoon travel time and platoon distribution along a link. The results suggested that platoon dispersion was more sensitive to driver behavior characteristics related to roadside environment than to distance traveled along a street. Bie et al. [18] found that microscopic vehicle behaviors, such as car following, overtaking, and lane change, performed differently on the links with different number of lanes. They addressed the impact of number of lanes on the platoon dispersion of traffic flows in low-friction conditions. The platoon dispersion factor of Robertson's model was calibrated using data on road segment with different numbers of lanes.
As described above, numerous studies have already been conducted on the subject of dispersion parameters calibration and many valuable results achieved [19–27]. To the authors’ knowledge, no researcher has studied the impact of turning vehicles on Robertson's model. In reality, when a platoon moves toward downstream intersection, some vehicles may fall out of the platoon. This would result in different platoon dispersion behavior. The purpose of this paper is to study the relationship between turning vehicles and dispersion parameters and to develop a new procedure for calibrating Robertson's model considering turning vehicles. This study is of great significance for arterial progression because platoon arrival profiles may be predicted more precisely using the calibrated model. Moreover, the impact of turning vehicles on arterial progression benefits can be evaluated, and the threshold value of vehicle turning proportion when grouping two adjacent intersections into one traffic control subarea can be obtained, which is useful for subarea partition.
2. Methodology
2.1. Problem Description
As aforementioned, Robertson's dispersion model cannot precisely reflect the dispersion behavior in some special circumstances, but it is still the most widely used model in the world since there is no other model to replace it. Thus, in this study, Robertson's model is still used to predict downstream profiles, but its parameters are recalibrated while considering turning vehicles in the platoon.
The Robertson's dispersion model takes the following mathematical format:

where q′(t) = arrival flow at the downstream intersection at time interval t, q(t) = departure flow at the upstream intersection at time interval t, T = lagtime = β·t a , α = dimensionless platoon dispersion factor, β = dimensionless travel time factor, F = dimensionless smoothing factor, and t a = average link travel time.
In reality, two basic requirements should be satisfied when Robertson's model is applied to predict downstream platoon profiles: (i) traffic flow conservation: no vehicle joins in or leaves the platoon; (ii) constant velocity: each vehicle in the platoon keeps constant velocity when traveling along the link. All of the previous studies conducted to calibrate dispersion parameters abided these two principles because experimental data were collected at road sections of arterial links, and nearly no vehicles joined in or fell out.
However, when platoon arrives at the start point of channelized area, vehicles that make up the platoon would turn to different directions, such as left turn, right turn, and through. As illustrated in Figure 1, at time t, leading vehicles of the platoon arrive at the channelized area and at time t + 1 two vehicles switch to left-turn lane. To coordinate the platoon that arrives at through phase, Robertson's dispersion model is usually employed to predict the arrival profile. However, because of the turning vehicles, the traffic flow conservation is undermined. Moreover, adjacent vehicles behind the turning vehicles may speed up because there is more road space around them; thus, the principle of constant velocity is also undermined. Therefore, Robertson's model is not suitable to predict downstream arrival profile directly when there are turning vehicles in the platoon because large prediction error may be produced, especially when the proportion of turning vehicles is high.

Platoon movement in two successive time points.
2.2. Calibration Procedure
Two methods can be observed from the existing studies on calibrating the parameters of Robertson's model. One is calibrating α and β simultaneously and the other is only calibrating α while maintaining β at a constant value of 0.8. Several researchers have reported difficulties in calibrating α and β simultaneously [22, 23], and, moreover, the software package TRANSYT only allows the user to calibrate α. Accordingly, in this study, we adopt the second method to calibrate Robertson's model. During calibration, α is increased from 0 to 1 with an increment of 0.01, while β is maintained constant as 0.8.
As shown in Figure 2(a), to satisfy the two basic requirements of Robertson's model, the link between two adjacent intersections is divided into two sections. The upstream edge of channelized section is served as the boundary of the two sections. Besides, the following assumptions are applied.
Turning vehicles fall out of the platoon immediately when they arrive at the upstream edge of Section 2, and the time and travel distance for their turning are neglected.
In Section 2, the acceleration time of residual vehicles in the platoon is neglected.
In Section 2, the turning proportions of arrival flow at time intervals are equal to the same value.

Division of the link and calibration process of Robertson's dispersion model.
Due to the above assumptions, the two basic principles for using Robertson's model can be satisfied in both Sections 1 and 2. The calibration of α is to find the optimum value to minimize the sum of squared errors between field-observed and predicted flow profiles. The calibration process is divided into two steps due to the difference of traffic behaviors in the two sections. For example, average speed of platoon in Section 2 would be larger than that in Section 1 because of two reasons. First, some vehicles turn out of the platoon and there are larger headways for residual vehicles. Second, the residual vehicles usually arrive at the intersection when the traffic light displays green. Thus, the drivers would like to speed up before the ending of green. The process is shown in Figure 2(b) and described as follows.
The first step, calibrating α in Section 1 and the calibrated value of α, is indexed by α1. In this section, no vehicle falls out the platoon and all vehicles keep constant velocities. The factor that may affect dispersion level is traffic volume. Let
The second step, calibrating α in Section 2 and the calibrated value of α, is indexed by α2. In this section, some vehicles may fall out the platoon and affecting factors on dispersion level include traffic volume and vehicle turning proportion.
3. Experimentation
To verify the proposed methodology, field surveys were conducted in Changchun city, the capital of Jilin Province, China. Most of arterial streets in Changchun were well designed and channelized; thus, the study sites were selected from arterial streets.
3.1. Study Sites
It is difficult to select the investigation site because in this study the calibration of α needs high-quality data. The following requests are placed for the investigation.
In road section, the platoon departure from upstream stop line should not be interrupted by external factors such as bus stops and nonmotorized vehicles.
There are vehicles that in the platoon turn left or right when arriving at Section 2.
The platoon can pass the downstream stop line without a stop and traffic signals and queue vehicles resulted by red light have no effect on the platoon movement. Only in this way can we count the number of turning vehicles in the platoon and capture the variation of vehicle velocities in channelized area.
The proportion of large vehicles in the platoon should be small enough or can be neglected.
The third item is the most important request for the selection of investigation site, but it is also the most difficult request to be satisfied. This is because the platoon is probably affected by downstream signal and queue vehicles; the platoon has to speed down and join the previous queue. We only found one site that satisfies the above four requests in Changchun. The sketch of the site is shown in Figure 3. Two minor roads are intersected with Renmin Street, one of the most important arteries in Changchun. On Renmin Street, large vehicles and cars are separated to different lanes on the links by greenbelts. Taxies and large vehicles (including buses) run on the outside lanes; thus, the movements of platoons on the inside lanes are not interfered and could keep continuous state.
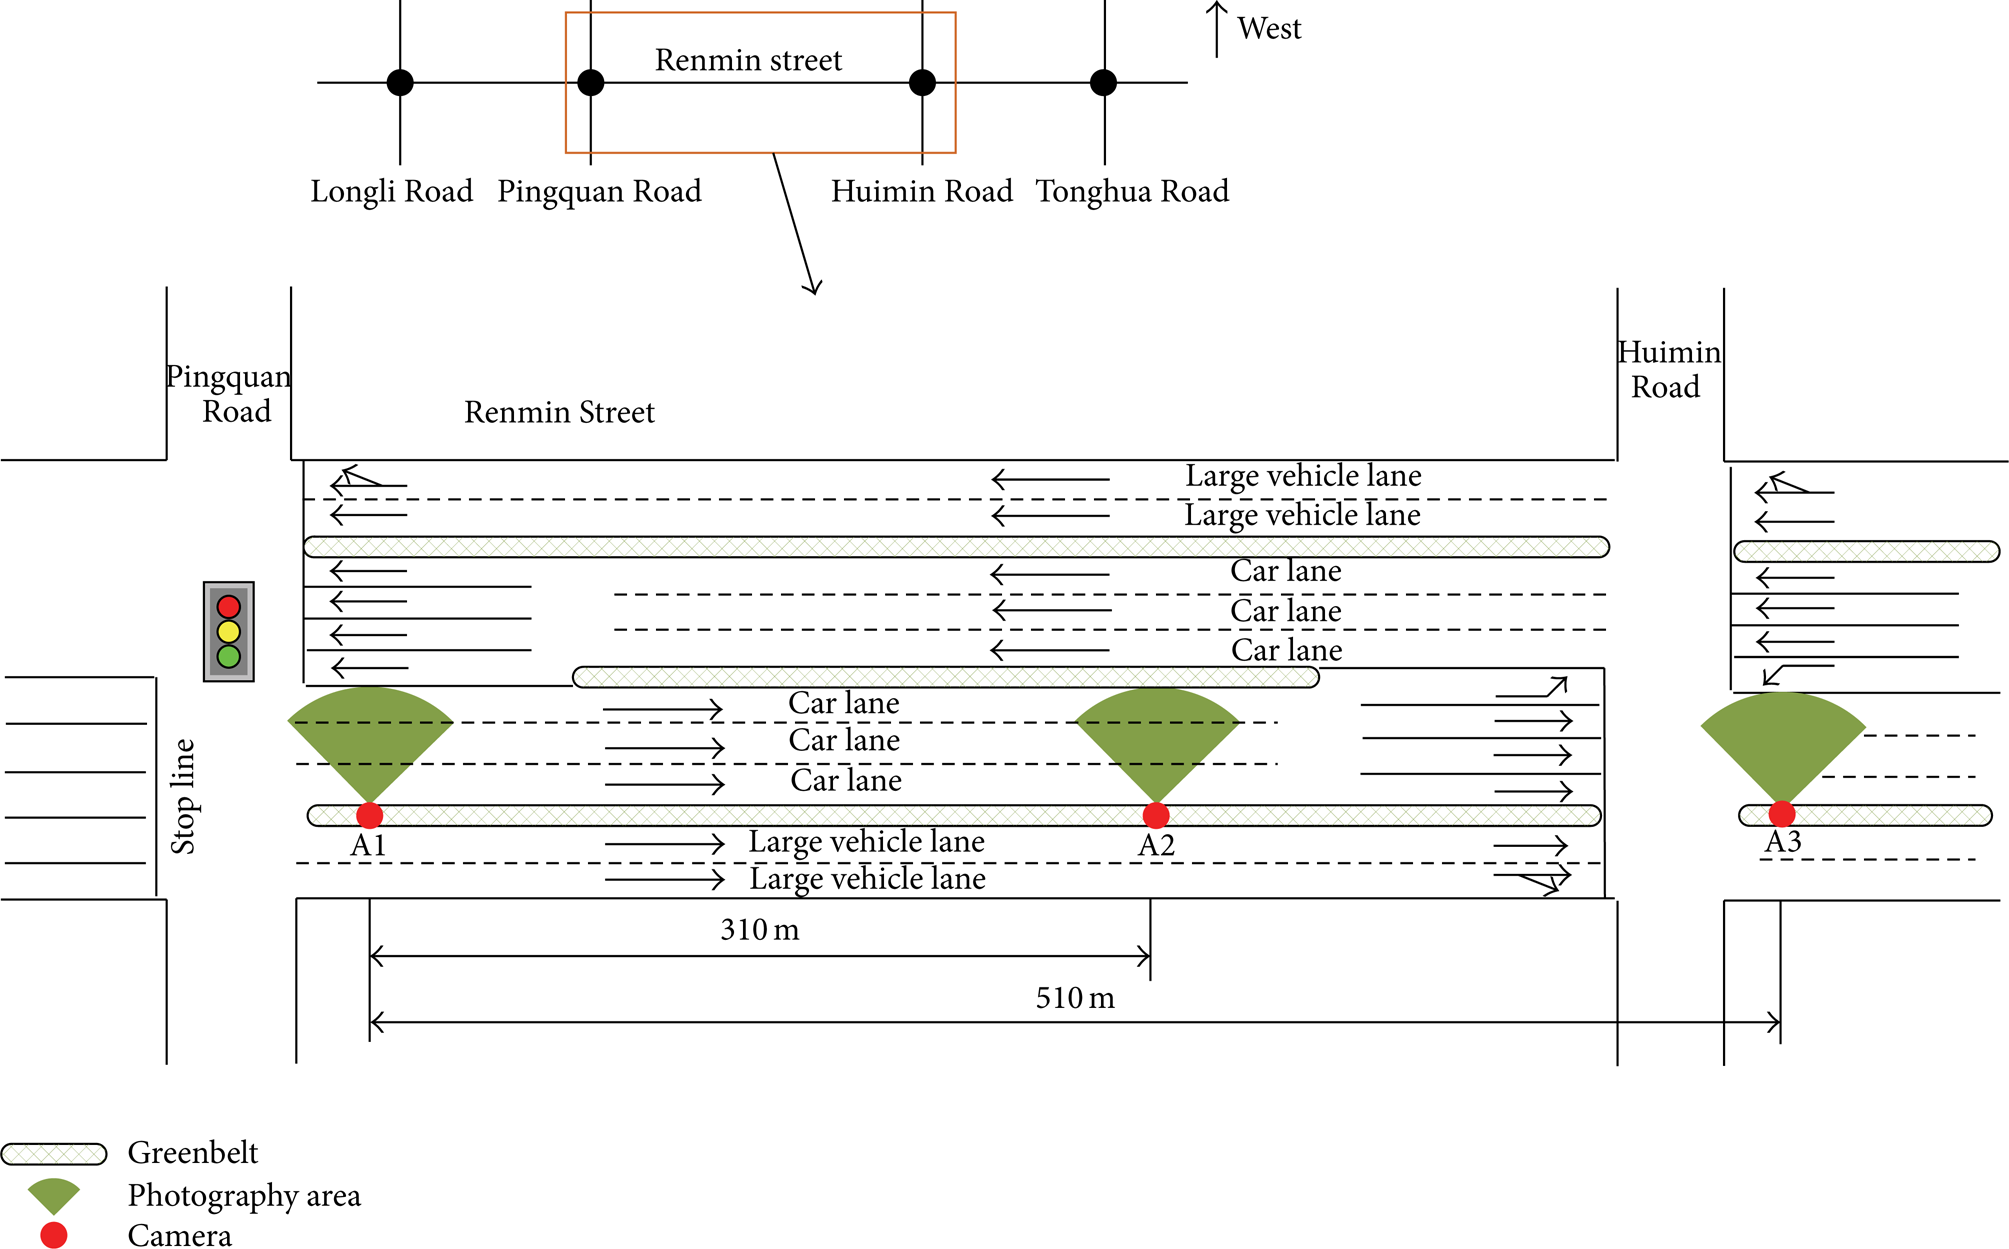
Layout of field survey site.
The distances between adjacent intersections are short; thus, synchronization coordination control is implemented and sometimes the platoon can pass several intersections without a stop. All intersections have two signal phases except the Huimin Road and Renmin Street intersection, which has three signal phases (North-South through movement, North-South left turn, and East-West directions). Because some vehicles in the platoon that departure from the stop line of Pingquan Road and Renmin Street intersection would turn left when they arrive at the channelized area of downstream intersection, the link in the direction of south to north between the two adjacent intersections is selected as investigation site in this study.
Three investigators were assigned to 3 control points (A1, A2, and A3) to record the passing times of vehicles on inside lanes using digital cameras. The distances among the 3 points are 310 m and 510 m. Besides, the investigator at control point A3 also counted and recorded the number of vehicles that turned left in each platoon.
It was still difficult to obtain the data that met the four requirements in this site because in rare circumstances the impact of downstream queue and signals can be neglected. Therefore, to collect sufficient amount of data, surveys were carried on 6 consecutive workdays and on each workday the surveys were conducted twice to cover conditions with different traffic volumes and platoon sizes. The two survey periods lasted from 6:00 AM to 11:00 AM and from 15:00 PM to 19:00 PM, respectively. Videos were treated in laboratory using computers after investigation. The vehicle passing times were extracted with a precision of 0.04 s. The platoon data that did not meet the requirements were deleted. Total 1452 groups of data were collected and finally only 207 groups of data were valid. The valid platoon size ranged from 17 pcu to 89 pcu. The proportion of number of vehicles that turned left to platoon size ranged from 0.06 to 0.51.
3.2. Data Analysis
According to the designed calibration procedure, parameter α is calibrated two times. The first calibration of α can make the prediction of arrival flow at Section 2 more accurate.
3.2.1. Calibration of α in Section 1
Vehicle passing times were aggregated into 4 s intervals for the calibration. For each platoon, the value of α that produces minimum sum of squared errors was obtained in MATLAB environment. Then, the t test at 95% confidence level was conducted to discriminate whether there was significant difference between field-observed profile and the estimated flow profile produced by optimum value of α. The calibrated value of α is indexed as α1.
The authors have developed the calibration function for α1 in road section in [18]. Thus, the calibration procedure is not displayed in this paper and the function is shown as follows:


where v0 is the initial platoon, pcu; s is the capacity in the direction of traffic movements at road section, pcu/s; Tμ is the interval between the time the leading vehicle of the platoon passing the reference line and the time the last vehicle of the platoon passing the reference line, s. N is the number of lanes at road section. S ai is the saturation flow rate per through approach at stop line, pcu/s; g is the green split of downstream through phases in the direction of traffic movements, s.
In (2), double Gaussian function is used to describe the relationship between v0/s and α1 and their relation diagram is shown in Figure 4. From the figure, we can find that the optimum values of α1 are different from the values provided in the TRANSYT manual. Moreover, as the value of v0/s increases, the values of α1 increase up to a maximum. As v0/s increases further, α1 decreases and reaches a minimum.
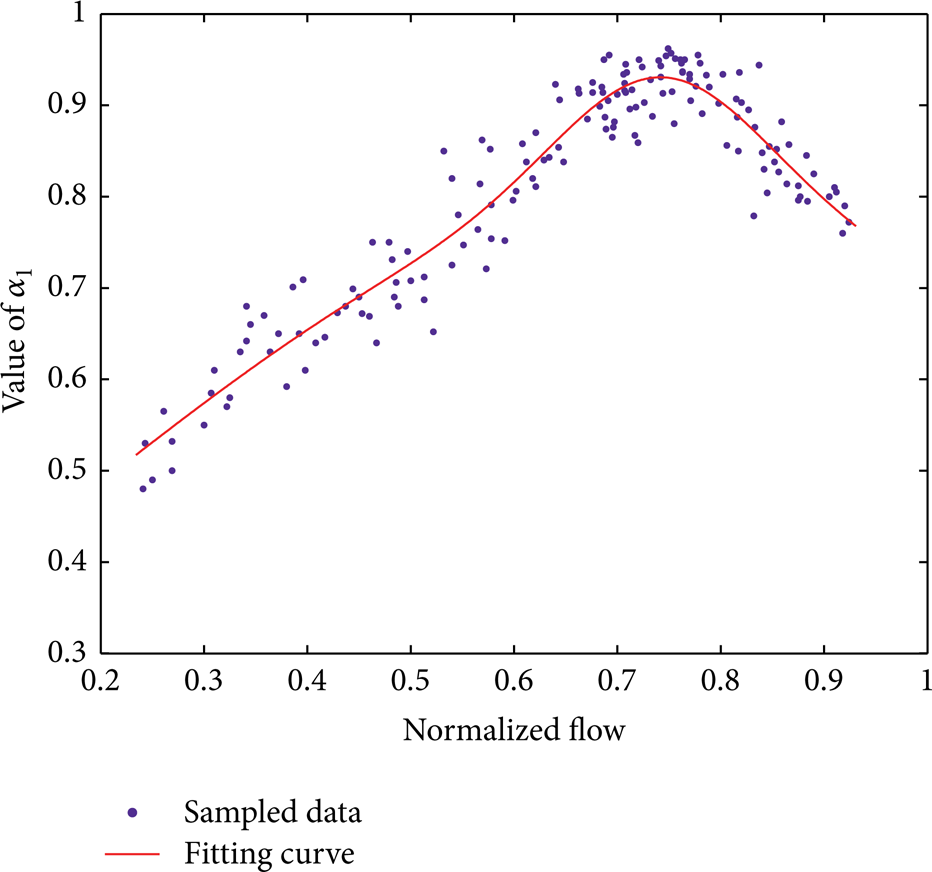
Relation curve between v0/s and α1.
3.2.2. Calibration of α in Section 2
With the value of α1 in Section 1, the arrival flow q1 p (t) at the downstream edge of Section 1 can be predicted. Then, the arrival flow q2 p (t) at the upstream edge of Section 2 can also be predicted by multiplying q1 p (t) and (1 − p t ) together. Here, q2 p (t) is used to predict arrival flow at the downstream boundary of Section 2, other than q2(t), the field measured arrival flow. It is because, in practical circumstances, q2(t) can not be detected by vehicle detectors that are usually located in channelized section or road section. Moreover, q2 p (t) can be easily estimated based on the third assumption in Section 2 and therefore it is used as the arrival flow at Section 2.
The value of α2 that produces minimum sum of squared errors for each platoon in Section 2 was obtained in MATLAB environment. Figure 5 displays the relation curve between α2 and normalized flow in section flow (v2/s).

Relationship between v2/s and platoon dispersion factor α2.
From Figure 5, we can find that the scatter diagram has roughly “S” shape and the diagram can be divided into 3 segments. As v2/s increases from the minimal value 0.13 to 0.35, the value of α2 increases slowly. However, as v2/s increases from 0.35 to 0.70, α2 increases much quicker than before. As v2/s increases further, α2 increases slowly again. This shape is similar to the shape of logistic model and therefore the model is used to fit the scatter diagram in Figure 5. The formula of logistic model is shown as follows:

where k, a, and b are parameters.
The value of y(x) in (5) ranges from 0 to k. However, the minimal value of α2 in Figure 5 is 0.44; thus, (5) is modified as follows to improve the fitting precision:

The fitting curve is shown in Figure 5 and the fitting parameters are shown as follows: k = 0.50; a = 94.87; b = 9.36. The fitting function is shown as follows:

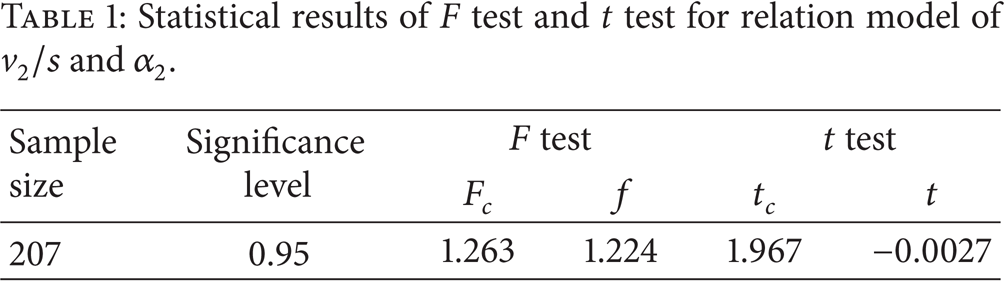
Root mean squared error (RMSE) and coefficient of determination (R2) have been widely used in transportation data analysis to evaluate the performance of a calibrated function. In this study, R2 of the fitting curve is 0.88 and RMSE is 0.046, which indicate that the curve fitting provides acceptable precision. F test and t test are carried out to identify whether the sampled data and fitting curves differ significantly under the significance level of 0.95. The statistical results are shown in Table 1. From Table 1, we can find that the results of the two tests are all acceptable.
Statistical results of F test and t test for relation model of v2/s and α2.
Comparing Figures 4 and 5, we can find that the most significant difference between the two fitting curves is the changing tendency of their ending segments. In Figure 4, after having reached a maximum, α1 would decrease and reach a minimum as the increase of v0/s. However, in Figure 5, there is a positive relationship between v2/s and α2, though the value of α2 increases very slowly at the ending segment. The difference is mainly attributed to the different platoon movement behaviors in the two sections under heavy traffic load circumstances. As analyzed above, when traffic load is heavy in Section 1, speeds of vehicles would fluctuate remarkably because some vehicles can not reach their desired speed due to strong interferences of adjacent vehicles. Nevertheless, lane change behavior is allowed in road section; thus, some vehicles may speed up or speed down frequently for overtaking, which leads to high dispersion level and the decrease of α1. However, in Section 2 lane change behavior is not allowed and vehicles have to follow their anterior vehicles when they travel toward the stop line. Thus, with the increase of the traffic load, the platoon would become tighter, consequently leading to the decrease of dispersion level and increase of α2.
Equation (7) is useful for calibrating α2. However, when applied to TRANSYT or SCOOT, traffic engineers may not concern the relationship between v2/s and α2, but the relationship between v0/s and α2. This is because vehicle detectors of the two systems are placed at the entrance of each link and v0 other than v2 can be detected directly. Since v2 can be obtained by v0 and p t ; thus, it is easy to establish the relationship model among v0, p t , and α2. As shown in the following equation, v2/s is replaced by the production of v0/s and p t :

According to the investigation data, the value of p t ranges from 0.06 to 0.51; thus, (8) is applicable only when p t belongs to the interval (0, 0.51].
4. Conclusions
This study proposed a new procedure for calibrating dispersion parameter α of Robertson's model considering turning vehicles in the platoon. A typical investigation site was selected in Changchun city and data were collected to study the relationship between α and internal frictions, such as traffic volume and turning proportion. Finally, two relationship models between the variables were established for calibrating α in road section and channelized section, respectively. The study results are of great importance for TRANSYT, arterial progression, and subarea partition because Robertson's model can depict platoon movements more precisely using the calibrated values of α.
Due to the difficulty in obtaining ideal data of platoon movements, only one site that satisfied the requirements was found in Changchun for investigation. Although traffic conditions of the selected site were pretty typical, the conclusion may still not be universal to other sites due to the complexity and diversity of the real situation. Future research will be focused on selecting more investigation sites and considering the influences of other traffic management tools, for instance, congestion pricing schemes (see [28, 29]). In addition, collecting sufficient data in other cities for quantitatively assessing the generality of the findings is also necessary.
Conflict of Interests
The authors declare that there is no conflict of interests regarding the publication of this paper.
Footnotes
Acknowledgments
This study is supported by the National Natural Science Foundation of China (no. 61304198), the Fundamental Research Funds for the Central Universities (no. HIT.NSRIF.2014079), and China Postdoctoral Science Foundation funded project (no. 2013M530159).