
Abstract
Recently, many researches on big-data sensing and analysis have been actively promoted. The big data, which is generated by the digital and networked environment, is referred to to form not only numerical data, but also large-scale data for storing image data and character. Usually, many data measured through sensors are very large in scale in various vibration measurements. Measurement methods for vibration analysis currently consist of a general sensing scheme using cabling to obtain vibration data. The system is difficult to use efficiently in a location where equipment installation is not easy. We proposed a novel vibration measurement system that includes a main hardware module and a wireless data transceiver module. The system is easy to use and field data are transmitted to a remote location using Bluetooth communication and the Android platform. Nonexpert personnel can obtain field vibration data for transport, even over long distances. Through experiments in field test, we verify that the stable remote sensing range reaches up to 150 m in real-time communication without any data loss.
1. Introduction
Vibration is a natural phenomenon characterized by periodic oscillation with a magnitude of force and a frequency. If the frequency of vibration of an object and the natural vibrational frequency of a specific object are the same, the phenomenon known as resonance occurs, which can cause serious problems leading to destruction of a system or difficulty in precise control of a system. For example, in 1973 the largest suspension bridge in the United States, over the Tacoma Strait in the state of Washington, collapsed due to vibrational resonance in a high wind. In Korea, buildings are known to shake violently due to resonance when many people exercise together in a fitness center. Problems related to resonance have become increasingly important due to development of sophisticated modern machines used in industry and use of high-precision equipment in research, development, and production processes. Safety inspections for potential resonance problems have become essential.
Industrial production and development of core technologies and products have evolved using precision equipment. Many modern buildings are complicated structures encompassing different materials and mechanical systems, all with different natural resonant frequencies. Operation of the many high precision mechanical systems in modern buildings, laboratories, and factories requires high power. High precision vibration measuring equipment is used to evaluate the potential for vibrational resonance in these environments and vibration control for the normal operation of many systems is recognized as an important safety concern. Monitoring and suppression of vibration using vibration monitoring systems in both large and small projects and in research, construction, and production environments is essential.
Vibration measurement generally uses time-based vibration displacement (m, cm, mm, um). The amount of displacement velocity per unit time, speed change, and the amount of change per unit time are all important vibration measurements.
Displacement and velocity sensors and accelerometers are available for measuring the amount, speed, and strength of vibration in a system. A dynamic signal analyzer (DSA) [1] is used for collection and analysis of vibrational data in conjunction with a digital signal processor (DSP). A Fourier transform is used to convert frequency data into time domain data with inclusion of autospectrum and power spectrum data. Cross-spectrum data are necessary for conversion of data using Fourier transformation.
Monitoring is important for measurement of vibration. Tang et al. [2] proposed an application for monitoring and control of machine operations using vibration sensing in which a vibration analyzer continuously monitors and compares the actual vibration pattern against a known vibration signature, based on a fuzzy fusion technique. Similar systems have been proposed [3–5]. The frequency of vibration of monitoring data that is necessary in order to understand the transformation of a vibration will always be located in the front of an analyzer (Figure 1) as the analytical equipment is typically expensive and difficult to move.

Measuring scheme for vibrational data.
Vibration measurement in a railway environment requires large scale equipment in a big facility with a large amount of cabling and sensory equipment. It is difficult to build a general vibration measurement system for analysis of railway related structural problems. When the measuring point is the intersection of two railroads both the upper and lower branches of large vessels must be simultaneously measured. When making these types of measurements, equipment must be transported to the site, requiring a lot of manpower. Use of vibration measurement equipment must follow a detailed procedure and the operational personnel present at the time of measurement should be experts.
In order to reduce the operational problems associated with transport of analytical equipment and manpower requirements, a vibration measurement system based on the Android platform is presented. This simple to use system can be easily operated by nonprofessional personnel in the field. Data for analysis can be sent to experts at a remote location. Similar systems have been proposed [6–9]. Kee-Yin Ng [10] presented a simple communication system between intelligent mobile terminals and control equipment using a Bluetooth serial adapter.
In addition, the development of the Internet and various sensors is major issue for big-data analysis. References [11–14] proposed a performed data aggregation on the basis of entropy of the sensors. The entropy has been computed from the proposed local and global probability models. The models provided assistance in extracting high precision data from the sensor nodes. In [15], a new energy-efficient routing protocol using message success rate has been proposed to resolve the node concentration problem.
This paper is organized as follows: Section 2 presents development of hardware and software implementation. Simulation results and discussion are presented in Section 3 and concluding comments are presented in Section 4.
2. Proposed Technique
An overview of the development system is shown in Figure 2. A Bluetooth module and a vibration sensor are used to transfer data from a data acquisition device.
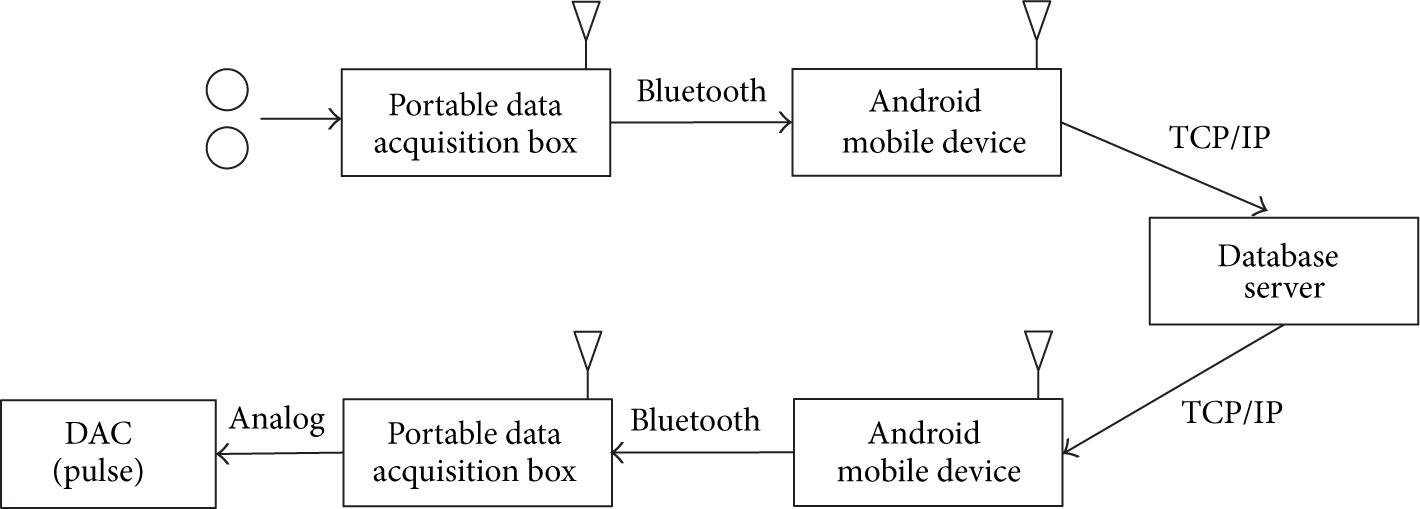
The proposed system design of the overall process.
It is possible to collect field data for analysis in a remote location. Bluetooth components in a portable data reconstruction box and a portable data acquisition box are used to configure the vibration measurements for a direct connection. Vibration measurements using an acceleration sensor generally use a connected DSP. After the signal processing, General Purpose Interface Bus (GPIB) software is used. Measured data are thus subjected to fast Fourier transform (FFT) [16] for conversion of time-domain sampling data to frequency-domain data prior to analysis.
2.1. Hardware System
2.1.1. Portable Data Acquisition Box
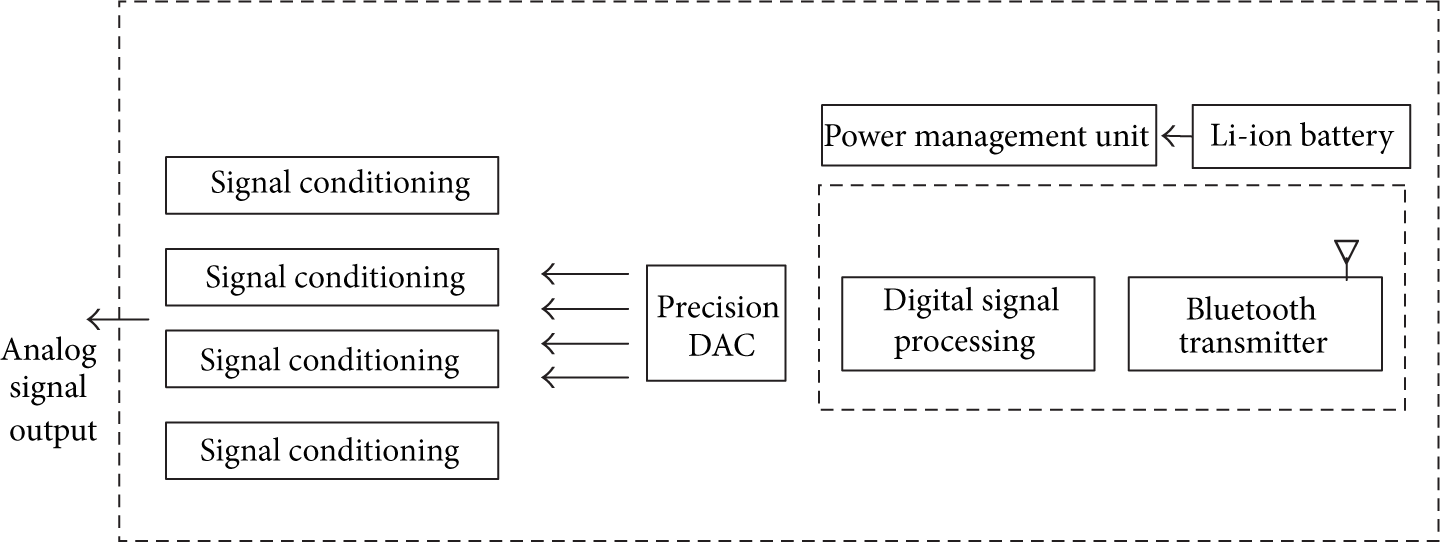
Figure 3 shows the structure of a portable data acquisition box that receives data from sensors. The box was designed with sending and receiving control circuits for Bluetooth communication and a microprocessor circuit design for integrated circuit piezoelectric (ICP) sensor signal conditioning using amplifiers and data acquisition devices.

Portable data acquisition box.
A typical ICP sensor BIASING to obtain power is supplied to the signal structure (Figure 4). All ICP sensors require a constant current power source for proper operation. The simplicity and the principle of 2-wire operation can be clearly seen from Figure 4. A parani-bcd110du chip that supports Bluetooth class 1 is employed [17]. The Bluetooth module is configured as shown in Figure 5.

ICP sensor BIASING circuit.

Bluetooth block diagram.
The microprocessor, signal conditioning amplifier, circuit diagram, and hardware will be discussed in Section 3.
2.1.2. Portable Data Acquisition Box
Figure 6 shows the structure of the portable data reconstruction box that receives data from remote locations. The portable data reconstruction box and the portable data acquisition box use the same CPU and Bluetooth module.
Portable data reconstruction box.
The portable data reconstruction box receives Bluetooth data that are then sent to the CH via a digital-analog converter (DAC). Figure 7 shows a block diagram for the DAC, which has a characteristic in which the error does not exceed 0.5 LSB in the 16 bit area. The portable data reconstruction box and the portable data acquisition box have the same structure using a Bluetooth service employing thread and connect thread.

DAC8734 function block diagram.
2.2. Developed Software Structure
Hardware and software to enable communication via Bluetooth used the Android platform.
2.2.1. Android Application
Figure 8 shows the structure of an Android application using the Bluetooth service accept thread and connect thread. Data are transmitted when the portable data acquisition box is connected. The Android program for processing the data received from a mobile device can produce a graph for confirmation. Information can be entered via a Configuration menu. A “Sensor Info” menu and data received from the “Measurement and RX Mode” menu allow access to a graph for expression of received data.

Android application structure.
In Figure 9, the overall configuration of application of Android platform is shown. We have implemented software that enables us to measure, analyze, and transform data in real time. It allows us to monitor in remote type. Also, it is possible to sense data and analyze it using FFT (fast Fourier transform) at the same time. Implementation and analyzed results for each item are discussed in Section 3.

Overall process of software.
2.2.2. Data Transport Protocol
In computer science and telecommunications, a communications protocol is a system of digital rules for data exchange within or between computers. When data are exchanged through a computer network, the rules of system are called a network protocol. In Figure 10, the designed protocol structure is displayed.

Protocol structure.
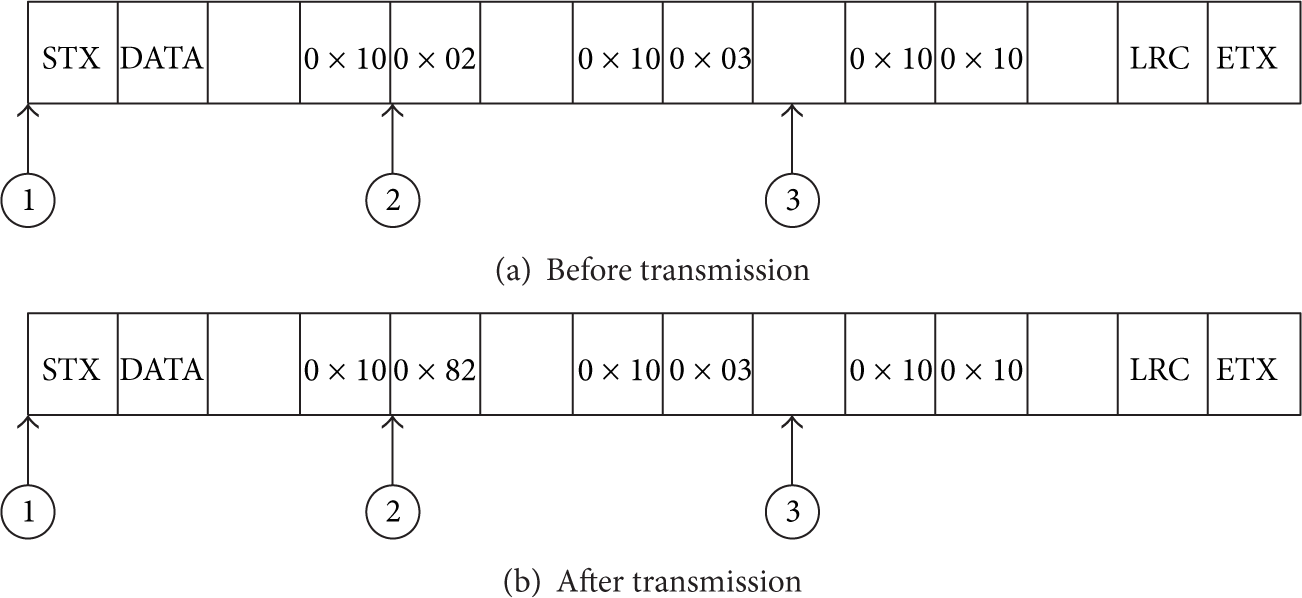
An STX packet indicates the start of text and an ETX packet indicates the end of text. The structure is obtained by adding a longitudinal redundancy check (LRC) for detecting errors in transmitted data. The STX and ETX packets are not used as data. They are only markers. The packet receiving unit must know the beginning and end of the transmission time so that all packets can be accounted for with no problems. The STX packet indicates the beginning of a packet using the hexadecimal number 0X02 as shown in Figure 11(a). The ETX packet indicating the end of the packet uses the hexadecimal number 0X03. DATA is the actual data. LRC is the only DATA error check.
Transmittance process method.
The LRC process checks all data (not the STX, LRC, and ETX packets). While processing data, a transmittance process is used because of the possibility of existing STX and ETX code in the data stream. In Figure 11(b), the transmittance process excludes the STX and ETX bytes. If STX appears during the transmittance process, STX and 0X08 are calculated using an OR operation as 0X82 to enable the packet to produce only one STX in the whole packet that is transmitted once. This process is necessary to determine the starting point of a packet in serial communication. On the receiver side, a packet structure is used to allow identification of the starting point.
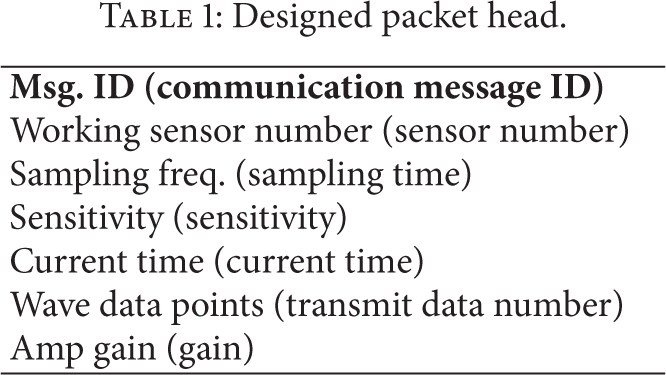
Table 1 describes the designed packet head. Packet head has the information necessary for common packet of one. Channel information, current time, sampling time, and the number of information data to be transmitted are defined in the buffer. In this study, the data is transmitted based on the serial communication. If the data loss is present, the lost packet is not used.
Designed packet head.
2.2.3. Remote Access Server
In this paper, it is to be sent to the server data measured in a remote location, analyzing the measured data at the same time in the client and the server. DBMS (database management system) is on a remote server in order to synchronize the client and server. DBMS synchronizes data received from client with other clients. Then, it saves necessary data into database. Client uses WIFI network when it sends the sensed data.
In Figure 12, the structure of data transmission is illustrated. Vibration data using the Bluetooth communication is transmitted to the portable device. It is sent to the database servers at the request of the user and transferred to another mobile device from the database server.

Data transmission structure.
3. Results and Discussion
A wireless data acquisition system for hardware and software systems is proposed. Results for the proposed method were confirmed using the Android platform.
3.1. Results of Designed Hardware Platform
Figure 13 shows the microprocessor circuit diagram. A TMS320F28346 CPU was used (TMS320C2000 series). The C2000 series has good performance at a reasonable cost.

Microprocessor circuitry.
A signal created from accurate ICP sensor signal control amplifier circuit should process ADC that converts analog to digital as shown Figure 14. In this study, we used ADS1274 assured 24 bit accurate and high speed accurate convert for composing ADC circuit.

Delta-sigma ADC I/F circuitry.
Figure 15 displays a circuit diagram for the signal conditioning amplifier. The signal supplied to the ICP sensor generates a constant current with high accuracy using the voltage generated. In order to adjust the gain in accordance with the sensitivity of the sensor, a programmable gain amplifier was used with a fully differential amplifier for signal formation of low noise.

Signal conditioning amplifier schematic.
In Figure 16, a power supply of portable data reconstruction box is shown. To input power of DSP and peripheral devices, we put the power supply at 5 V and then divide it into 5 V, 3.3 V, and 1.8 V. To reduce noise, we designed an analog circuit both
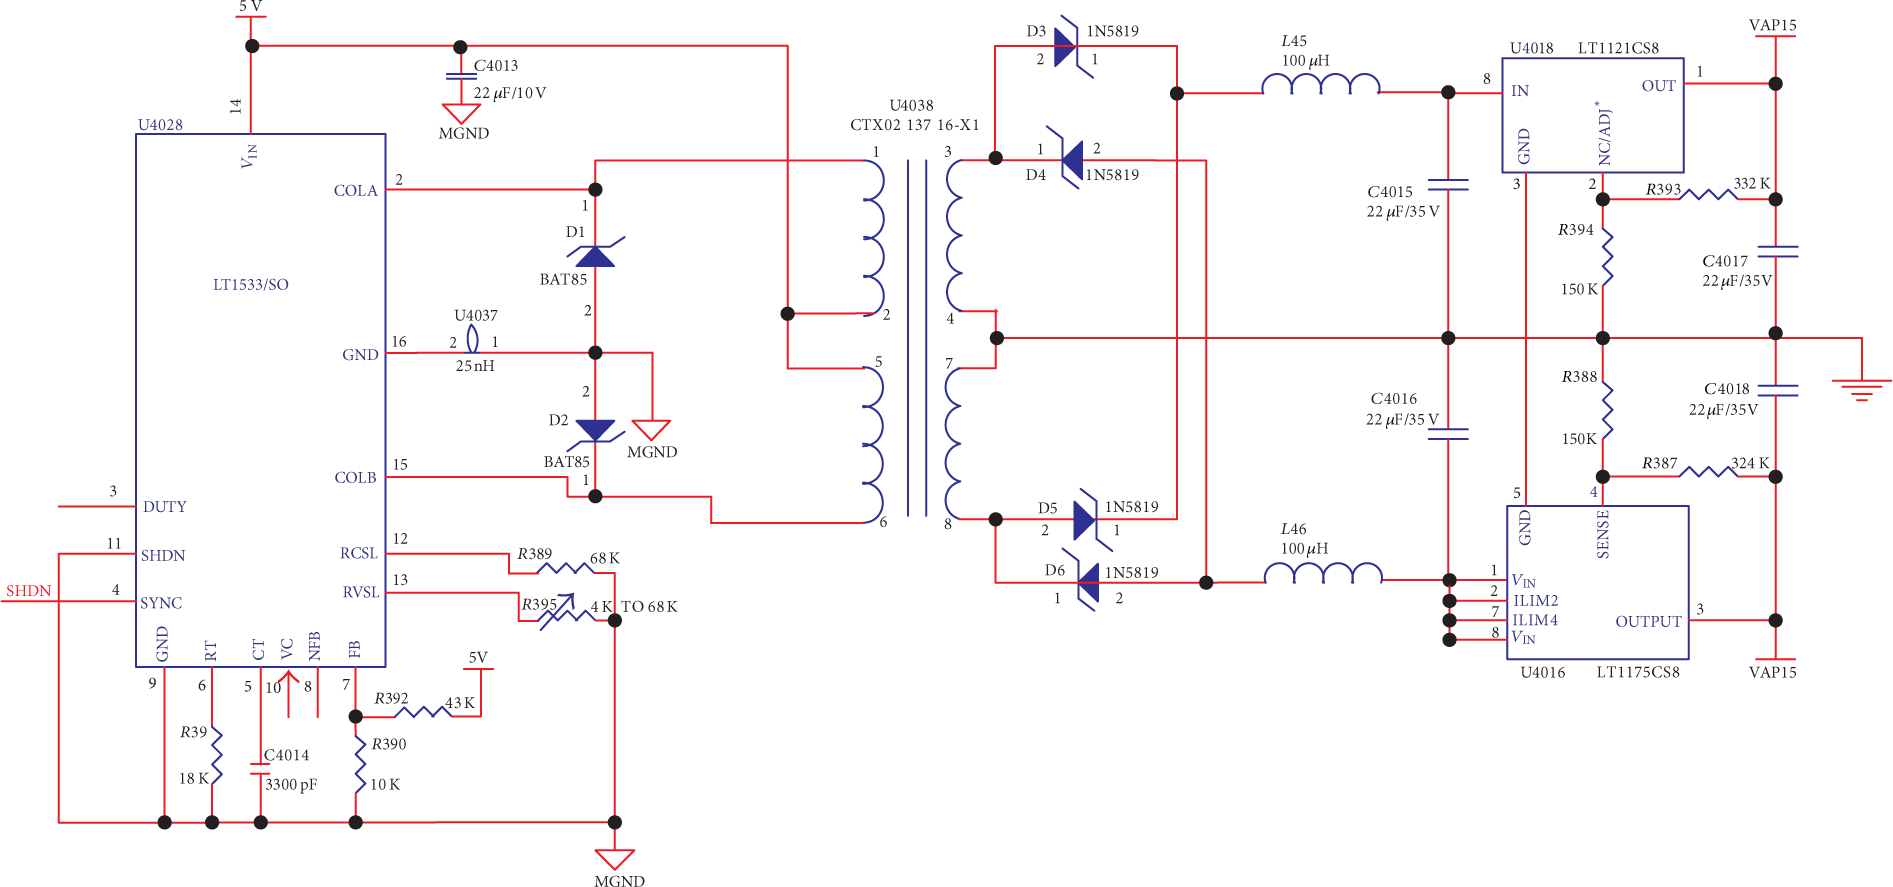
Power control schematic.
Figure 17 shows a complete portable data acquisition board. A total of 4 sensors can receive data. Figure 18 shows a complete portable data reconstruction board that has developed in the same manner as the above.

Portable data acquisition board.

Portable data reconstruction board.
3.2. Results of Software Platform
Table 2 describes the information of the device used in the experiment. Basically, we used the device that supports Android OS. In the experiment, we have checked on data transmission distance and accuracy of data transmission. First, data were measured by using a shaker system to verify the accuracy of the data. Through a shaker system sent data with various frequencies, it was confirmed that the developed system could receive the exact data. Figure 19 shows a shaker system that has been used for our experiment.
Test conditions.


Shaker system.
Further, when performing frequency conversion on the Android platform that has received the data from the sensor, we also checked data through receiving a distinct frequency to a client to verify the accuracy of data.
Figure 20 shows data received from a shaker system to Android platform. Figure 20(a) shows a result in which we used the values that are frequency of 30 Hz and amplitude of 0.1 and Figure 20(b) shows the used the values that are frequency of 20 Hz and amplitude of 0.2. Using sine waves with periodic frequencies, we observed the received data and transformed characteristic of the received signal, accurately.

Experiment of accuracy.
Using the configuration of menu as shown in Figure 21, it is possible to enter a title for a measurement, along with a charge, a customer name, the number of channels, sampling rate, and data. The number of channels refers to the number of sensors (up to four possible). Information entered into the configuration menu can be confirmed by personnel at a remote location via the server.

Configuration menu.
In Figure 22, the “Sensor Info” menu represents data in graphical form that is transmitted from the module. However, it is possible to enter the value of the gain and sensitivity to complement the data because an error may occur. By entering the IP address and port of the server and saving it through the “Save” button, the information for communication with the RX mode is set up. Also, we can click the button corresponding to each channel to show or hide the corresponding channel. Figure 22 shows that the state of the channel is on and all four series are shown in the Graph.

Sensor Info menu.
Figure 23 shows results of the “Measurement” menu. “Graph Sensor Info” menu (in Figure 22) shows the same graph. When “Log Start” is pressed while receiving data, as shown in Figure 23(a), data are received and displayed on the screen. FFT (fast Fourier transform) is used to convert time-domain data to frequency-domain data for analysis, as shown in Figure 23(b).

Measurement Info menu.
In order to verify the performance of the developed technology, we took data sensing experiment outside the building. After installing the sensors on the road, it was tested that a mobile device could receive data that has been transmitted. When a person or the car passed through, there was no problem to transfer the data accurately.
As a result of the experiment in Table 3, communication distance at the outside has been measured by up to 170 m. From almost 160 m of a remote distance, we can observe a little packet loss of the sensing data. From over 170 m of distance, we could not analyze the signal using some transformations because data was corrupted so much. Based on this result, we can induce that the stable communication range of the proposed system can be up to 150 m.
Experiment result of range test.

The accuracy of the transmitted data was guaranteed and real-time transmission and signal transformation were also operated normally. Vibration measurement data obtained in the field by nontechnical personnel can be transmitted via a wireless communication system for expert analysis in a laboratory. Analysis and receipt of data can occur simultaneously for quality checking and speed. This wireless data communication method reduces the amount of manpower necessary for transport, acquisition, and analysis of data. Further development of this wireless vibration measurement data system in conjunction with a wired system to deal with various field situations will be possible.
4. Conclusion
A wireless sensing method is proposed for measurement and transmission of field derived vibration data to a remote location to reduce manpower requirements for equipment transport and data acquisition and analysis. A low cost of hardware is suitable for wireless transmission of vibration data measurements. Design, development, and software implementation were achieved to prevent data loss of packet. Development of wireless data measurement system can be commercialized to resolve the current need for expensive technologies.
Footnotes
Conflict of Interests
The authors declare that there is no conflict of interests regarding the publication of this paper.
Acknowledgments
This research was supported by the MSIP (Ministry of Science, ICT, and Future Planning), Korea, under the IT/SW Creative Research Program supervised by the NIPA (National IT Industry Promotion Agency) (NIPA-2013-0079-01).