
Abstract
Bending stiffness is an important factor to determine the mechanical performance of bus body skeleton. Traditional computational method for bending stiffness is sensitive to local deformation and load applications, which often results in great fluctuation to the computational results. This paper proposes an advanced computational method for bending stiffness based on deformable feature curve of bus body. Firstly, the feature point collection from the deformation of bus body under bending conditions is extracted. Secondly, all the feature points are processed by means of coordinate transformation and then the feature curve of bus body deformation is established via piecewise cubic curve-fitting. Lastly, the expected value of bending stiffness of bus body is obtained through the stiffness samples which are computed according to the feature curve. Furthermore, a FORTRAN program is written to implement the method. Compared with the traditional methods, the validity and stability of this method are verified via several numerical examples. This method is meaningful to the conceptual design of a bus body, as the experimental measures are difficult to be carried out in the early stage.
1. Introduction
Stiffness is an important factor to determine the mechanical performance of vehicle body structure, which not only can determine the load-carrying capacity of vehicles but also has an effect on the NVH performance, vehicle safety, and passenger comfort [1–3]. Much research involving the stiffness performance of vehicle body structures has been carried out extensively. For instance, the influence of joint property on stiffness of vehicle body is summarized and some researchers proposed a fast evaluation technique for body-in-white based on semirigid structure [4–6]. Many researchers utilized types of optimization algorithm to reduce weight of the bus body structures with structural performance constraint (such as overall strength and rigidity) [7, 8]. Bending stiffness has always been widely regarded as an important index to score stiffness of vehicle bodies. However, the bending stiffness values of vehicle body structure from current experimental testing ways depend strongly on the variation of load applications or boundary conditions and therefore are not easy to compare [9]. Furthermore, while CAE method has been widely used as an effective tool to evaluate stiffness in the concept design of vehicle body during the past decades [10–13], the traditional computational methods for bending stiffness under CAE environment still have the same problem.
The traditional evaluation methods for bending stiffness of a bus body generally proceed in the form of the following two ways.
(1) Supposing the bus body is under simply-supported condition and loaded at somewhere between the supporting points. The ratio of load P to corresponding deflection δ is taken as bending stiffness, which is defined as

(2) At the same condition, the stiffness can also be evaluated by

where EI is the bending modulus and y is the associated vertical deviation of x. The bending stiffness value represents the load needed for unit length to generate unit rotation angle.
There are some concerns with regard to the traditional methods. First concern is that traditional bending stiffness computational method is largely influenced by the spring rate and the rigidity of suspension attachment structures. To eliminate influence of suspension, a general approach is to designate the suspension as a rigid body or apply constraints directly to the suspension attachments. However, the computed values of bending stiffness still depend strongly on local deformation of different types of attachments.
Second concern is that the load applications of the above two traditional evaluation methods are usually performed at some certain points of the structure. But a bus body is a complex spatial structure rather than a uniform beam, which contradicts with the calculation theory of these two methods. Hence, the computed values of bending stiffness will fluctuate drastically when the loading position changes. And this imperfection of instability is much more obvious on the bus bodies by reason of its larger scale. Thus, in a word, a stable and objective computational method for bending stiffness, which may play an important role during the conceptual design stage, is still to be determined.
During our previous research works, we got some regularity based on the second traditional computational method. (1) The computed (EI/L) i varies with the x i ; (2) the computed (EI/L) i of a certain bus body structure obeys normal distribution. This enlightens us that in most cases we can use statistical ways to process the computed results of bending stiffness.
According to the discussion above, we propose an advanced computational method for bending stiffness of bus body structures. In this paper, we first extract the feature point sets which represent the deformation feature of each body section under several load cases. After transforming the coordinate of feature points, the feature curves of body structure are established by fitting curves to the point sets. The samples of bending stiffness are calculated according to the feature curves, and the final value of bending stiffness is then exported via statistical ways, such as maximum likelihood estimation (MLE) and chi-square test to the samples. In the following sections, detailed procedure of the proposed method is discussed, and the advantages of this method are verified via several project examples.
2. Computational Method of Bending Stiffness Based on Feature Curve of Body Deformation
The detailed procedures of this method can be described as follows.
(1) Before finite element analysis, the bending load case for bus bodies should be set up, which simulates the boundary and loading conditions of simply-supported beam model (shown in Figure 1). In order to avoid the problem of local deformation caused by the unreasonable position of loading points, we, respectively, chose four points in the loading section as the loading points which were connected to side walls or keel beams to simulate the bending case. These points have good stiffness and are hard to produce large local deformation.

The bending case of a bus body.
(2) Divide the bus body into several sections in the lengthwise direction. Each section will be represented by a feature point. The feature point set can be extracted as the following steps.
First we divide the bus body structure between front axis and rear axis into n sections along the x-axis of vehicle coordinate system by an appropriate distance. For instance, in the following, the body structure of one bus product is divided into fifteen sections. Section i (i = 1, 2, …, n) contains n i nodes. Then, we establish a feature point set Φ = {(u i , v i )∣i = 1, 2, …, n}, where u i is the average abscissa of n i nodes of section i, and v i is the average vertical deformation value of n i nodes of section i. Thus, the vertical deformation of a bus body can be described using the point set Φ. The point set Φ is obtained via statistical adjustment including establishing confidence interval and removing gross error.
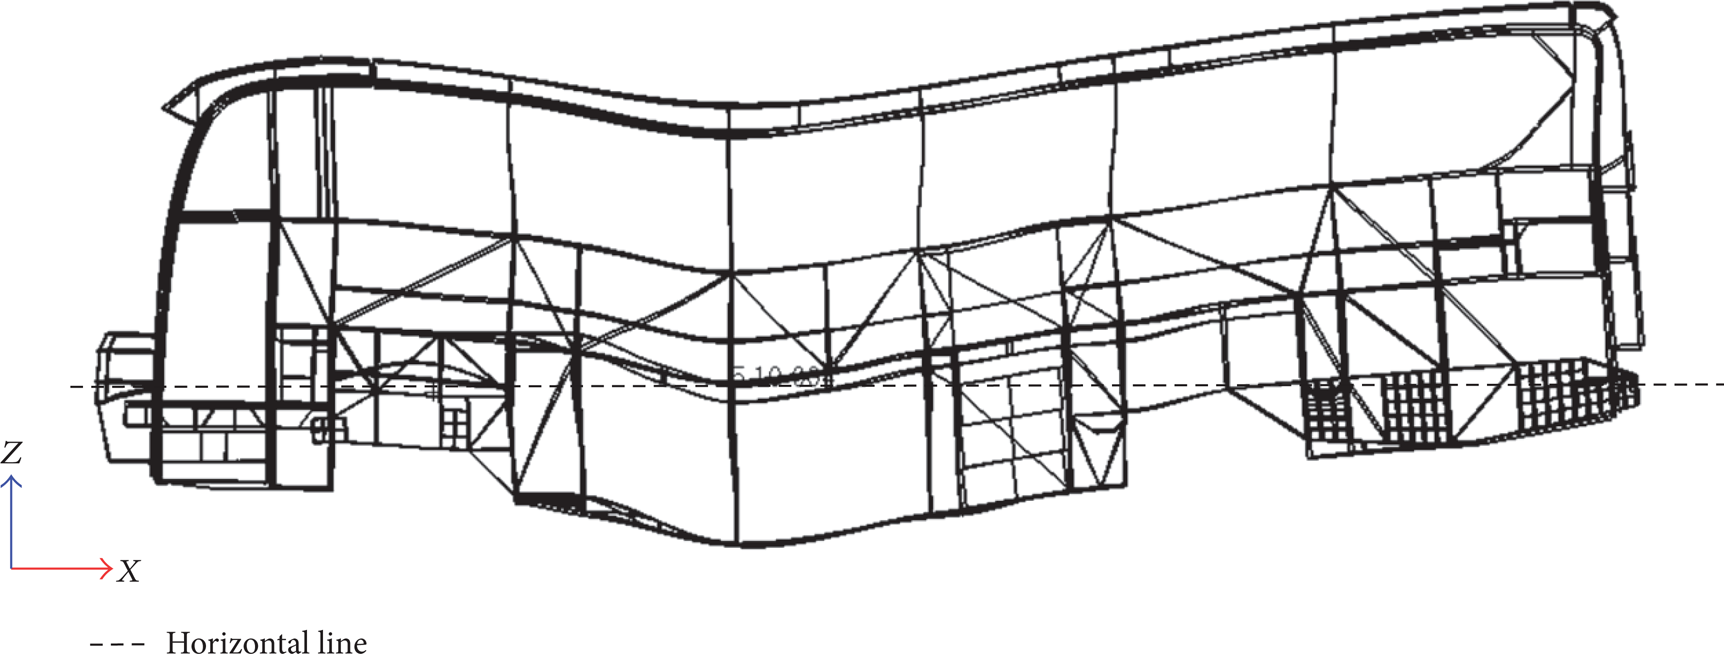
(3) Transform the coordinate to reduce the influence of local deformation.
Even for the same basic body structure, we still find significant differences among stiffness calculation results due to different suspension support structures. Coordinate transformation for the feature points is a quick and easy way to remove the displacement caused by soft support structure. More details of coordinate transformation are described in Figure 2 and the text below.

Coordinate transformation of the feature points.
According to the feature point set Φ we further define two special points A and B, where A is the feature point of first section and B is the feature point of last section. Then, we define a new horizontal axis O′-X that falls on the line between point A and B. Meanwhile, the new origin O′ coincides with point A. After establishing a compatible longitudinal axis O′-Y, we can obtain the new coordinate system O′-XY.
Through transformation from coordinate system O-UV to O′-XY, the new feature point set φ = {(x i , y i )∣i = 1, 2, 3, …, n} can be achieved by the following formulae:

where u A and v A are the coordinate values of feature point A under original coordinate system O-UV and α is the angle contained by the two horizontal axes.
(4) Feature curve-fitting to the feature point set φ.
The expression of deflection curve of simply-supported beam model with off-center loading is stated as

From (4), it is clear that the deflection curve of simply-supported beam model is a continuous, piecewise, and cubic curve. Therefore, in order to make it close to simply-supported beam model, we fit a piecewise cubic curve to the feature point set φ using least square method.
The fitting curve can be simply expressed:

where x P is the abscissa values of loading location of coordinate system O′-XY. Concerning the specific form of (4) and the boundary conditions g(x A ) = g(0) = 0 and g(x B ) = 0, we define

In addition, there are still two constraints for continuous condition:

Substituting (6) into (7), we have

Then, we define the least squares estimator

The unique solution of ϕ i for the minimum S can be calculated by solving

So far, all the unknowns of (5) are solved, which describes the deformation of a bus body structure under a specific bending case.
Note that the sample size should be greater than 50 when chi-square test is used. Hence, we need to create 4 or 5 bending cases, and the force applications of each are applied in the middle part of a bus body randomly. These load cases are recorded as C j (j = 1, 2, 3, …, m).
Thus, the expression of feature curves can be further extended from (5) to

where x Pj is the abscissa value of loading position of coordinate system O j ′-X j Y j under the load case C j and

And the transformed coordinate system O j ′-X j Y j for each feature curve can be achieved by

where u Aj and v Aj are the coordinate values of feature point A of original coordinate system O-UV under the load case C j .
(5) Calculate bending stiffness K ij with respect to variable x ij by extending (2) to

where
Via formulae (11) and (14), we get a set of bending stiffness samples (K11, K21, …, Kn1, K12, …, K nm ). If these are normally distributed, the expectation will be exported as final bending stiffness of a bus body, otherwise the median will be exported. Bending stiffness values of most bus bodies calculated by (14) are normally distributed. In that case, we can use Pauta criterion to eliminate exceptional data on the condition that sample number is more than 13.
To use Pauta criterion, we need to calculate the mathematic expectation

the standard deviation

and the residual error
By Pauta criterion, the sample will be rejected when it meets the following condition
After the above data sieving, we should compute the mathematic expectation
So far, this evaluation method is considered as more stable during the computation process.
3. Programming the Computational Method
To improve the efficiency, we have already written a FORTRAN program to implement the computational method, which can automatically extract the expected data from the outcome of FEM analysis to compute the bending stiffness of bus bodies. This program can evaluate bending stiffness for various types of bus bodies.
A summary of the procedures of the program is listed as follows.
Set up all the bending load cases C j , and carry out static analysis in FEM software. In this paper, we use MD NASTRAN as solver.
Read the NASTRAN input deck file (*.bdf) to record information including coordinates of nodes x ij of each section i and the loading location of each load case.
Read result files of NASTRAN (*.f06) to record deformation information of all nodes x ij .
Compute the bending stiffness of a bus body using this method, which contains the procedures of coordinate transformation, feature curve-fittings, chi-square test for stiffness samples at 0.05 level, and filtering exceptional data.
Export the final evaluation value of bending stiffness (mathematic expectation or median of the samples).
4. A Case Study
As examples, models of two buses are created. From Figures 3 and 4, we can see clearly that the major differences between them are the different types of front suspension and the relevant local structures, for the two buses are of one product family. The independent front suspension is used in bus product 1 for higher market positioning, and the dependent front suspension is used in the other case.
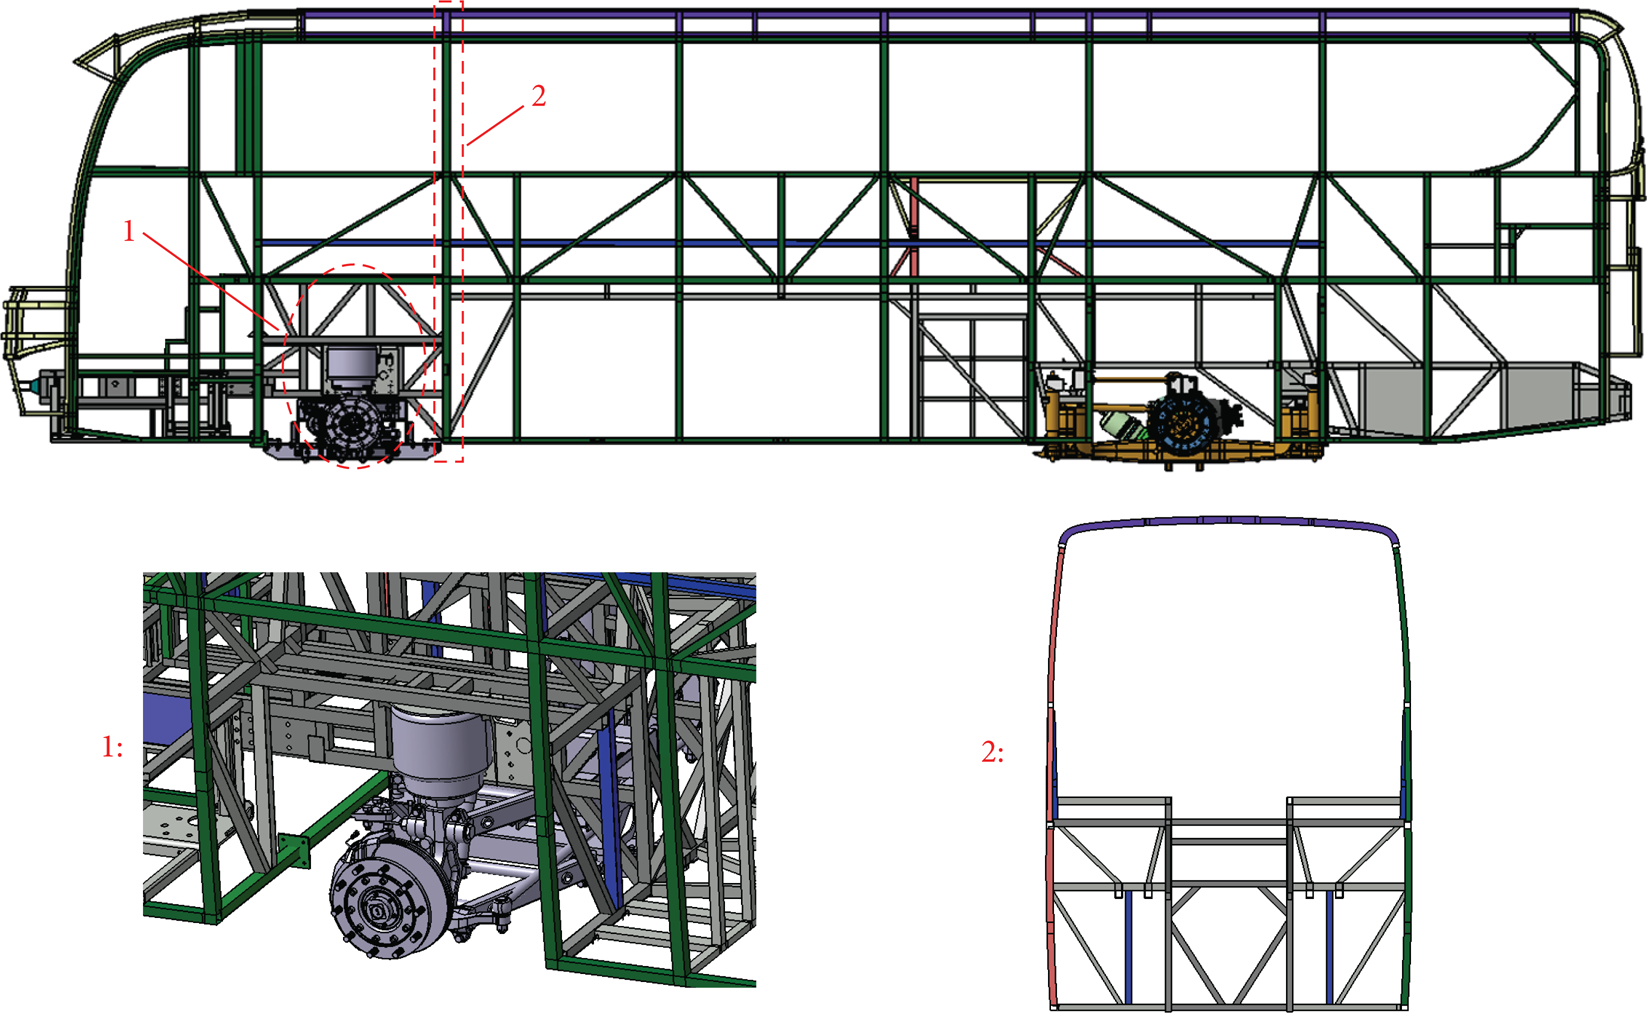
A 3D geometry structure for bus product 1.

A 3D geometry structure for bus product 2.
4.1. FE Models and Experimental Verification
Finite element models are used to calculate how the buses would behave under certain load configurations. The major structures of the two buses are modeled using BEAM element which is defined in MSC.NASTRAN.
To validate the modeling method, one bus body has been tested and the obtained stress values are compared with the results of simulation (see Figures 5 and 6).

Real structure of a bus product.

Stress data obtained from test and simulation.
4.2. Stability of the Computational Method with respect to Different Local Structure
First we use the traditional methods mentioned above to compute bending stiffness of the two products. To the end of single factor investigation, we need to regard suspensions as rigid bodies and select a similar loading location for both products. The results are listed in Table 1.
Bending stiffness from traditional methods.

From Table 1, it is clear that the differences of the stiffness (using traditional methods) between two products are around 15%. The reason can be easily concluded as described below.
According to displacement analysis of product 1 (see Figure 7), it is indicated that the whole front part of body moves downward due to the local deformation of suspension support structure (it can be called cross-over bridge structure consisting of several longitudinal beams, which is a soft structure to raise the buffer capacity of bus body structure). Figure 7 shows that the front part of body structure remains in its original location under the bending load case because of the greater rigidity of suspension support structure, which is a part of frame rather than an additional cross-over bridge structure. This explains why the computed bending stiffness of traditional methods of product 1 is much smaller than that of product 2. However, it is unreasonable to consider that the rigidity of bus product 1 is much weaker than that of product 2 (Figure 8), because the two products are established on one basic body structure and the local deformation is specifically allowed. The computational results of traditional methods are obviously distorted.
Displacement analysis of bus product 1.

Displacement analysis of bus product 2.
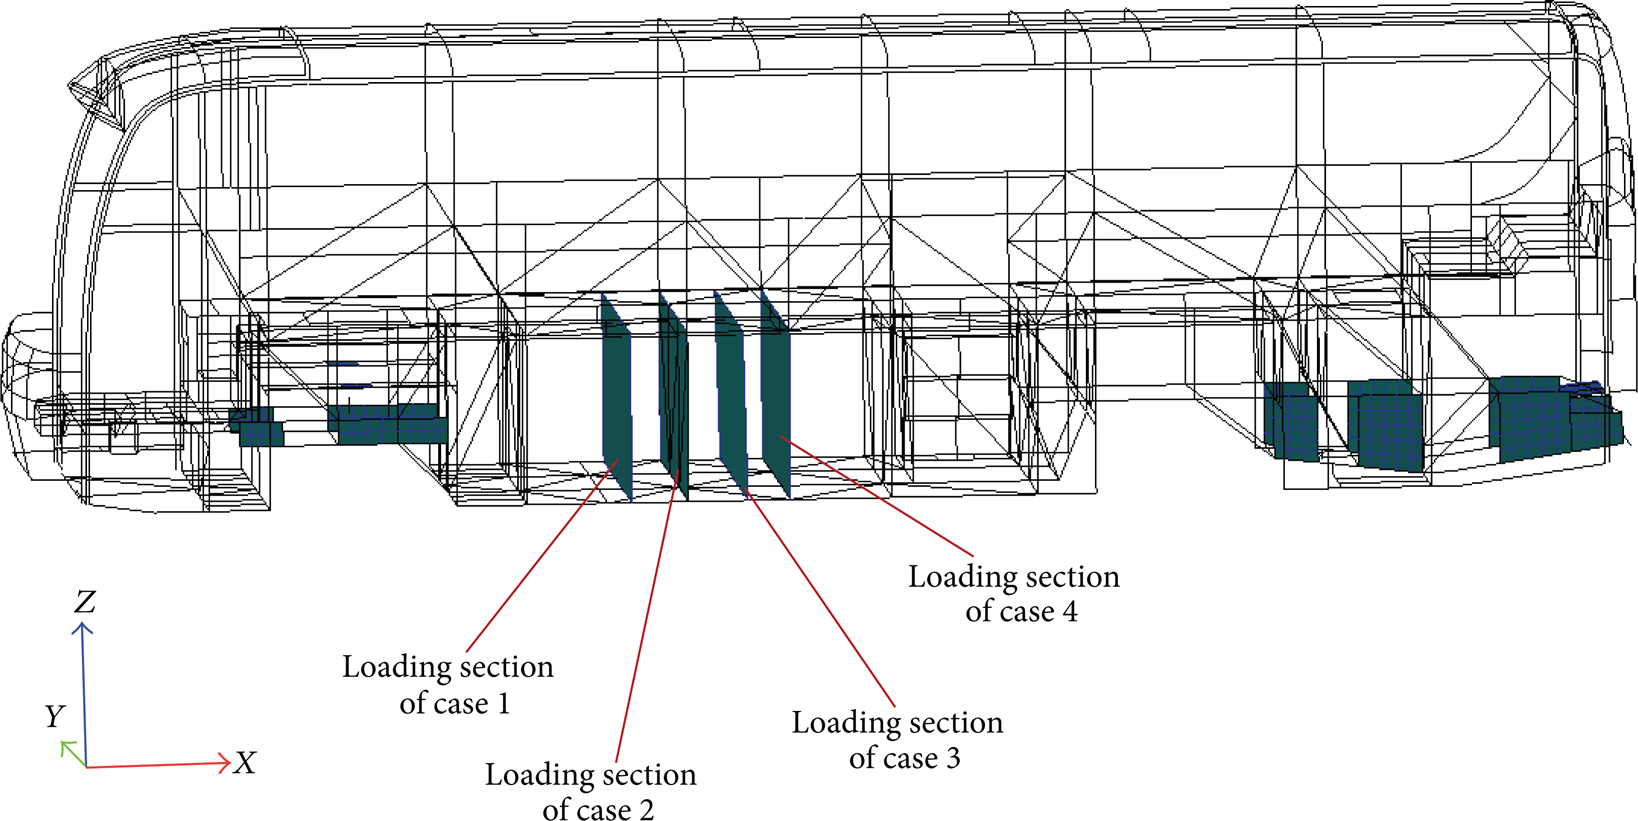
Then, the new method is utilized. Both products are exposed to four load cases in order to obtain enough samples. Each of the four cases has a bending load application randomly applied on the middle part of the bus body. The load application of each load case for products 1 and 2 is shown, respectively, in Figures 9 and 10. Note that the suspension structure does not have to be designated as rigid and the load cases between two products need not be the same.

Loading locations of the four load cases for bus product 1.

Loading locations of the four load cases for product 2.
The numerical samples of bending stiffness for the two products are listed in Tables 2 and 3.
Stiffness samples of product 1.

Stiffness samples of product 2.

According to the results of MLE and chi-square test (see Tables 4 and 5), it is concluded that at 0.05 level of significance, stiffness samples of product 1 are in normal population N1 (1.74 × 10⁷, 2.40 × 10⁶) and stiffness samples of product 2 come from normal population N2 (1.67 × 10⁷, 1.78 × 10⁶). The results also show that bending stiffness of product 1 is a bit greater than that of product 2, which can be regarded as reasonable changes caused by local structural variation. Therefore, the interference of local factor, especially the local deformation of suspension support structure, has been eliminated effectively using this computational method. Furthermore, variation of the spring rate will no longer influence the stiffness computation processing for the same reason.
The chi-square test for product 1.
The chi-square test for product 2.
4.3. Stability of the Computational Methods with respect to Different Loading Locations
To evaluate the stability of the conventional methods concerning varied loading positions, three load cases are set up for product 2 and each of them contains a unique defined loading section, seeing Figure 11. The results are shown in Table 6.
Bending stiffness computed by traditional methods for product 2.


Loading locations of 3 load cases for product 2.
From Table 6, obvious discrepancy (over 30%) can be seen. It is difficult to decide which result represents the rigidity performance of product 2.
Next we test the stability of the method proposed in this paper. Compared to the former one analyzed in Section 4.1, another four load cases with different loading locations are established, depicted in Figure 12. After chi-square test, it is verified that the bending stiffness samples obey the normal population N3 (1.75 × 10⁷, 2.42 × 10⁶), which is very close to the former result N1 (1.74 × 10⁷, 2.40 × 10⁶). Thus, in a word, the new method established in this paper has got better performance in resisting the variation of loading condition.
Another four load cases for product 2.
5. Conclusions
In this paper, an evaluation method for bending stiffness based on feature curves of bus body deformation is proposed, which is superior to the traditional methods. Compared with traditional methods, results of several numerical examples show that this advanced computational method has much better performance in the following two respects.
The procedure of this stiffness computational method can effectively eliminate the influence caused by local deformation.
Different load applications are no longer resulting in great changes to the computed results of one body structure with this method. This method is meaningful to the conceptual design of a bus body product, as the experimental measures are difficult to be carried out in the early stage.
Further studies based on this work can be of great interest in terms of evaluating the distributions of bending stiffness in the vehicle body structure.
Conflict of Interests
The authors declare that there is no conflict of interests regarding the publication of this paper.
Footnotes
Acknowledgment
This work was supported by the National Natural Science Foundation of China (Grant no. 51075187).