
Abstract
Natural supercavitations in water and turbulent drag-reducing solution were numerically simulated using unsteady Reynolds averaged Navier-Stokes (RANS) scheme with mixture-multiphase model. The Cross viscosity equation was adopted to represent the fluid property of aqueous solution of drag-reducing additives. The characteristics of natural supercavity configuration and overall resistance of the navigating body were presented, respectively. The numerical simulation results indicated that, at the same cavitation number, the length and diameter of supercavity in drag-reducing solution are larger than those in water, and the drag coefficient of navigating body in solution is smaller than that in water; the surface tension plays an important role in incepting and maintaining the cavity. Turbulent drag-reducing additives have the potential in enhancement of supercavitation, drag reduction, and decrease of turbulent vortex structures. Numerical simulation results are consistent with the available experimental data.
1. Introduction
The research topic regarding cavitation has been of significance for over a century. In hydrodynamic or hydraulic engineering application devices, cavitation is usually an undesirable phenomenon for its negative influences on the performance of hydraulic turbomachinery, such as load asymmetry, noise, vibration, and surface erosion. For decades, related researches on cavitation were therefore mainly to prevent the inception of cavitation and control its evolution. However, the cavitating effects can also be used for positive benefits in some particular applications. In supercavitation scheme, a submerged body is totally enveloped in a large cavitation bubble. Because the density and dynamic viscosity of vapor are much lower than those of water, the skin friction felt by the navigating body submerged in a supercavitation can be reduced dramatically. If the configuration of the supercavity is effectively controlled, the drag can be reduced by one to two orders of magnitude, as reported by Savchenko [1]. In recent years, there has been an increasing interest in the investigation of supercavitating flows of submerged bodies for its virtue of drag reduction.
Cavitation number (σ) is the key parameter used for characterizing cavitating flow, which is defined as follows:
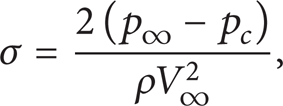
where p∞ is the characteristic pressure (e.g., the pressure in the ambient liquid for a submerged navigating body), p c is the cavity pressure, ρ is the liquid density, and V∞ is the characteristic velocity (e.g., the submerged body navigating velocity). By decreasing the cavitation number, three regimes can be defined: cavitation inception, developed cavitation, and supercavitation. Supercavitation usually occurs when the cavitation number is below 0.1. There are two types of supercavitations formed in two different ways. The first is natural supercavitation, which is obtained when a submerged body moves at high enough speed (V∞) or in an environment at low enough hydrostatic pressure (p∞). For natural supercavitation, p c is approximately equal to the saturated vapor pressure corresponding to the operating temperature. The second is artificial or ventilated supercavitation, which is formed at a speed much lower than that required for natural supercavitation by injecting noncondensable gas into the low-pressure region near the nose of the submerged navigating body. For ventilated supercavitation, p c represents the pressure inside the cavity.
The key point of maintaining a cavity in liquid to survive is to stabilize the surrounding liquid-gas or liquid-vapor interface. In the process of growth or collapse of a gas bubble in liquid, or the initiation stage of supercavitation, surface tension may play a significant role. It was reported by He [2] that the surface tension suppressed the growth of a laser-induced cavitation bubble and enhanced its collapse. The surface tension suppresses the expansion process of a vacuole and accelerates its shrinkage process and always reduces the volume of the cavities. As stated by Shi et al. [3], when the cavity grows, the surface tension keeps the process stable and keeps the cavity orbicular; when the cavity begins to collapse, the surface tension will accelerate the process. This indicates that, at similar environmental conditions, the cavitation bubble can be larger in size and longer in life-time if the surface tension is decreased. Hence, changing the local surface tension could be an effective way to control cavitating process. Water-soluble surfactant additives can be one of the candidates for the cavitation-controlling purpose since they significantly decrease the surface tension of water.
Some certain surfactant additives have two more distinctive features: enhancing the occurrence of boiling phenomena and reducing friction drag of wall-bounded turbulent flow. Both of these two distinctive features may play positive roles in the supercavitating drag reduction of underwater navigators. Firstly, cavitation itself is essentially a kind of boiling phenomenon. Reports on boiling phenomena with surfactants in the literature all focused on the enhancement of boiling heat transfer, as reported by Cheng et al. [4], for example. What happens in this boiling heat transfer enhancement with surfactant additives is the large increase in the number of vapor nuclei caused by even small decreases in surface tension due to surfactant. This implies, from one hand, that surfactant additives may enhance cavitating process. Secondly, it is straightforward that the drag-reducing effect of some kinds of surfactant additives may directly contribute to reducing the friction drag by modifying the turbulence structures in the boundary layer [5, 6] on the underwater navigating body, particularly before the formation of supercavitation.
Based on the abovementioned threefold considerations, that is, decreased surface tension, enhancement of boiling heat transfer, and turbulent drag-reducing effect, we proposed a novel control strategy for supercavitating flows using drag-reducing additives. Note that, in order to realize an environment of drag-reducing solution for underwater navigator, of course, we do not need to make the entire water reservoir be solution but only need to make a solution environment locally surrounding the navigator, such as by injection of dense drag-reducing solution at the upstream of underwater navigator. We previously carried out a preliminary experimental study on how the drag-reducing surfactant additives influence a water-entry supercavitating process [7]. The typical results are plotted in Figure 1 for example. It was observed that at the same initial water-entry velocity the size of supercavity in drag-reducing surfactant solution was larger than that in water; the navigating velocity of the launched bullet at the same depth in liquid was faster in drag-reducing surfactant solution and maintaining downstream distance of supercavity is longer in surfactant solution as well (not shown here). We think that these experimental observations about the enhancement of supercavitation in drag-reducing surfactant solution resulted from the abovementioned three different effects, that is, decreased surface tension, turbulent drag-reducing effect, and enhancement of boiling. Through experiment, however, it is difficult to separately investigate how the supercavitation is influenced by those effects, which calls for numerical simulations to this end.

Configuration information of supercavitations formed around a water-entry navigator in water and drag-reducing surfactant solution (a) and navigating speeds in different depths in liquid (b), as reported in Li et al. [7].
With the development of computational fluid dynamics (CFD) techniques, numerical simulation has become a powerful tool for the analysis of supercavitation characteristics. So far, many numerical studies have been performed to investigate the detailed characteristics of cavitating flows. These efforts can be broadly classified into two categories: interface tracking method and two-phase model method. Interface tracking method assumes that there is a distinct interface between liquid and vapor, which can be determined through an iterative procedure. Such method is usually employed to solve the cavitation problem where the cavity can be described as a well-defined closed volume of pure gas. On the other hand, two-phase model method makes no attempt to track the liquid and vapor interface but treats the flow as two phases with an averaged mixture density, which continuously varies between liquid and vapor extremes. Two-phase models can be generally divided into two approaches: one-fluid method and two-fluid method. The two-fluid model assumes that both phases coexist everywhere in the flow field and each phase flow is governed by its own set of partial differential equations. Because the transports of mass, momentum, and energy are explicitly treated, the two-fluid model can easily take into account the physical details occurring at the interface. However, the two-fluid model is less often employed in unsteady cavitating flows because of the lack of knowledge on the parameters associated with phase transition rates, as reported by Kunz et al. [8], Lindau et al. [9], and Saurel and Lemetayer [10]. The one-fluid model, which was adopted in the present study, treats the cavitating flow medium as a mixture of different fluids. This model is based on the assumption that the phases are in locally kinetic and thermodynamic equilibrium, that is, unique velocity, temperature, and pressure for both phases. Therefore, one set of differential equations similar to that for the single-phase flow is used to govern the whole multiphase fluid flow. Models of this kind have been extensively used to simulate cavitating flows because they are relatively easy in treating the dynamic inception and collapse of cavitating bubbles. However, physical phenomena related to vaporization and condensation are assumed to happen instantaneously. Therefore, the one-fluid model cannot reflect strong thermodynamic or kinetic nonequilibrium effects, as reported by Barberon and Helluy [11], Goncalves and Patella [12], and Liu et al. [13]. Hybrid models are intermediate models between the one-fluid and two-fluid models. In these models, each phase is governed by its own continuity equation with a source term accounting for the phase change rate. Other local kinetic and thermodynamic properties are treated in the same way as in the one-fluid model. The hybrid models have also been employed in simulating cavitating flows. Some difficulties lie in the determination of the source term for phase transition [14–16].
Research on bubble dynamics and cavitation phenomenon has benefitted from studies of nonlinear acoustics and modern optical techniques, leading to major advances in the understanding of cavitation bubble dynamics in non-Newtonian fluids (particularly viscoelastic fluid) as well. With the increasingly used non-Newtonian liquids in industrial applications, comprehensive presentations of fundamental processes involved in bubble dynamics and cavitation in non-Newtonian liquids are continuously appearing in the published literature. Most publications concentrate on the cavitation inception, bubble oscillation, and bubble collapse in viscoelastic fluids with turbulent drag-reducing ability. Brujan et al. [17] reported the behavior of laser-generated bubbles in shear-thinning viscoelastic fluids (aqueous solutions of carboxymethycellulose and polyacrylamide). For bubbles with maximum radius being smaller than 0.5 mm, a prolongation of the oscillation time was observed, which increases with the decrease of the maximum bubble radius. Brujan et al. [18] reported that the polymer additive clearly introduces a retardation effect over the initiation of the reentering jet developed during bubble collapse.
In order to have a deep insight into the mechanism of natural supercavitating flow influenced by rheological properties of turbulent drag-reducing activities, the natural supercavitations in drag-reducing solutions were numerically simulated using the one-fluid two-phase model. The Cross viscosity model [19] was utilized herein to characterize the aqueous solution of drag-reducing additives with viscoelasticity. This simple viscosity model has been used in numerical simulations of turbulent drag-reducing flows of viscoelastic fluid, such as by Li et al. [20] and Ro and Ryou [21]. Investigated through all the simulations were the influences of cavitation number, surface tension, viscosity, and viscoelasticity (relaxation time of the solution), respectively, on the characteristics of underwater supercavitating flow.
2. Numerical Simulation Procedures
2.1. Governing Equations
The basic equations for two-phase one-fluid model are the following continuity and momentum equations for the mixture, respectively:
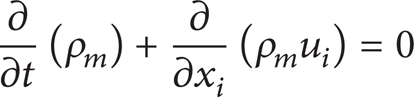

where u is velocity vector, P is pressure, ρ m = (1 − α)ρ l + αρ v and μ m = (1 − α)μ l + αμ v are density and dynamic viscosity of the simulated mixture; ρ l and ρ v are density of liquid and vapor, respectively; μ l and μ v are dynamic viscosity of liquid and vapor, respectively; α is the volume fraction of vapor, F i is body force, and g is gravitational acceleration.
The standard k − ε model with standard wall functions was adopted to provide turbulence closure as shown in the following equations:

where k and ε are the turbulent kinetic energy and dissipation rate, respectively; the model parameters are chosen as follows: Cμ = 0.09, Cε1 = 1.44, Cε2 = 1.92, σ k = 1.0, σε = 1.3.
The “full cavitation model” [22] was used herein to simulate the cavitation process,

where f
v
is vapor mass fraction, f
g
is noncondensable gas mass fraction and presently set to be f
g
= 10−13,
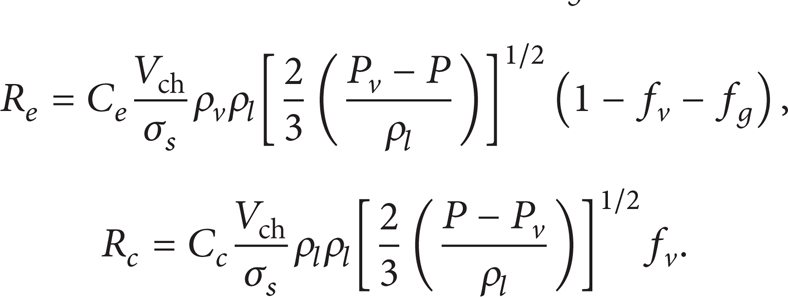
Here, P
v
is saturation pressure, ρ
l
is water density, ρ
v
is vapor density, σ
s
is surface tension coefficient, C
e
and C
c
are two empirical coefficients with values of 0.02 and 0.01, respectively, and Vch is a characteristic velocity, which reflects the effect of the local relative velocity between liquid and vapor and can be expressed as the root square of local turbulent kinetic energy
The viscoelastic drag-reducing solution was characterized through modeling the dynamic viscosity by the Cross viscosity equation, as follows:
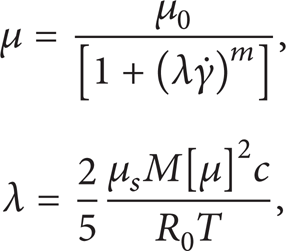
where μ0 is zero shear viscosity; λ is relaxation time;
2.2. Numerical Method and Conditions
Since the simulated underwater navigator (a cylindrical bullet) is axial symmetric, the simulation model was then simplified to be two-dimensional, as shown in Figure 2. The simulated cylindrical bullet was 8 mm in diameter and 80 mm in length. The total computational domain was 400 mm wide (the cylinder was in the middle) and 1500 mm long (200 mm long at the upstream of the cylinder and 1320 mm long at the downstream). The described governing equations were solved by the solver of commercial CFD software FLUENT. A segregated solver with SIMPLE scheme as the velocity-pressure coupling algorithm was selected. The pressure field is discretized using PRESTO scheme. The second order upwind scheme was used for the discretization of the velocity field. Inherently, the values of all the parameters were stored and calculated with double precision. The numerical simulations were for transient flows. The time step is set to be 0.001 seconds, which gives 20 time steps per cycle. The cavitation number was adjusted by changing the initial velocity.
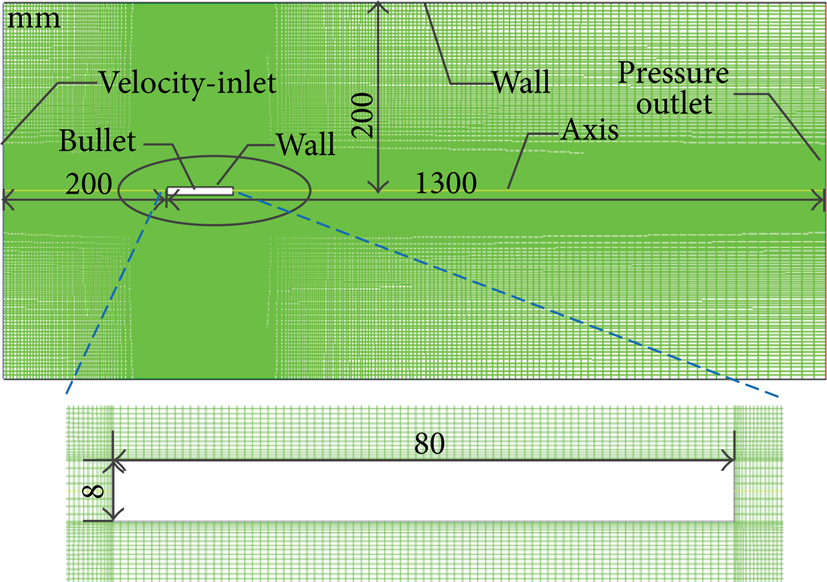
Physical model, computational region, and grid system.
In all the simulations presented below, the working fluid was at 298 K, with liquid and vapor densities of 998.2 and 0.5542 kg/m3, respectively, and saturation pressure of 2350 Pa. Velocities and turbulence quantities were specified at the left (inlet) boundary and an exit pressure was specified at the right (outlet) boundary (shown in Figure 2). The top and bottom side boundaries were set to be solid wall (no-slip for velocity and no penetration). Note that, in all the simulations, the cylindrical bullet was kept still and liquid flowed from left to right, mimicking the case of bullet navigating from right to left in the liquid.
A five-block structured grid system consisting of 118206 cells was employed to discretize the geometry with boundary layer clustering around the cylindrical body. Two other grid systems with 86666 and 154546 cells, respectively, were also used to check the grid-independence of the simulation results. For water case at σ = 0.0793, the calculated C d values for the denser cell grid systems were found to differ less than only 0.1%. Therefore, the following results are all from the simulations using the grid system of 118206 cells.
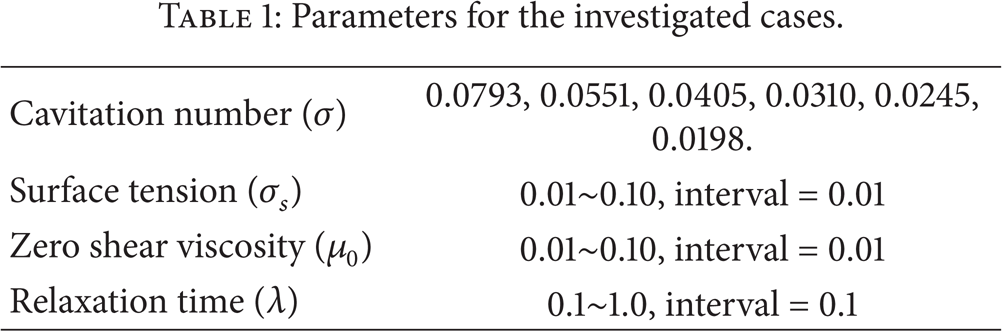
The parameters of all the investigated cases are listed in Table 1.
Parameters for the investigated cases.
3. Results and Discussion
Numerical simulations were at first performed for the water and surfactant solution (μ0 = 0.01 Pa·s, λ = 1 s, m = 0.3, and σ s = 0.036 N/m) flow cases with different cavitation numbers, respectively. In order to investigate the impact of surface tension and Cross viscosity on supercavitation, we then performed other calculation cases as follows: Case 1: σ s varies from 0.01 N/m to 0.10 N/m with an interval of 0.01 N/m; Cross viscosity is not used; Case 2: σ s = 0.0717 N/m, λ = 1 s, and m = 0.3, and μ0 changes from 0.01 to 0.10 Pa·s, with an interval of 0.01 Pa·s; Case 3: σ s = 0.0717 N/m, μ0 = 0.01 Pa·s, m = 0.3, and λ varies from 0.1 s to 1.0 s, with an interval of 0.1 s (as listed in Table 1). The results for all simulated cases are interpreted as follows.
At first, the geometries and nondimensional lengths and diameters of the cavities in water and drag-reducing solutions are compared in Figure 3. In our study, the vapor region is defined as the location where the volume fraction of vapor is larger than 0.8. Here L c = L/D n , D c = D/D n , where D n is the diameter of the cylindrical bullet; L is the length of supercavity and D is the maximum diameter of supercavity. In Figures 3(b) and 3(c), we plot the cavity lengths and diameters with the change of cavitation number (σ). It can be seen that the cavity length and diameter increase with the decrease of the cavitation number in drag-reducing solution, with the same trend as in water. But, at the same cavitation number, the cavity length and diameter in drag-reducing solution are larger than those in water (see also the cavity configurations shown in Figure 3(a)), indicating from one hand that the drag-reducing solution enhances the formation of supercavitation. The shape of natural supercavitation both in water and in solution is almost ellipsoid, which is consistent with the experimental observations.

Comparisons of supercavities in water and drag-reducing solution (μ0 = 0.01 Pa·s, λ = 1 s, m = 0.3, and σ s = 0.036 N/m) at various cavitation numbers. (a) Configurations; (b) cavity lengths; (c) cavity diameters.
Figure 4 plots drag coefficients versus cavitation number for both water and drag-reducing solution cases. The overall drag coefficient C d is composed of pressure drag coefficient C p and viscous drag coefficient C v , as defined below,

where F, F p , and F v are the overall drag force, pressure drag, and viscous resistance force, respectively.

Drag coefficients for water and drag-reducing solution cases at various cavitation numbers. (a) Overall drag coefficient; (b) pressure drag coefficient; (c) viscous drag coefficient.
It can be seen that the drag coefficients are increased monotonously with the increase of the cavitation number for both water and drag-reducing solution cases. Pressure drag coefficient, viscous drag coefficient, and the overall drag coefficient are all obviously smaller in drag-reducing solutions than those in water. From the results, we can obtain that the influence of drag-reducing additives is not only on friction drag but also on pressure drag coefficient. So, it can be conjectured that, by adding small amount of drag-reducing additives, submerged body can move faster in the drag-reducing solution than in water at the same driving power. On the other hand, it is interestingly seen from Figure 3(a) that the vapor fraction of supercavity in solution is larger than that in water. Higher vapor fraction means lower density and viscosity, which directly leads to the decrease of viscous resistance force and subsequently enhances the drag reduction.
The typical pressure contours of water and drag-reducing solution flow cases, respectively, at σ = 0.0793, are shown in Figure 5. It can be seen that the pressure distribution is almost the same before the bullet, which means that the effect of the drag-reducing additives is mainly on the downstream field of the supercavity. For these simulated cases, the region around and behind the bullet is of low pressure because of the generation of vapor. Besides, the low pressure region is obviously larger in solution than in water and the pressure recovery point in solution is behind that in water. Figure 6(a) gives the pressure distribution (CP) on the boundary of the bullet. The monitoring points are demonstrated in Figure 6(b), so the actual length of bullet is from point A to point B, represented by L0. The horizontal axis of Figure 6(a) 〈L〉 = L0/D n , which does not necessarily have physical meaning but only shows the distinction of those monitoring points designated in Figure 6(b). It is clear that the pressure on the bullet boundary is the same on most part of the bullet except for the tail corresponding to the part BC. That is because the velocity field is different just behind the bullet tail, which is shown in Figure 7.

Typical pressure distribution of water and drag-reducing solution at σ = 0.0793.

Pressure distribution on the bullet boundary at σ = 0.0793.

Distributions of streamlines in water and in solution, respectively, at σ = 0.0793.
Figure 7 compares the distributions of streamlines in water and solution flows at σ = 0.0793. The difference happens just behind the bullet tail. It can be seen that in water there exists distinct vortex structure; however, the streamline in solution is smooth and there is no vortex structure. It indicates that the addition of drag-reducing additive decreases the turbulent vortex structures. That is an important reason which contributes to drag reduction of the pressure drag coefficient as well as in solution.
The influence of liquid surface tension on the length of supercavity formed around the submerged navigator is demonstrated in Figure 8. The simulated σ s varies from 0.01 to 0.10 with an interval of 0.01, and the Cross viscosity is not used. It can be seen that as the surface tension increases the vapor region decreases in length slightly and almost keeps the same in diameter, implying that the decrease of surface tension or addition of surfactant additives into water can enhance the formation of supercavity. Surface tension arises as a result of attractive forces between molecules in a fluid. Consider an air bubble in water, for example, within the bubble; the net force on a molecule due to its neighbors is zero. At the surface, however, the net force is radially inward, and the combined effect of the radial components of force across the entire spherical surface is to make the surface contract, thereby increasing the pressure on the concave side of the surface. The surface tension is a force, acting only at the surface, which is required to maintain equilibrium in such instances. In supercavity, the surface tension acts to balance the radially inward intermolecular attractive force with the radially outward pressure gradient force across the surface. In regions where two liquids are separated, but one of them is not in the form of spherical bubbles, the surface tension acts to minimize free energy by decreasing the area of the interface. That is why decreasing the surface tension can lead to larger size of the cavity.

Cavity sizes at various surface tensions. (a) Cavity lengths; (b) cavity diameters.
The relationships between the drag coefficients and liquid surface tension are plotted in Figure 9. Figure 9(c) shows that the viscous drag coefficient increases obviously with the increase of surface tension. Meanwhile, Figure 9(b) indicates that the pressure coefficient keeps almost the same at each cavitation number. Consequently the effect of surface tension on drag is mainly to increase the viscous resistance force, leading to a light increase of the overall drag coefficient with the increase of surface tension at each cavitation number. These results indicate that the surface tension is indeed an important parameter when investigating supercavitating flow, particularly for the supercavitation influenced by turbulent drag-reducing additives.

Drag coefficients for water and drag-reducing solution cases at various surface tensions. (a) Overall drag coefficient; (b) pressure drag coefficient; (c) viscous drag coefficient.
Figure 10 illustrates the numerical simulation results of cavity length and diameter as a function of μ0 at six different cavitation numbers. For this case, σ s = 0.0717 N/m; μ0 changes from 0.01 Pa·s to 0.10 Pa·s with an interval of 0.01 Pa·s; λ = 1 s; and m = 0.3. At the six different cavitation numbers, the size of cavity increases in length and diameter with the decrease of μ0. With the decrease of cavitation number, especially at cavitation number of 0.0245 and 0.0198, the variation of cavity length and diameter is conspicuous. This indicates that when an underwater navigator moves at extremely high velocity, the influence of fluid viscosity is still remarkable. Figure 11 shows that with the increase of μ0, the drag coefficients all increase. We can also see that the variation rates of all drag coefficients are relatively larger when μ0 is lower than around 0.05. After μ0 is larger than 0.05, the variation of drag coefficients tends to become gentler.

Cavity sizes at various zero shear viscosities. (a) Cavity lengths; (b) cavity diameters.
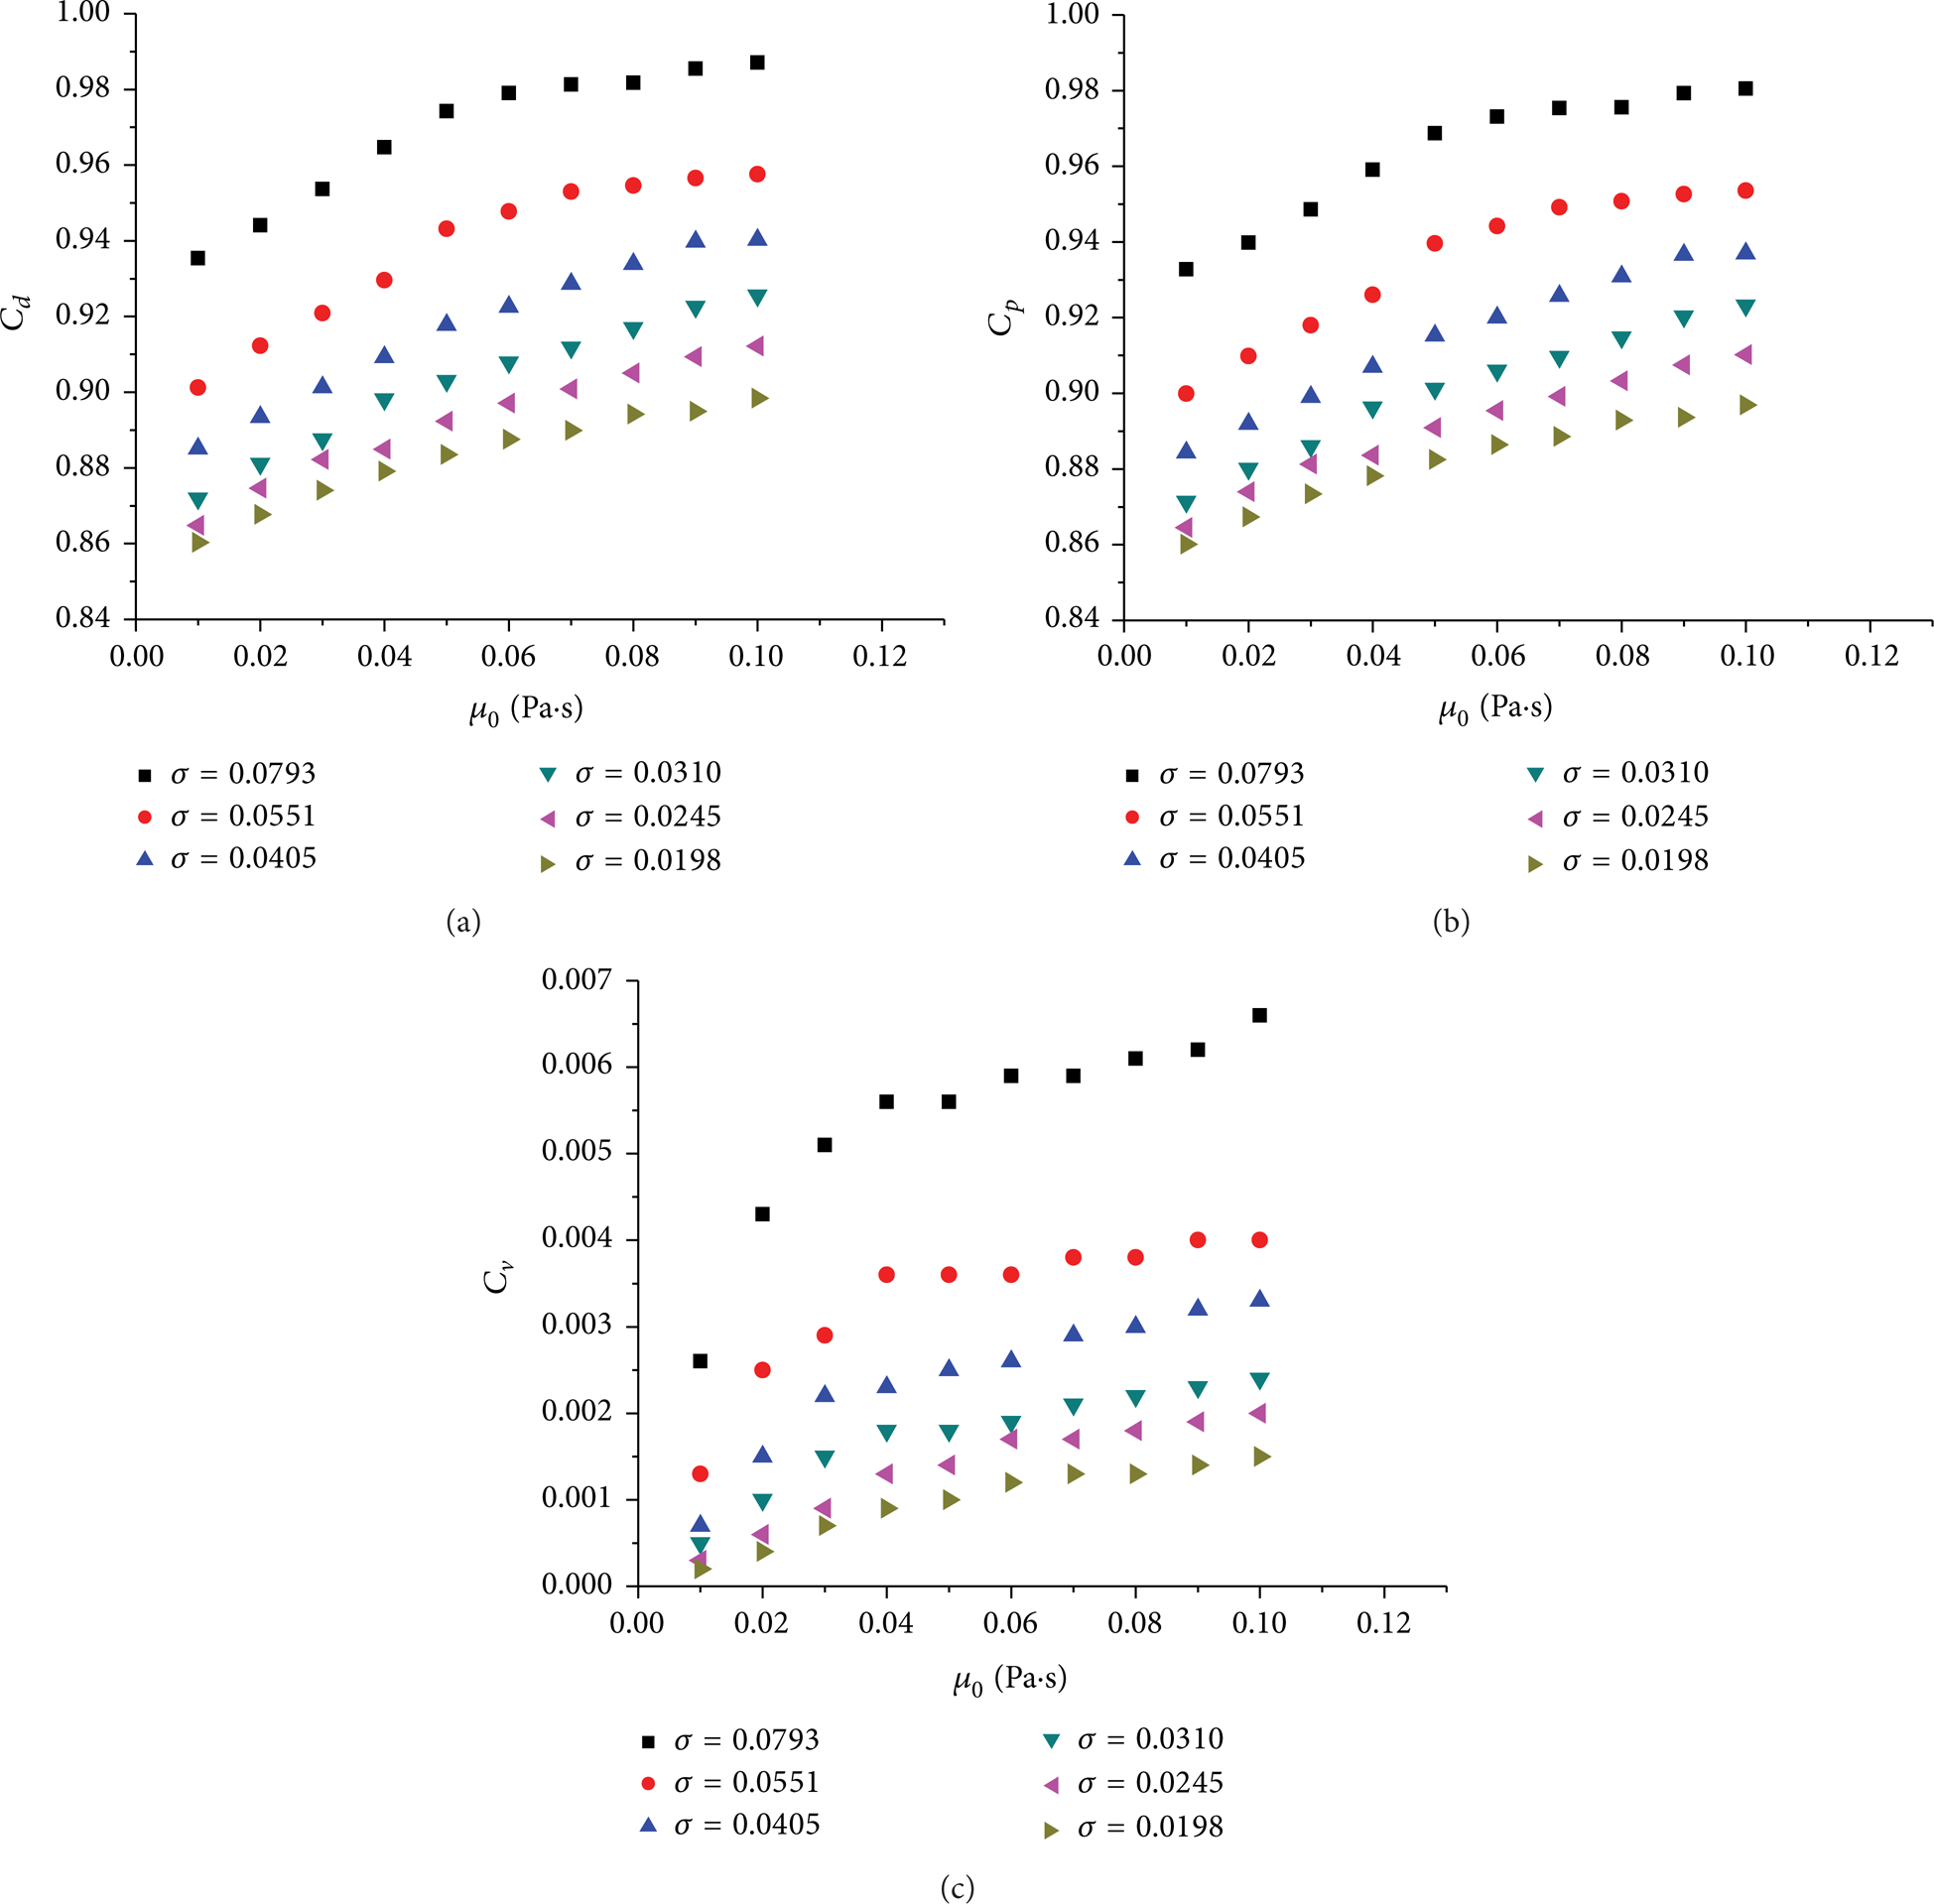
Drag coefficients for water and drag-reducing solution cases at various zero shear viscosities. (a) Overall drag coefficient; (b) pressure drag coefficient; (c) viscous drag coefficient.
Figure 12 presents the variations of cavity length and diameter with the relaxation time of the drag-reducing solution. For this case, σ s = 0.0717 N/m; λ varies from 0.1 s to 1.0 s with an interval of 0.1 s; μ0 = 0.01 Pa·s; and m = 0.3. One can see that the larger value of relaxation time is associated with the bigger values of the cavity length and diameter. And the increase of cavity length and diameter with λ becomes more and more evident when the cavitation number of supercavitation becomes smaller. Figure 13 illustrates the calculation results of drag coefficients at various relaxation times from 0.1 s to 1.0 s. It is obtained that C d , C p , and C v all decrease with increasing relaxation time, and this decreasing trend becomes gradually saturated from about λ = 0.6.

Cavity sizes at various relaxation times. (a) Cavity lengths; (b) cavity diameters.

Drag coefficients for water and drag-reducing solution cases at various relaxation times. (a) Overall drag coefficient; (b) pressure drag coefficient; (c) viscous drag coefficient.
As illustrated above, we have numerically realized that the turbulent drag-reducing additives do have evident and positive effects on the formation of natural supercavitation around an underwater navigator, resulting in further decrease of flow resistance of the navigator, as happened in our previous experiment. The three separately investigated factors in this paper, that is, surface tension σ s , zero shear viscosity μ0, and relaxation time λ, are all closely associated with the addition of turbulent drag-reducing surfactant additives into water. The addition of surfactant additives into water will decrease σ s , increase shear viscosity, and impart λ to the liquid. As shown in Figures 8, 9, 12, and 13, the decrease of liquid σ s and increase of liquid λ enlarge the supercavitation around the navigator and consequently decrease the drag coefficients at the same cavitation number. Figure 10 shows that the increase of μ0 deteriorates the formation of supercavitation. However, it is obvious that this deterioration effect is much weaker than the enhancement effect by the decrease of σ s and increase of λ, which can be seen from Figure 3: the length of supercavitation is evidently longer in the drag-reducing solution with μ0 = 0.01 Pa·s compared with that in water with viscosity s = 0.001 Pa·s. Although we investigated the influence of zero shear viscosity up to μ0 = 0.1 Pa·s, 0.01 Pa·s has been a typical order for zero shear viscosity of surfactant solution with excellent turbulent drag-reducing effect. For example, aqueous solution of CTAC/NaSal at 2 × 10⁻⁴ concentration has zero shear viscosity of about μ0 = 0.0075 Pa·s, as reported by Li et al. [23] and the solution at this concentration (and at even smaller concentration up to 2.5 × 10⁻⁵) has excellent drag-reducing ability when it flows at turbulent flow state.
Based on the above analyses, we have proposed a novel strategy for the promotion of supercavitating flow by using turbulent drag-reducing surfactant additives. Note again that, in order to achieve the promotion effect from drag-reducing additives on supercavitation, we do not need to prepare the entire liquid domain in which the underwater navigator runs to be an environment of solution but only need to make a solution environment locally surrounding the navigator, such as by injection dense solution from the running navigator itself. This has been one of our ongoing research topics. The related results will be reported later.
4. Concluding Remarks
The effect of viscoelastic aqueous solution of drag-reducing additives on supercavitation was explored using numerical simulation method. The approach developed in this study allows one to investigate the natural supercavitation influenced by turbulent drag-reducing additives. Various factors including surface tension, zero shear viscosity, and relaxation time on the formation of supercavitation are investigated. Based on the mixture multiphase flow model, the numerical simulation method is employed to model the axisymmetric natural supercavitation flow. The geometrical configuration and drag coefficients of supercavity influenced by drag-reducing solutions are numerically simulated and analyzed. It has been obtained that, apart from the commonly observed phenomenon, that is, increased supercavity length and decreased drag coefficients with decreasing cavitation number, in the drag-reducing solution with decreased surface tension and Cross model featured viscosity, the length and diameter of supercavity are further increased and drag coefficients are further decreased as compared with the case in water. It indicates an important potential in enhancement of supercavitation, drag reduction for underwater navigator, and decrease of turbulent vortex structures by using turbulent drag-reducing additives.
Conflict of Interests
The authors declare that there is no conflict of interests regarding the publication of this paper.
Footnotes
Acknowledgments
This work is supported by Foundation for Innovative Research Groups of the National Natural Science Foundation of China under Grant no. 51121004, National Natural Science Foundation of China under Grant no. 51276046, and Specialized Research Fund for the Doctoral Program of Higher Education of China under Grant no. 20112302110020.