
Abstract
Two full-scale wing boxes with different types of butt joints were investigated under pure bending load, and numerical methods, including global analysis and detailed analysis, were proposed to determine the reasons for failure of the wing boxes. Wing boxes were tested under bending loads applied by a multichannel force control system. The experimental results showed that the region of the butt joint was the weakest location of the wing boxes, and the damage loads were far less than the design load. The global analysis and detailed analysis were carried out on the wing boxes, focusing on the region of the butt joint, to determine the reasons for failure. Global analysis in explicit dynamic modulus was adopted to simulate the loading process of the two wing boxes. Meanwhile, detailed finite element models created in Patran/Nastran were used to evaluate the stability. Comparing experimental results with numerical counterparts, it is shown that the failure of the wing boxes is induced by local buckling occurring around the butt joint. In addition, the wing box that uses butt joints with lap jointed sheets is more rigid than that without lap jointed sheets, and the stress distribution is more uniform. The numerical analysis proposed by the paper can help with structure design in preliminary assessment.
1. Introduction
Airframe structures usually have load transfer paths, which consist of some simple components, including cover panels, stringers, beams, and ribs [1–3]. Cover panels bearing most of the bending load are primary load structures in the aircraft wing box, and they are not disconnected when meeting with ribs. However, during the processing of separation surfaces, cover panels have to be manufactured in pieces and joined together. The joints connecting the stringers, ribs, and beams are complex. A mechanical joint is commonly used to join all the elements together. There are many types of joints, such as a butt joint, flat lap joint, and scarfed lap joint. According to the aerodynamic shape, cover panels and ribs are always connected by butt joints [4, 5]. As the presence of holes induces stress concentrations, which can severely reduce the load resistance of jointed components, joints are potentially the weakest locations and can determine the overall structural efficiency [6, 7]. Up to now, the research has focused on the quasistatic strength [8–10] and fatigue life [11, 12] of the butt joint in cover panels but rarely on buckling analysis. In fact, because of thickness variation, local buckling always occurs in the region of the butt joint. In this paper, two full-scale wing boxes will be tested and analyzed, and the region of the butt joint is the focus.
2. Experiment
2.1. Testing Procedure
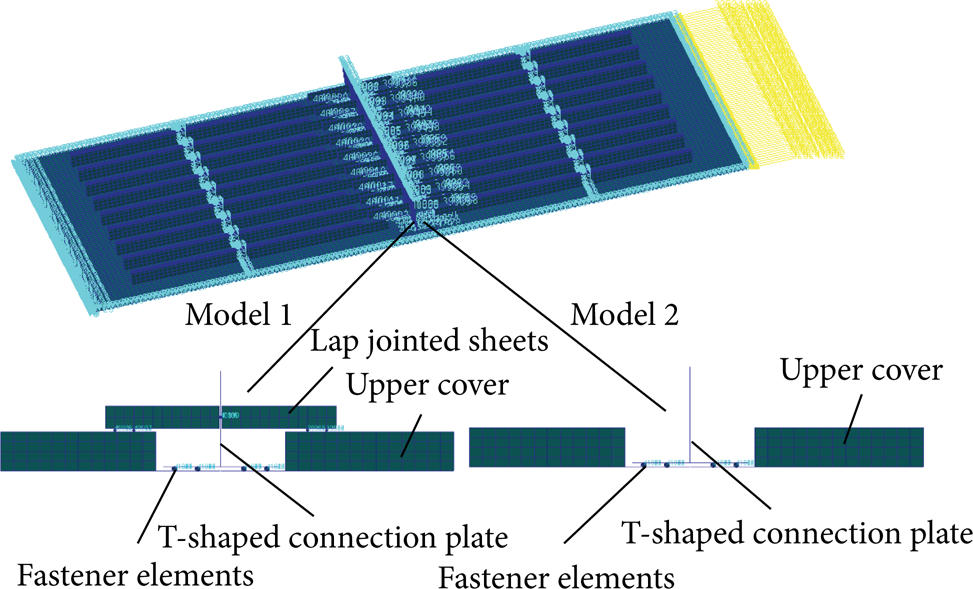
Two full-scale wing boxes of the same size were investigated. They are both 1033 mm in width and 1921 mm in length. They consist of an upper cover, lower cover, front beam, rear beam, and ribs. A schematic drawing of a wing box is shown in Figure 1. The upper cover panel includes two pieces of skin, and these pieces of skin and the main rib are joined together through a T-shaped connecting plate. The joint is complex, and the type of joint greatly influences the static strength and stability of the wing box. Thus, the types of joints need to be studied further. The two types of butt joints shown in Figure 2 were investigated by experiments and simulations in the present work. The three weakest locations are shown in Figure 2(a). The two types of joints differ from each other by the adoption of lap jointed sheets. In this paper, the wing boxes with and without lap jointed sheets are named “model 1” and “model 2,” respectively. The material used in the wing boxes is aluminum alloy 7150. Its material mechanical properties are shown in Table 1.
Material mechanical properties of alloy 7150.

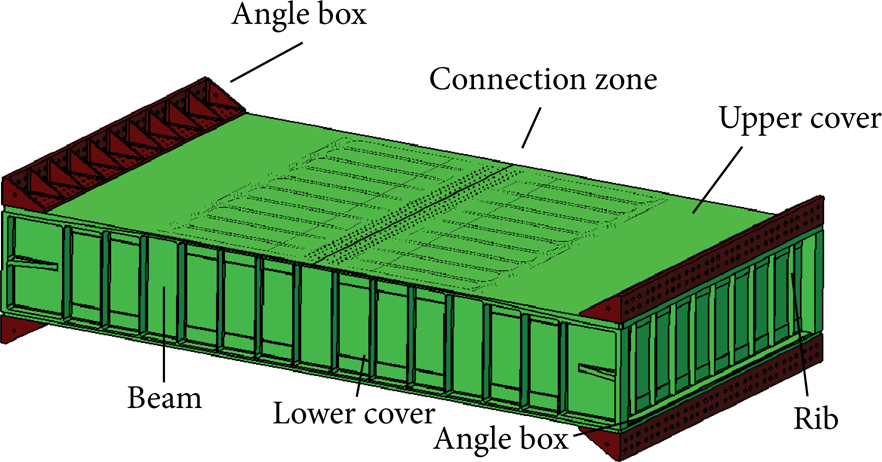
The configuration of the wing box.
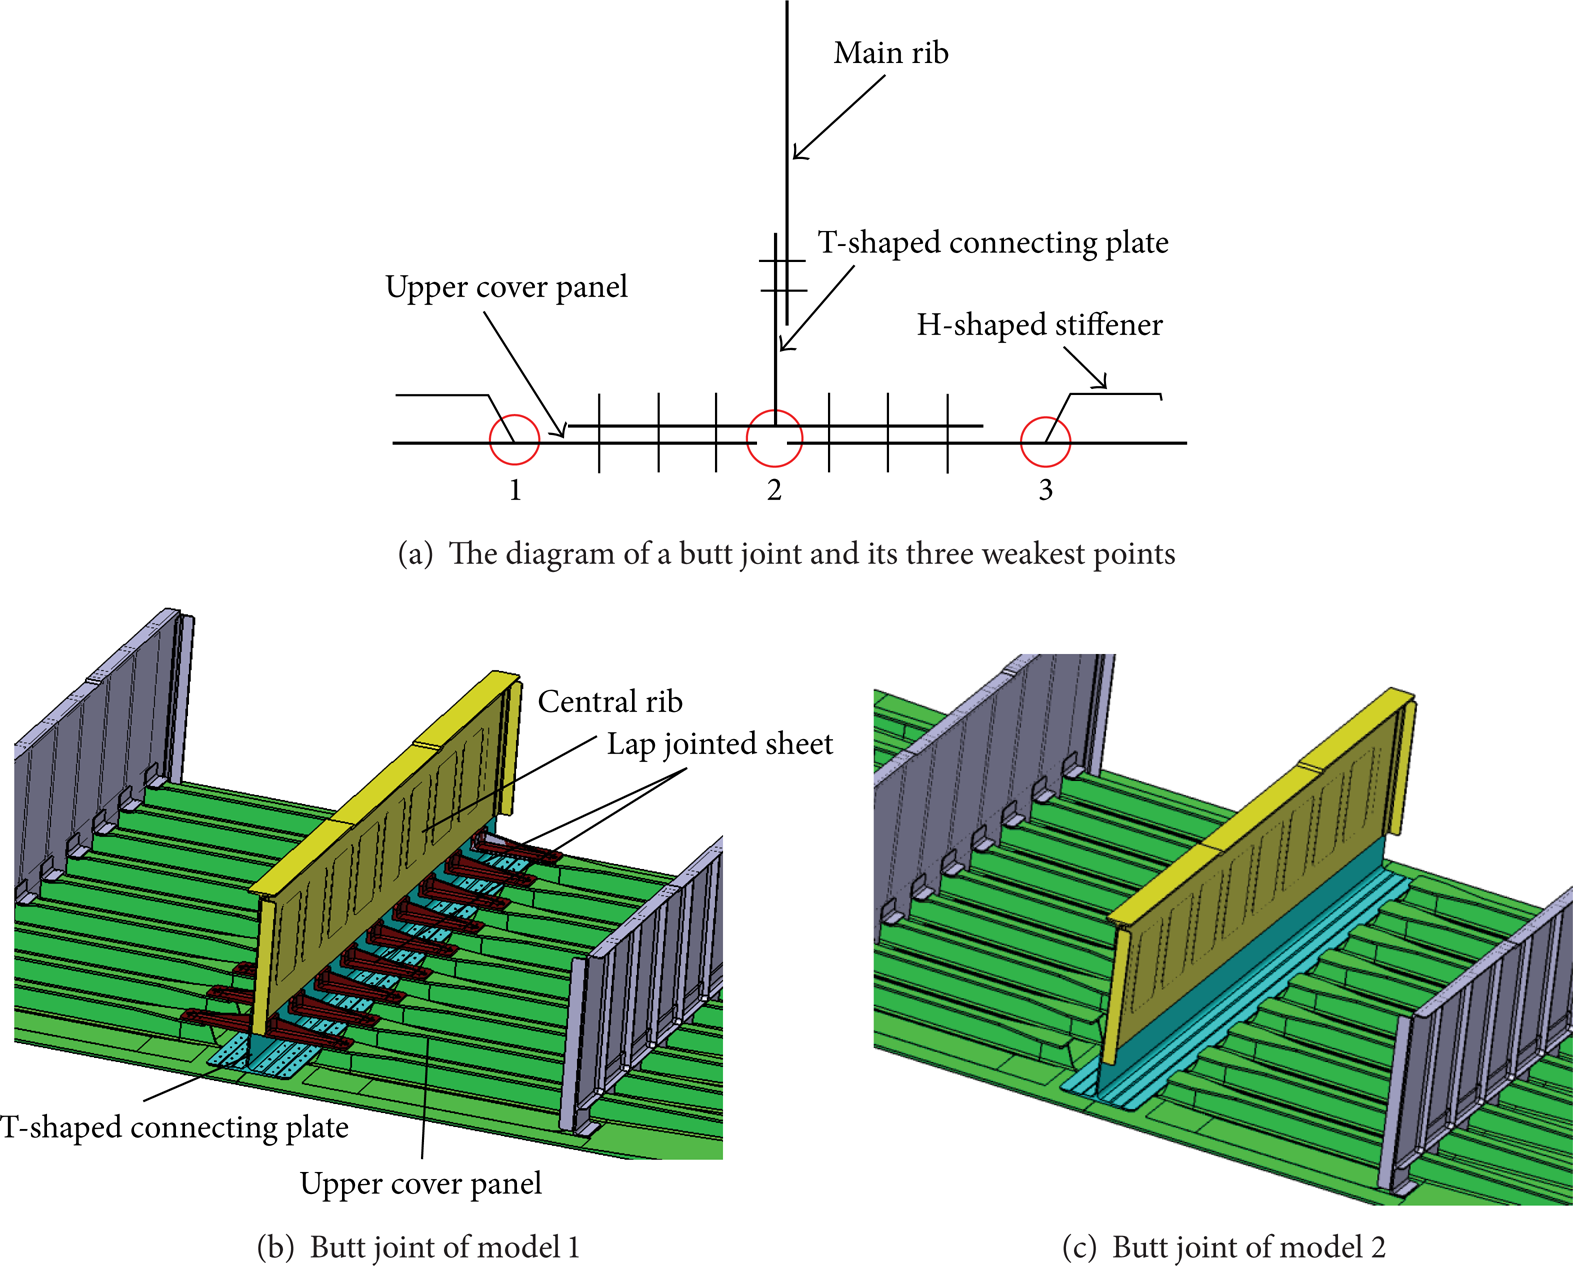
The configuration of the two joint types.
The wing boxes under pure bending load were tested in this work. The loading schematic is presented in Figure 3. The fixed ends of the wing boxes were bolted to the transition section and fixed on the reaction force wall, while loading ends were bolted to the auxiliary facility. To simulate the real applied load, the auxiliary loading made of steel was the same size as the wing box. Auxiliary facilities and wing boxes were connected by reinforced angle boxes. Sixty bolts with a diameter of 8.5 mm were set on face pairs of angle boxes. Through auxiliary facility and angle boxes, bending loads can be more evenly transferred to the wing boxes. Two loading points were located on the auxiliary facility, and the distance between them was L = 3 m. To obtain a force couple, a multichannel force control system was used. Two channels with maximum value of 1000 kN were set at loading points for applying loads. During the experiments, loads of two channels were maintained at the same magnitude but in opposite directions. Through this loading system, wing boxes were exposed to pure bending load, with the moment of M = P × L, where P was the load of each channel.

Schematic description of testing setup.
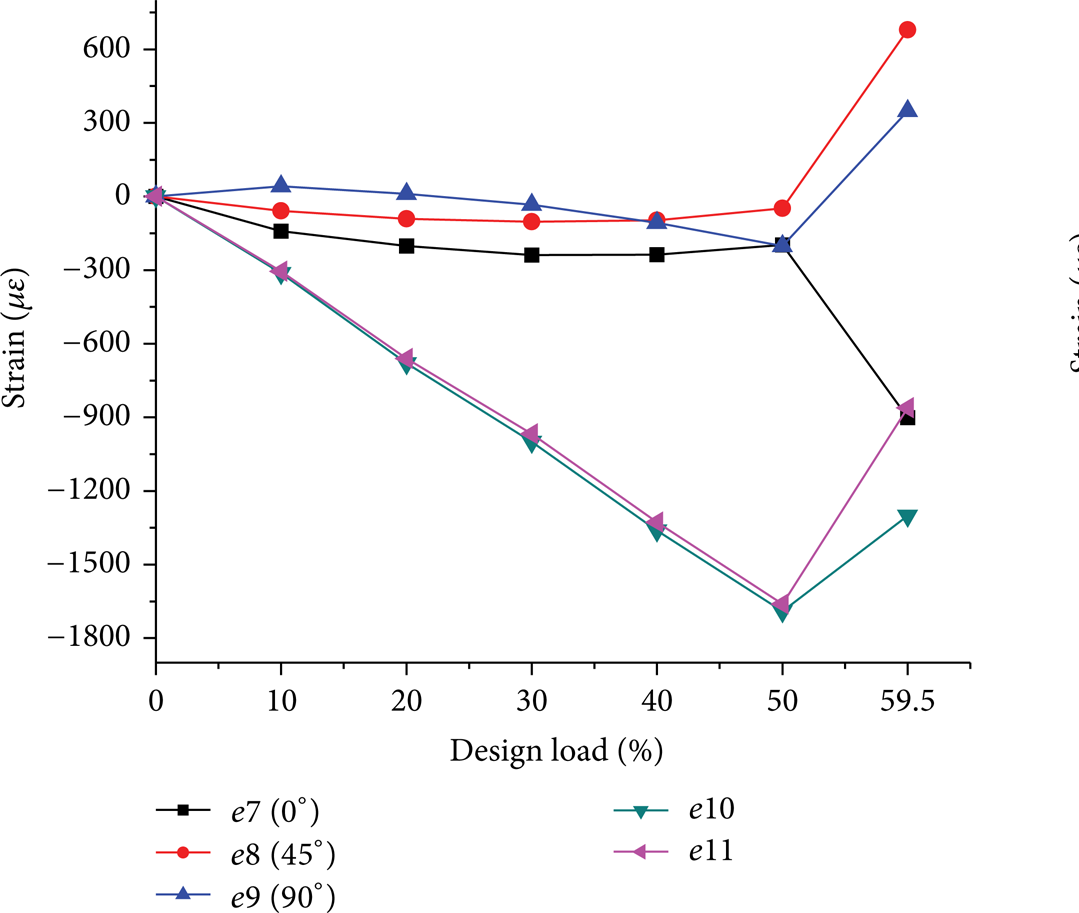
To record enough stress information, hundreds of strain gauges were mounted on the faces of the wing boxes to measure the strains at different locations. Figure 4 illustrates the placement of strain gauges at the region of the butt joint. The values of gauges 1–13 were compared between model 1 and model 2. It is noted that, for strain rosettes 1–3 and 4–6, 0° was in the Y-direction, and 90° was in the Z-direction. However, for strain rosettes 7–9, 0° was in the X-direction, and 90° was in the Z-direction. For all single gauges, the measured strains were along with X-direction.

Schematic drawing of strain gauge placements around the connection zone (∗: rosette; ∙: single gauge).
Multistage loading was used in the experiments. The design load was 1500 kN·m. The tests were started from five percent of the design load, and then, the load was increased by five percent at every step. The force couple was applied until the wing boxes ruptured. The strain and displacement values were recorded at every loading step [13]. The moment when a wing box ruptured was defined as the failure load.
2.2. Experimental Results
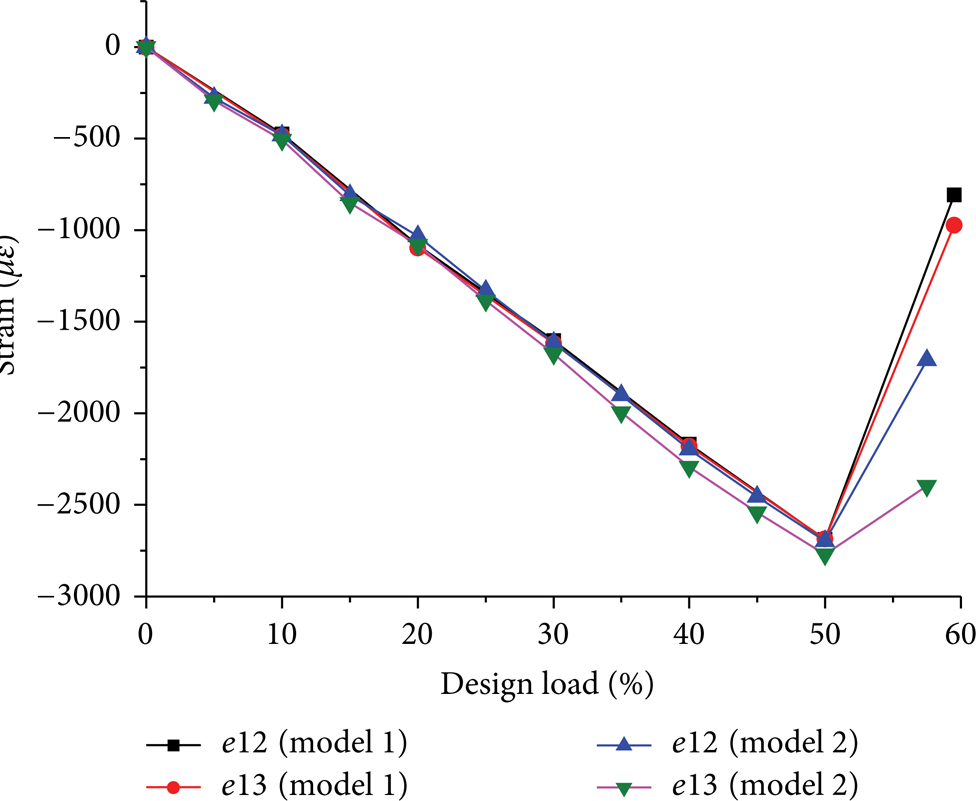
The load versus displacement curves of model 1 and model 2 are shown in Figure 5. From Figure 5, it is obvious that the failure load is 893 kN·m for model 1 and 862 kN·m for model 2. The displacements along the x-axis are the average of two channels of the loading system. Figure 5 shows that the load versus displacement curves of the two wing boxes are both linear and similar to each other. Figure 5 also shows that model 1 is more rigid than model 2. This is because the existence of lap jointed sheets increases the stiffness of the wing box. The strain versus load percent curves are presented in Figures 6, 7, and 8. The last points of strain were recorded when the wing boxes ruptured and deformation had not recovered. Some important conclusions can be drawn from Figures 6–8.
The strains on the lap jointed sheets of model 1 are approximately half of those on the upper cover panels. It appears that the lap jointed sheets play the role of load bypass, averaging the stress distribution at the region of the butt joint.
From Figure 6, it can be seen that the propagations of strain curves on the main ribs of the two models are the same. However, the strains of model 1 are much bigger than those of model 2. The reason is that part of the load is transferred to the T-shaped connecting plates by the lap jointed sheets.
As the two wing boxes are identical to each other except for the type of joint, the strains on the upper cover are the same. The type of joint has little influence on the load transformation of the whole wing box.


The failure pictures of model 1 and model 2 are shown in Figures 9(a) and 9(b). For model 1, rupture occurred at the bottom of the T-shaped connecting plate. A bulge occurred at the edge of a butt joint during loading, and the distortion recovered after unloading. From the comparison of the strains before and after the damage, it is shown that strain mutation occurred when the wing box ruptured. It is considered that the damage was induced by buckling, which took place at the butt joint region. From the failure mode in Figure 9(b), it can be seen that model 2 fails in local buckling, which occurs around the butt joint region. The cover panel varies in thickness, and the thickness is the thinnest around the butt joint region. As the structure of the butt joint is very complex, the region of the butt joint is the weakest location.

Failure modes of the wing boxes.
3. Numerical Study
The experimental result shows that the failure load is far less than the design load, and it is necessary to determine the reason for the aircraft designer. In this paper, global analysis and detailed analysis were both used for the wing boxes. The explicit dynamic analysis in ABAQUS was adopted in the global analysis, and the buckling analysis in Patran/Nastran was adopted in the detailed analysis.
3.1. Explicit Dynamic Analysis
The commercial package ABAQUS was used to develop the finite element (FE) models of wing boxes and to carry out the strength analysis. A two-dimensional (2D) quadrangle element (S4R) was used to discretize all the components of the wing boxes. The bolts that connected all the sections together were modeled as fastener elements. The FE model of model 1 is shown in Figure 10.

The beams, ribs, cover panels, lap jointed sheets, and so forth were modeled. They were joined together through fastener elements, the placements of which were determined by the installation on actual wing boxes. To prevent the contact surfaces from penetrating into each other, contact pairs were defined between the surfaces that contacted with each other. The surfaces of cover panels and beams were modeled as rigid surfaces, while the others were modeled as deformable surfaces. For the contact between the surfaces of beams and cover panels, the surfaces of beams were modeled as rigid surfaces, while cover panels were modeled as deformable surfaces.
The reaction force wall and transition section were not considered in the FE model, and the pinned supports were applied on the nodes that were at the fixed end of the wing boxes. The auxiliary box was ignored, and pure bending load was applied on the loading ends of the wing boxes.
Explicit dynamic modulus was adopted to simulate the loading process. The explicit dynamic procedure performs a large number of small time increments efficiently. An explicit central-difference time integration rule was used, and each increment was relatively inexpensive because there was no solution for a set of simultaneous equations. The explicit central-difference operator satisfies the dynamic equilibrium equations at the beginning of the increment, t; the accelerations calculated at time t are used to advance the velocity solution to time t + Δt/2 and the displacement solution to time t + Δt.
The explicit dynamic analysis procedure is based on the implementation of an explicit integration rule together with the use of lumped element mass matrices. The equations of motion for the body were integrated using the explicit central-difference integration rule:

where u
N
is the degree of freedom (a displacement or rotation component) and the subscript i refers to the increment number in an explicit dynamic step. The central-difference integration operator is explicit in the sense that the kinematic state is advanced using known values of
In the explicit dynamic analysis of ABAQUS software, total time was set at 0.008, and linear and quadratic bulk viscosity parameters were set at 0.06 and 1.2, respectively. From an explicit dynamic FE simulation, the stress, deformation contour plots, and failure load can be obtained. The curves of kinetic energy and total energy versus load are presented in Figure 11. From the curves, it can be seen that when the load reached approximately 50% of the design load, the kinetic energy and total energy diverged. Therefore, failure loads of the two wing boxes are counted as 50% of the design load. These simulated results are well matched with the experimental results.

Figure 12 gives the von Mises stresses and deformation contour plots at 50% of the design load of model 1 and model 2. From Figure 12, it can be seen that the maximum von Mises stress occurs at the bottom of the T-shaped connecting plate, which is signed by subscript “2” in Figure 2(a). The peak stress of model 1 (550 MPa) is smaller than that of model 2 (554 MPa). Therefore, the quality of model 1 is better than that of model 2. It is shown that the existence of lap joint sheets increases the stiffness of the wing box.

von Mises stress and deformation contour plots of model 1 and model 2.
From the deformation contour plots, it can be seen that, at 50% of the design load, the deformation of the upper cover panel becomes inconsistent. In the height direction, the deformation of the half cover panel is positive, and the other half is negative. The deformation shows that local buckling occurs before the load reaches 50% of the design load.
From the explicit dynamic analysis, it can be seen that the two wing boxes fail at approximately 50% of the design load, and the deformation of the upper cover panel shows that the failure modes can be attributed to local buckling. To obtain the local buckling load and buckling mode, the stability analysis is also carried out for these two wing boxes.
3.2. Stability Analysis
Through the explicit dynamic analysis and experiments, it is shown that the weakest location of the wing boxes is the region of the butt joint. Thus, the upper cover panels with butt joints are chosen for research on stability. The commercial package MSC Patran/Nastran was used to create the FE models of wing boxes and to carry out the buckling analysis [15]. The approach of buckling prediction with MD Nastran Implicit Nonlinear is based on the development of a linear perturbation of the structure's stiffness at an equilibrium solution point, which may be the initial equilibrium under no load or a preloaded state. At any time, a structure's total elastic stiffness is
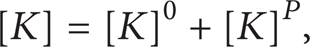
where [K]0 is the stiffness caused by the material stiffness and [K] P is the initial stress and load stiffness caused by nonzero loading. For a “stiff” elastic system, [K]0 is almost constant, and the variation of [K] P is proportional to the load variation.
During the buckling step, there may be a nonzero “dead” load, P, and there must be a linear perturbation load, Q, specified in the bifurcation buckling step. Because the response is assumed to be “stiff,” elastic, and closely proportional to the load, the stiffness at P + λQ can be a good approximation, ([K]0 + [K] P + λ[K] Q ), where [K] Q is the initial stress and load stiffness caused by Q. Thus, the buckling load estimation is provided by the eigen problem

The eigenvalue, λ, which was called the buckling load factor [15] in this paper, is a multiplier of the applied load that, when added to the preload, provides the critical buckling load. The predicted collapse load is P + λQ, and Φ is the collapse mode. If the buckling load factor λ is less than 1.0, the structure is unstable under the applied load. The bigger the buckling load factor is, the more stable the structure will be. Thus, the buckling load factor λ is the foundation to check the stability of structures [16].
The upper cover panels with butt joints were modeled in a buckling FE model, and the other components, such as beams and ribs, were simplified as constraints. The upper cover, lap jointed sheet, and T-shaped connecting plate were modeled using 2D shell elements. The FE models are shown in Figure 13, which gives the details of two types of butt joints. The bolts connecting the T-shaped connecting plate, upper cover panels, H-shaped stiffeners, and lap jointed sheets were considered in the buckling analysis model. The bolts were modeled as fastener elements (CFAST element); 248 fastener elements were used in FE model 1, and 176 were used in model 2. The thicknesses of all the components were modeled as their original sizes, and the file definitions were adopted in the components with variable thickness, for example, the upper cover, stiffeners, and so on.
Loads and boundary conditions in the FE model.
Figure 13 shows the loads and boundary conditions applied to the FE models. The stability model adopted the rigid support instead of elastic support of beams and ribs. The fixed ends were constrained in three translation directions, and the compression load P was applied to the loading ends. To simulate the support of a main rib, the displacements of nodes, at which the upper cover panels were connected with beams and ribs through bolted joints, were constrained in the through-thickness direction. Through stability analysis, the buckling eigenvalue λ was obtained. The critical buckling load of upper cover panels with butt joint components is defined as the applied compression load P multiplied by the buckling eigenvalue λ, Pcr = λP. Therefore, the critical moment of the wing boxes is defined as the critical buckling load of the calculated model Pcr multiplied by the height of the wing box h, Mcr = Pcrh, where h is 400 mm for the two wing boxes.
From the stability analysis, the buckling eigenvalues λ of two models were obtained. After transformation, the critical moment of model 1 is 749.1 kN·m, and that of model 2 is 723.1 kN·m. It appears that the load bearing capability of model 1 is larger than that of model 2. Therefore, the existence of a lap jointed sheet improves the load bearing capability of the wing box.
The buckling modes are listed in Figure 14. From Figure 14, it can be seen that local buckling occurs on the upper cover panels at the edge of the butt joints, signed by subscripts “1” and “3” in Figure 2(a). The regions where local buckling occurs are the same for models 1 and 2, which is similar to Figure 9(b). There are several reasons for this phenomenon. First, the thickness of the upper cover panels is only 6 mm, and the thickness of the lap jointed sheets ranges from 4 mm to 8 mm. The local buckling occurs because of thickness variation. Second, H-shape stiffeners end at the edge of the butt joints. Thus, the region of the butt joint is much weaker.

Buckling modes of the upper cover panel.
The experimental damage loads are 893 kN·m and 862 kN·m for model 1 and model 2, respectively. The numerical predictions are smaller than the experimental results, which can be explained by the three aspects listed below.
The approach of the buckling analysis is based on the development of a linear perturbation of the structure's stiffness about an equilibrium solution point [14]. The predictions were based on Euler linear buckling loads, but the actual wing boxes were nonlinear, especially for the structure with many bolt connections.
In the experiments, the two wing boxes were under a pure bending state, and the edges of beams and ribs were bearing part of the compression load. However, in the buckling analysis model, the effect of the edges of beams and ribs was ignored, and upper cover panels and lap jointed sheets bear all the compression load. Therefore, the predictions are slightly lower than the experimental results.
When thickness was the same, the stability of a curved shell was usually better than that of a flat plate. The upper cover panel was a curved shell when the wing boxes were under pure bending. However, the buckling analysis models remained flat under in-plane compression load, so the prediction results are smaller than the experimental results.
From the stability analysis, it is shown that local buckling occurred on the upper cover panels of model 1. The damage at the bottom of the T-shaped connecting plate was caused by the local buckling that occurred on the upper cover panels at the edge of the butt joints. When local buckling occurred on the upper cover panels, they transferred the large deformation to the lap jointed sheets. Then, the lap jointed sheets pulled the upward side of the T-shaped connecting plate. Through the joining bolts, the damage occurred because of the bending load. The lap jointed sheets changed the load transformation at the butt joint and made the failure mode different from that of the wing box without lap jointed sheets.
The results of the buckling analysis of model 2 agreed well with the experimental results. The locations where local buckling occurred were coincident with the damage area. To some extent, the failure mode of model 2 can reflect the main failure mode of model 1.
4. Conclusion
Two wing boxes under pure bending load were investigated in the present work. The difference between the two wing boxes was the types of butt joints between the upper cover panels and the T-shaped connecting plates. Experiments showed that the two wing boxes ruptured before the design load. To determine the reason, both explicit dynamic and stability analyses were carried out by FE methods. On the basis of the above findings, some useful conclusions can be drawn.
The weakest section of the wing box is the region of the butt joint, which fails in local buckling. In the design of the wing box, the butt joint should be strengthened.
Compared to model 2, model 1 has higher stiffness and a larger failure load. It can be concluded that the existence of lap jointed sheets improves the load bearing capability and stiffness of the wing box.
Global analysis in explicit dynamic modulus and detailed buckling analysis were used to determine the reasons for failure of the wing boxes. Explicit dynamic analysis was adopted to simulate the loading process of the wing boxes, and the numerical results agreed well with the experimental results. The results of the buckling analysis are on the safe side, and this simple method can be applied to structure design in preliminary assessment.
Conflict of Interests
The authors declare that there is no conflict of interests regarding the publication of this paper.
Footnotes
Acknowledgments
This study was supported by Northwestern Polytechnical University Research Fund (13GH014610, JC20120231) and National Science Fund of China (51305351) and Specialized Research Fund for the Doctoral Program of Higher Education of China (20136102120031).