
Abstract
Vibration technique provides useful information in fault detection of diesel engine, bringing significant cost benefits to diesel engine condition monitoring. Usually, time-frequency calculation on vibration signal is so complex that it is difficult to achieve online fault detection. In this paper, a method of fault detection in diesel engine is developed based on symmetrical polar coordinates and image recognition. In this method, time-domain waveform of vibration signal is transformed into snowflake-shaped in mirror symmetry pattern without time-frequency analysis. By the comparison of the geometric features of the snowflake images from different wear conditions of crankshaft bearing in diesel engines, we use centroid position and direction angle of the petal in snowflake image as features to detect the fault. Then, fuzzy c-means (FCM) are used to detect the conditions of the engine according to these features. In order to validate the methods, some experiments have been performed, the experimental results show that the centroid position and direction angle of the petal in snowflake image can reflect the information of different wear conditions in crankshaft bearing, and the fault of crankshaft bearing can be detected accurately. Hence, the method can work as fault detection in diesel engine, which is simple and effective, compared with time-frequency calculation method.
1. Introduction
In a diesel engine fault detection, vibration analysis method is one of the main diagnostic tools, along with the development of modern signal processing technology, a variety of time-frequency analysis methods, such as short-time Fourier analysis, frequency analysis, Wigner-Ville, higher-order spectral analysis, Hilbert-Huang Transform, and other methods are gradually adopted to the analysis of the vibration signal processing [1–4]. In recent years, many researchers utilized image processing technology into the field of diesel engine mechanical fault detection. In articles [5–7], wavelet, EMD-WVD, and other methods were used to get the time-frequency distribution, and then the spectrum images of vibration signals were used in feature extraction, classification, and recognition. The basic idea is vibration signals–time frequency analysis–image generation–image feature extraction–image classification [2, 8, 9]. However, these time-frequency analysis methods are complex and time-consuming; a clear beacon signal was needed in order to ensure comparability of time-frequency image. Hence, these time-frequency analysis methods may not work well for online troubleshooting.
In this paper, we present a novel analysis method for fault detection in diesel engine in which the sampled signals are converted into mirror symmetry image in symmetrical polar coordinate system. Then, the image recognition is used for an analysis. In the method, the sampling signals are directly converted into image from the time domain without time-frequency transform; hence, the method is simple and effective. A type of diesel engine crankshaft bearing wear fault is taken as an example. The vibration signal is studied in polar coordinates and converted to images. Then, the geometrical configuration features of the signal images are extracted. Finally, FCM clustering method is used to recognize different faults in the engine's crankshaft bearing. Some experiments are performed to validate the analysis results.
2. The Basic Principle of Symmetry Polar Coordinate Method and Image Recognition
In polar symmetrical image generation method, the time-domain waveform signal will be collected, and each signal point will be mapped to polar radius in polar coordinates, and then the adjacent points will be mapped to the polar angle. Finally, hexagonal flakes mirror symmetry graphics are produced in polar coordinates [10]. Changes in amplitude and frequency of the sampled signal can be expressed by the difference of the image. In this approach, the time-domain signal can be processed without frequency analysis; hence, it is simple, convenient, and fast.
2.1. Polar Symmetry Method
In discrete signal sample data sequence, we assume that the amplitude of the time i was x i and the amplitude of the time i + L was xi + L. Substituting symmetrical polar coordinates calculated in formula (1), they can be transformed to points in polar coordinate space P(r(i), Θ(i), ϕ(i)). Figure 1 shows the basic schematic symmetry polar coordinates method.

Schematic diagram of symmetrical polar coordinates method.
In Figure 1, r(i) is the radius of polar coordinates, Θ(i) is the counterclockwise rotation angle from the start line in polar coordinates, and ϕ(i) is the clockwise rotation angle from the start line in polar coordinates. By changing the rotation angle of the start line, a set of signals (x i , x(i + L)) can be transformed to mirror-image symmetry in polar coordinates. The specific formula is as follows:

where xmax is the maximum of the sample data, x min is the minimum of the sample data, L is the time interval (typically ranging between 1 and 10), θ is the rotation angle of start line, and g is the amplification factor of angle.
From these formulas and symmetry principle, we can find that the midpoint location of polar coordinate space P is the key method of symmetrical polar coordinates, and the position of each point is determined by two time intervals for the time-domain signal amplitude of L. If a given signal is predominant by middle and low frequency component, there will be a smaller radius and larger deflection angle in the polar coordinate space, and vice versa.
To illustrate the characteristics of symmetrical polar coordinate method, where L is 5, g is 40°, and θ is 60°, it shows that the three different frequencies, sinusoidal signals, and a random noise signal simulation are transformed to mirror symmetry snowflakes images in symmetrical polar coordinates according to this method in Figure 2. As apparent sinusoidal signal frequency increases, gradually petals will be full of snowflakes images and increase the overlap portion. These features reflect the changes in visual image of the original signal. Comparing the snowflakes images of sinusoidal signals and random noise signal, the difference between the periodic signal and nonlinear signal can be distinguished by the characteristics of the image.

Mirror symmetry snowflakes images of simulated signal ((a) f = 200 Hz, (b) f = 400 Hz, (c) f = 600 Hz, and (d) random noise).
2.2. Parameters Selection of Symmetrical Polar Coordinates Method
In the polar coordinate space P, the choice of θ, g, and L is very important. The choice of parameters decides the mirror symmetry snowflake polar coordinates map feature, where θ is the same as the mirror symmetry plane rotation angle. Its mirror symmetry planes are 0°, 60°, 120°, 180°, 240°, and 300°. In polar coordinates, the six-mirror plane form a hexagonal of snowflake image. Large θ will result in the number of polar coordinates mirror symmetry decrease, and the amount of information about graphical visualization will be reduced. Small θ will result in mirror symmetry overlap increase; the characteristics of the image are hard to be found. When θ is 60°, the signal characterization is clear and it is easy to observe the feature. Therefore, we choose θ = 60°.
When θ is determined, the nuances of the different signals generated images depend mainly on g and L. The optimum values of g and L can improve the image resolution and amplify the difference of signals [11]. Figure 3 shows the effects on generating images of different g and L. With L ranging from 1 to 10, the petals of symmetrical snowflakes image is more plump. With the increasing value of g, the angle of centroid to the horizontal axis becomes larger in the petals of symmetrical snowflakes image. Because the resulting mirror symmetry snowflakes image is created by rotating θ and overlapping of each petal, too large or small values of g and L will affect the image of each petal overlapping portion symmetrically and produce a nonsignificant difference of the original signal feature information. Therefore, the optimum range of g is 20°∼60° and the optimum range of L is 3∼10.

Different image with different g and L.
2.3. Mirror Symmetry Image Feature Extraction and Noise Reduction Processing
2.3.1. The Mirror Symmetry Image Feature Extraction
Currently, the characteristic parameters for image pattern recognition can be summarized as follows: (1) statistical characteristics of color or grayscale, (2) texture and edge features, (3) geometric characteristics of the shape, and (4) characteristics of transform coefficients or filter coefficient characteristics [12]. Typically, the use of the feature extraction method is determined by the characteristics of the image. Due to the characteristic mirror symmetry snowflakes graph generation method, after generating a set of petals, six-rotating-mirror plane hexagonal shape is formed by superimposing images of snowflakes. Therefore, different shapes in the snowflakes image will be generated from different signal. So, we choose the geometry parameters extraction method based on image characteristics.
There are a lot of features of image geometry parameters, such as regional area, the boundary region, the long axis and short axis of the ellipse with the same second-order central moments to the region, area centroid, and direction angle. In this paper, the area centroid and direction angle are used as the characteristic parameter.
(1) Area Centroid. It is a feature of shape, and it can be calculated from the coordinates of all points belonging to the region. It is calculated as follows:

where x, y are the abscissa and ordinate of the point within the region and A is the area of the region, the same as the number of pixels in the region.
(2) Direction Angle. It is the region with the same angle of the second central moment of the long axis of the ellipse and the horizontal line. It is a feature parameter of shape.
2.3.2. Image Noise Reduction Based on Mathematical Morphology Open Operation
Mathematical morphology is a new method in the field of image processing and pattern recognition; the basic idea is to use a certain form of structural elements to measure and extract the corresponding shape of image and then achieve the purpose of image analysis and recognition. Due to the high speed operation and ease of implementing morphological opening operation, it is the most widely used method of mathematical morphology noise. The principle is as follows.
A is assumed as a set, B is the structuring element, and the opening operation of A by using B is defined as follows:
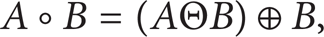
where AΘB is A corrosion by using B as a structural element and A⊕B is A expansion using B as a structural element. Figure 4(a) shows a binary image.
Noise reducing of opening operation ((a) original image, (b) structural element, and (c) image after opening operation).
Figure 4(a) shows a binary image, Figure 4(b) shows a structural element, and Figure 4(c) shows the result of the binary image's opening operation using (b) as a structural element. The results show that the opening operation can eliminate a small area of the object, separate the slim point of the object, and smooth large object boundaries with not significant change of its area.
3. Feature Extraction of Crankshaft Bearing Wear in Diesel Engine
3.1. Vibration Signal Acquisition in Diesel Engine
In this paper, Cummins 6BT5.9 diesel engine was used. The fourth crankshaft bearing was selected as the trial bearing, and four kinds of fit clearance were set to simulate the wear conditions. According to the wear patterns and troubleshooting experience, the wear of adjacent crankshaft bearing will occur when local crankshaft bearing wear occurring. Hence, when a wear fault was set in the fourth channel of the crankshaft bearing, generally a less fault should be set in the neighbor channel. Table 1 shows the fit clearance in the fourth channel and adjacent bearing crankshaft bearings, respectively.
Different fit clearance of diesel engine crankshaft bearing.

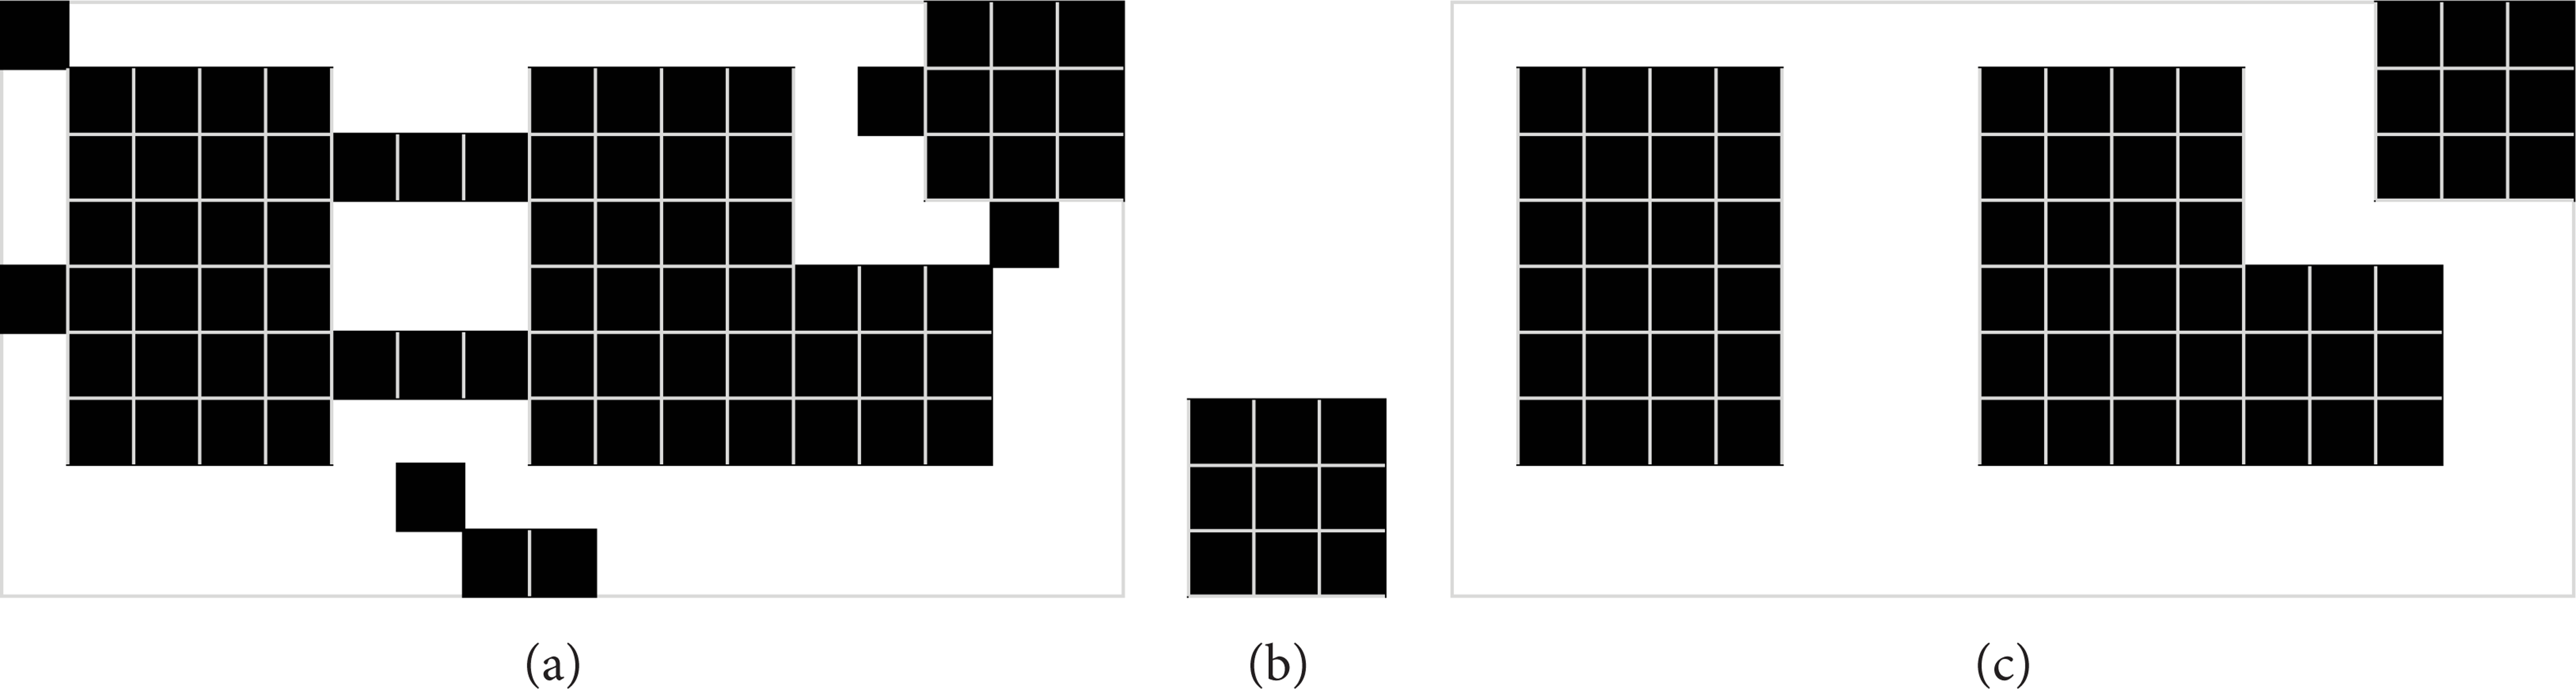
Vibration signals of four kinds of engine states were captured in point A of Figure 5, the measurement speed was 1800 r/min, the sampling frequency was 20000 Hz, and the sampling data length was 80000 points every time. The body temperature was maintained at 60–70°C with the test signal acquisition and monitoring engine oil pressure. Figure 6 shows, respectively, the vibration time-domain waveform of the fourth channel in normal, slight, moderate, and severe state from point
Testing point location map.

Vibration signals of 4 states ((a) normal, (b) slight, (c) moderate, and (d) severe).
3.2. Symmetrical Mirror Image Generation of the Vibration Signal
3.2.1. Vibration Signal Preprocessing
Diesel engine is a complex mechanical system; its vibration signals are typical of nonstationary signals with noise. Therefore, it is necessary to denoise the vibration signal before transformed to image.
Currently, there are a lot of noise reduction methods for vibration signal. In this paper, EMD is used to reduce noise, and the main idea is as follows [13].
The signal S(t) is decomposed using EMD, and then N IMF components (P i , i = 0, 1, 2,…, N) are obtained.
The correlation coefficients (γ(i), i = 0, 1, 2,…, N) are calculated between S(t) and IMF components P i .
The correlation coefficients (λ(i), i = 0, 1, 2,…, N) are calculated between the signal under normal conditions Snor(t) and IMF components P i .
The joint correlation coefficients (ϕ(i), i = 0, 1, 2,…, N) are calculated according to γ(i) and λ(i). (ϕ(i) = γ(i) − λ(i)).
The correlation coefficient factors (β(i), i = 0, 1, 2,…, N) are calculated. Consider β(i) = (ϕ(i) − min(ϕ))/(max(ϕ) − min(ϕ)), where ϕ = {ϕ i }, i = 0, 1, 2,…, N.
The correlation coefficient factors β(i) are sorted by descending, the IMF components corresponding to the first 5 β(i) are added up to as the signal, and other IMF components will be deleted as noise.
3.2.2. The Parameter Selection of Symmetrical Polar Coordinate Method
In order to characterize accurately engine's vibration signal by using mirror symmetry snowflakes image, it is necessary to determine L and g in the symmetry polar coordinate method. In this paper, the optimum seeking method is based on image correlation; this means that L changes as a step of 1 from 1 to 10 and g as a step of 10° from 20° to 60°, then the values of L and g are fixed, respectively, and the correlations of normal and abnormal wear condition are analyzed in snowflake image. Because we focus on the distinction of normal and abnormal conditions, the summary of correlation coefficients of the images of normal and abnormal conditions is used as optimum seeking parameter. The L and g corresponding to the minimum correlation coefficient between the normal and abnormal conditions are selected. Quantitative analysis using the correlation coefficient between images is calculated as follows:

In formula (4), A and B are two-dimensional matrixes in images and

Mirror symmetry snowflake images under different fit clearance ((a) normal, (b) slight, (c) moderate, and (d) severe).
3.3. Feature Extraction Based on the Shape of the Image
According to the characteristics of a mirror symmetry snowflake image, the two former petals from 0° to 360° in the first quadrant can represent the characteristics of the whole piece snowflake image, so we can extract the features from these petals.
Firstly, the two petals are segmented from the first quadrant of the images with different conditions; they are shown in Figure 8. Secondly, the centroid position and direction angle are calculated from the upper and lower petals, respectively. In Figure 8(a), A is the centroid of the upper petal, B is the centroid of the lower petal, and u and v are the direction angles of the petals. The calculated features from different wear conditions are shown in Table 2.
The features from different wear fit clearance.


The petals from different wear fit clearance ((a) normal, (b) slight, (c) moderate, and (d) severe).
It can be observed from Table 2 that there are some obvious differences in the features of each petal image. In the upper petal image, there are some characteristics as follows: the position of centroid from normal wear petal image is in the bottom left and that from slight and severe wear petal image is in the right. The direction angle from normal wear petal image is about 50° and that from moderate wear petal image is about 45–46°, and it is about 40° in slight and severe conditions. In the lower petal image, there are some characteristics as follows: the position of centroid from normal wear petal image is downward, and there is not much difference in that of slight, moderate and severe. The direction angle from normal wear petal image is about 10° and that from moderate wear petal image is about 13°, and it is about 20° in slight and severe conditions. As the process of crankshaft bearing wear is gradual, the variation of features from different conditions is fuzzy and it is difficult to distinguish directly the conditions from the features; hence, we use fuzzy clustering method to solve this problem.
4. Pattern Recognition Based on FCM Clustering
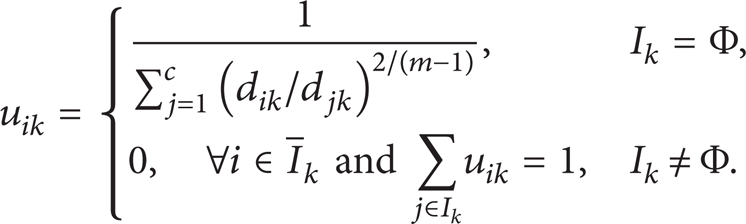
Cluster analysis is a mathematical method, which works based on the similarity and classification process as follows [13, 14]. For the sample data set X = {x1, x2,…x k ,…, x n }, if you want to separate the sample into c (1 < c < n) class, the membership belongs to the ith class of the arbitrary sample x k which is defined as u ik :

In order to find a reasonable classification result in a large number of possible classifications, a reasonable similarity or dissimilarity clustering criteria must be determined; the objective function is shown as the following formula:

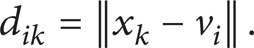
In formula (6), U = [u ik ] is the fuzzy classification matrix, V = {v1, v2,…, v c } is a set of c cluster centers, m is weighted exponent, d ik is distance from the kth sample to the ith class, and it is generally calculated by the Euclidean norm, defined as follows:
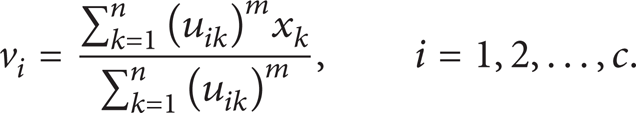
Obviously, J(U, V) denotes the sum of the weighted distance from the sample to the cluster center in every class, and the clustering criteria are taken as the minimum requirements of J(U, V). When J(U, V) becomes the minimum, the membership matrix and fuzzy cluster center should be calculated as follows.
For membership matrix, considering that d
ik
may be 0, two cases are discussed. We define the set I
k
= {i ∣ 1 ≤ i ≤ c, d
ik
= 0} and
Similarly, J(U, V) is obtained as the minimum and v i should be calculated as follows:
In this paper, FCM is performed to classify the features relative with the wear conditions. The calculated procedure is as follows.
Step 1. The cluster center V(0) is initialized; let l = 0; and the maximum permissible error ε (ε > 0) is determined.
Step 2. The membership matrix U(k) is calculated according to formulas (10) and (11).
If

If

Step 3. The cluster center V(l + 1) is calculated according to the following formula:

Step 4. While ∥V(l + 1) − V(l)∥ < ε, classification will be finished, and the iteration will be aborted. Otherwise, let l = l + 1, and repeat Step 2.
5. Experimental Validations
The features (x A , y A , u,x B , y B , v) of the mirror snowflake Image are used as the input parameters of FCM. Because the set of sample classification is {normal, slight, moderate, severe}, the number of clusters is set as 4. The stop condition of iteration is ε = 10−5. The feature parameter matrix is calculated using FCM. After 11 iterations, the value of the objective function is 0.5270, and the known fault samples membership matrix U is

The cluster center V is

The cluster centers can be available as standard crankshaft bearing fault modes. In V, the first, second, third, and fourth line are the normal, slight, moderate, and severe wear cluster center of sample data, respectively. In order to validate this method, we collected vibration signals of four sets of diesel engine with the same type, and the six features were calculated in the images transformed from signals. After standardization, the approach degrees of every line in the standard model V were calculated, and the classes of diagnosed objects were determined according to the maximum value of the approach degrees. Parts of the results are shown in Table 3. Bold part of Table 3 is the maximum approach degree of sample data.
Parts of classification results of sample data.

In order to observe the effectiveness of this method, we used wavelet decomposition to extract features of the signals. The vibration signals were decomposed by wavelet in 4 layers resolution, and then the wavelet coefficients S1, S2, S3, S4, and S5 from low to high frequency were obtained. Based on these coefficients, the frequency band energy was calculated. After standardization, we obtained the features E1, E2, E3, E4, and E5. Parts of the features from wavelet decomposition are shown in Table 4. Using these features as the input parameters of FCM method, the samples can be classified.
Parts of features from wavelet decomposition.

Through statistics in 200 test samples, the classification accuracy was 86% in our method but was 77% in wavelet decomposition and that demonstrated the good effectiveness of this method.
6. Conclusions
A method of fault detection in diesel engine has been presented, based on symmetrical polar coordinates and image recognition. A type of diesel engine crankshaft bearing wear fault has been taken as an example to explore the method. By this method, vibration signal of diesel engine can be transformed to mirror symmetry snowflake image by symmetrical polar coordinate method without frequency transform. The extracted features from the image include the position of centroid and direction angle can reflect the different wear conditions of the crankshaft bearings. Although the boundaries of normal, mild, and severe wear in crankshaft bearing are fuzzy, FCM clustering can be used to recognize the images from the features. The experimental results show that the method can work well for the fault detection in diesel engine. And the method is simple and effective.
Conflict of Interests
The authors declare that there is no conflict of interests regarding the publication of this paper.
Footnotes
Acknowledgment
This work was funded by the National Natural Science Foundation of China (no. 60674111). These supports are gratefully acknowledged. The authors would like to thank Dr. Guofang Fan for sharing his valuable insights.