
Abstract
The fingerprint positioning based on received signal strength has a widespread development in many applications since the technology does not depend on additional hardware deployment. However, the site survey process which is executed before fingerprint positioning is time consuming and labor intensive. Sampling cell size directly affects the localization precision and the survey workload. We propose a sampling cell size optimization method to release the survey workload while holding the precision. We adopted the Gaussian process model to estimate the received signal strength based on some samples and used the inherent maximum Euclidean error of fingerprint vectors to compute the optimal cell size. We conduct some experiments to validate the efficiency of the mechanism. And the results show that our method can largely reduce the workload of the site survey process.
1. Introduction
Indoor positioning is a critical enabler for location based services and applications. In many scenarios (e.g., shopping malls, supermarkets, and airport terminals), the location can provide the shopping guide, commodity promotion, and path navigation. Since the GPS technology is not available in the building, various wireless signal technologies (e.g., Zigbee, RFID, Bluetooth, UWB, and WiFi) have been applied to indoor positioning. However, accuracy and the overhead limit the feasibility of indoor localization system. Various positioning systems can achieve a high accuracy at a cost of additional hardware. For example, the systems based on the time of arrival (ToA) measurement need accurate time synchronization or specific hardware to compute the arriving time.
The fingerprint positioning is a promising indoor localization method which requires no additional hardware. Therefore, fingerprint positioning has been widely applied in many applications [1–3]. However, fingerprint positioning needs an additional site survey process to record the RSS fingerprints at every point of the interested area to build the fingerprints database. Meanwhile, sampling cell size (i.e., cell area) also needs to be defined before the site survey. This process is time consuming and labor intensive. Furthermore, the fingerprint database needs to be updated with the changing of environments. Much research has focused on avoiding the tedious presurvey. In some work, the crowdsourcing method is adopted to assemble the fingerprint information from masses of location based services’ users [4, 5]. This can reduce the individual labor through many people's cooperation. But the sampling cell size still needs to be determined.
Larger sampling cell size implies the fewer survey workload but the lower positioning accuracy. Thus, we need to find the optimal sampling cell size to achieve a balance between the survey workload and positioning accuracy. The traditional methods adopt the default empirical values (e.g., 1 m × 1 m or 2 m × 2 m) [6, 7] or the users’ stride in the crowdsourcing. In this paper, we adopted the Gaussian process model to estimate the received signal strength based on some samples. Then we used the inherent maximum Euclidean error of fingerprint vectors to compute the optimal cell size. The experimental results show the availability of Gaussian processes and the efficiency of optimal cell size.
2. Performance Analysis of Different Sampling Cell Sizes
During the fingerprint positioning, the interested area is first divided into some equal cells, where the RSSs from WiFi access points (APs) are sampled to construct the fingerprint database. Cell size affects the fingerprint database scale and localization performance. To study the impact of the sampling cell size on the localization performance, we conducted three experiments where the cell sizes are set to 1 m × 1 m, 2 m × 2 m, and 3 m × 3 m, respectively, in a 30 m × 24 m office room with 8 deployed APs. Obviously, the workload is increased as the cell size decreases.
2.1. Methodology
After dividing the interested area into small cells, we need to sample the RSSs of APs in each cell. Assume the WiFi fingerprint RSS values at location

where the
In the localization process, the K-nearest neighbors (KNN) are selected to estimate the user's location; for example, the centroid of the K-nearest neighbors is regarded as the user's current location. In the above three experiments, we adopt the KNN method.
In various positioning applications, the mobile phone has grown up to be a primary localization facility. We use GS1011 WiFi module from American Gainspan company as the test platform. This is because GS1011 module has a low-power property which can support a long time test. Additionally, to avoid the existing obstacles such as the office tables and chairs in the test room, we just experimented in the corridor cells to sample the fingerprints. According to the above dividing results, 120, 60, and 40 sampling sites are generated, respectively. After creating the fingerprint database, we select 60 random locations to evaluate the localization performance, where some locations may be far away from the sampling sites. As shown in Figure 1, we can find the 2 m × 2 m scenario has the comparable localization accuracy with 1 m × 1 m's. But when the sampling cell size is 3 m × 3 m, the localization performance declines dramatically. In other words, the localization accuracy has not always been improved with subdividing of sampling cell.

The localization performance of three tests.
2.2. Root Cause Analysis
To pursue the cause of above experimental results, we designed another test for WiFi signal attenuation with 4 m, 8 m, and 12 m distance away from APs. In Figure 2, the received signal strength is reducing with the distance increasing, while the signal variation is augmenting as well. This indicates the RSSs measured in the same sampling cell have a certain error. This is because complex indoor environment will bring about shadowing and multipath of radio signals. Therefore, during the KNN matching, the Euclidean distance between fingerprint vectors has some fluctuation due to the existing of RSS measurement errors. Smaller sampling cell size will lead to more influence from the Euclidean distance fluctuation. Therefore, we have to find the balance between the RSS measurement error and the sampling cell size.
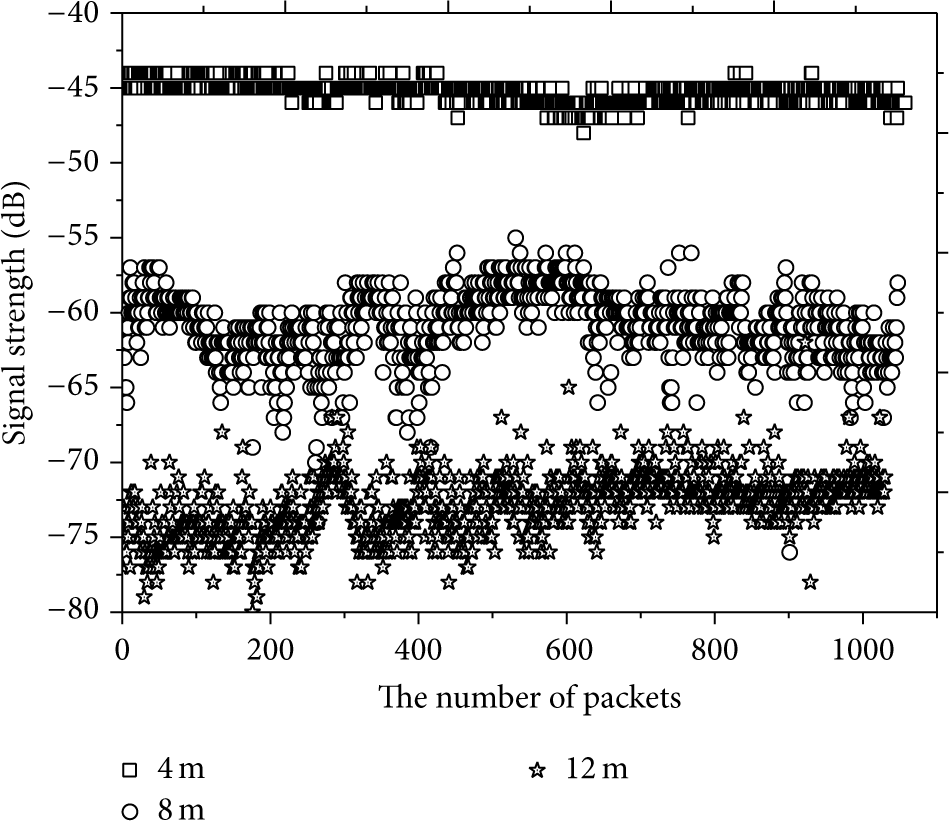
The signal strength changes with distance.
3. Sampling Cell Size Optimization
In order to find the balance between the RSS measurement error and the sampling cell size, we defined the Euclidean distance of fingerprint vectors between sampling cells as fingerprint granularity. The fingerprint granularity represents the fuzzy degree of two sampling fingerprints. The bigger fuzzy degree indicates a higher similarity of the fingerprints. Meanwhile, the RSS measurement error also affects the fingerprint Euclidean distance. For example, supposing the RSS measurement error follows normal distributions with zero mean and ɛ error variance, then the fingerprints in the same sampling cell have an inherent maximum Euclidean error as follows:

where m represents the number of APs. In addition, according to the results in Figure 2, the value of ɛ will be changing with the distance away from APs. When the fuzzy degree of any two adjacent sampling cell fingerprints is over the maximum Euclidean error
However, we can not compute the fingerprint granularity between any two adjacent sampling cells before the site survey. Meanwhile, the survey of an interesting area first needs to divide the area into the same cells. So the sampling cell size needs to be obtained in advance. This becomes a classic chicken-and-egg problem. To solve this difficulty, the existing techniques mostly assume knowledge of the APs locations and then adopt the signal propagation model to estimate each cell signal strength based on the distance from the APs [8, 9]. But the estimated value has lots of inaccuracy due to the ambient interferences. In this paper, we introduce the Gaussian processes (GPs) for modeling signal strength measurements to address these limitations. Based on fewer precalibration data, we can use Gaussian processes to generate a fingerprint database corresponding to all cells. In the following, we will show how Gaussian processes work on signal strength measurements.
3.1. Preliminaries
GPs can be derived in the function-space ways described in [10]. Let

where
GPs use precalibration data as the input values to estimate posterior distribution of fingerprint vectors through the functions f. But a key idea underlying GPs is the requirement that the function values at different cells are correlated, where the covariance between two functions

where
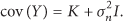
During this Gaussian processes model, we do not consider the specific function value. Conversely we just focus on the covariance between arbitrarily two functions. So it is necessary to consider the corresponding observation noise covariance. The observation noise covariance between both cells can be described as follows:

where
Here, K is the
3.2. Optimal Sampling Cell Design
Based on the input values X and corresponding observation Y, we can construct the above covariance. That is, the calibration data Y is jointly Gaussian with

where
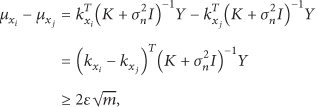
where the
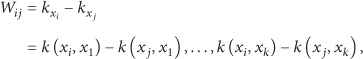
where k is
4. Experiments Evaluation
In the experiments, we evaluate the performance of GPs and the optimal sampling cell size using WiFi fingerprint data in our lab office.
4.1. Setup of Experiments
Our test scenario is an open office room with 30 m × 24 m, which consists of the workstations, corridors, and cement columns. To collect calibration data, we still select GS1011 WiFi module as the measurement platform. When the surrounding APs send beacon packets, the GS1011 model can receive signals and measure the received signal strengths. The calibration data were collected by manual mobile survey with handheld GS1011 model. The number of APs is still 8. We sampled 72 data records at 72 cells in the test room. At every cell, we sampled 20 times to compute the mean of RSSs without considering the body interference. Additionally, we randomly selected some data records to estimate the hyperparameters of the GPs. Then we used the estimated hyperparameters to construct the GPs. According to the constructed GPs, we computed the optimal sampling cell size through (8).
4.2. Experimental Results
To validate the feasibility of GPs model, we selected 15 sampled records to compute hyperparameters and construct GPs. Then another 15 cells were selected to estimate the RSS fingerprint vectors according to the newly constructed GPs. On one AP, the measurement RSSs and estimated values at above 15 cells were shown in Figure 3. The box chart represents the measurement sample and the black rectangle represents the estimated value by GPs model. From this figure, we can find the measurement RSS values have a bigger variance when the RSS values become weak. It is consistent with our results in Figure 2. Meanwhile, the estimated value also deviates from measurement mean with the fading of signal strength. This indicates the GPs model is suitable for estimating the stable data. On the other hand, the experimental results also indicate that the GPs model can be implemented to signal strength modeling.

The measurement RSSs and estimated value.
Then we changed the number of sample records to recompute hyperparameters and GPs model. The relation between sample numbers and estimated errors was shown in Figure 4. We selected 5, 10, 15, 20, 25, and 30 samples to test the estimated errors in two random cells. The means of measured RSSs in two cells are

The different sample numbers.
The AP number is another main factor to affect the estimated errors from GPs model. We selected 2, 4, and 8 of the test APs to estimate the RSS corresponding to the 10, 20, and 30 samples, respectively. The results were shown in Figure 5. The increasing of AP numbers will lead to the enlarging of the estimated mean errors about RSS. This is because more APs will accumulate the estimated errors. Besides, the samples also affect the estimated accuracy of GPs model corresponding to Figure 4.
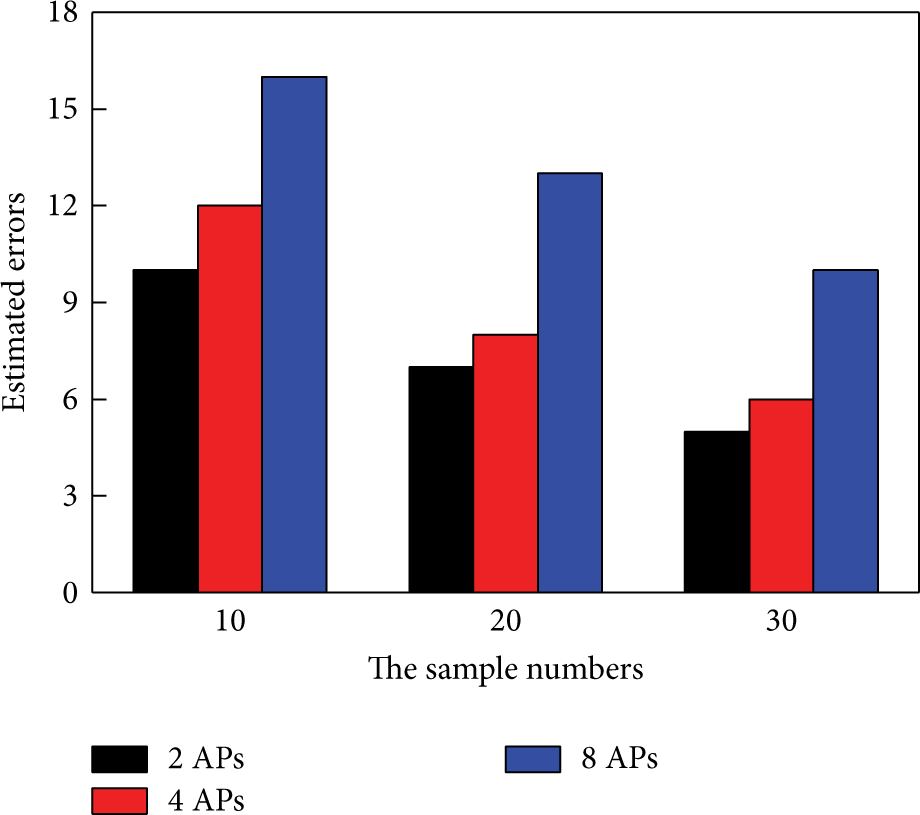
The different APs and sample numbers.
However, less APs are likewise no better, because less APs will reduce the dimensions of fingerprint vector so as to increase the fingerprint fuzziness. We design another test to verify the APs affection for two adjacent sampling cell fingerprints. 30 adjacent fingerprints with 2 m × 2 m cell size are selected to compute the Euclidean distance between each other. The computed results of 2, 4, 6, and 8 APs are shown in Figure 6. More APs will increase the mean of Euclidean distance. Then the fingerprint fuzziness will be reduced.
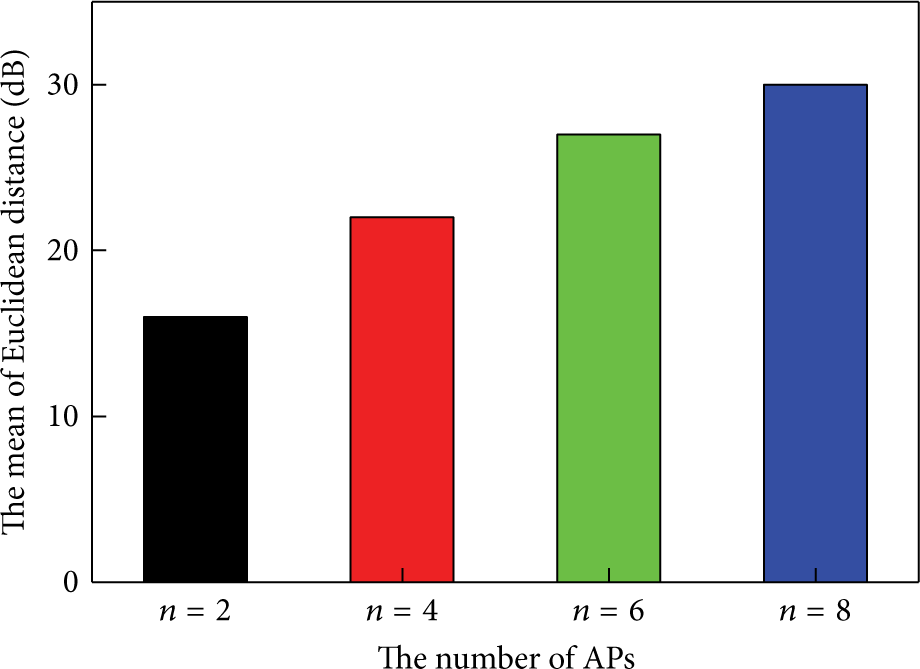
The APs affection for fingerprint fuzziness.
According to (8), we can compute the optimal cell size from GPs model based on some samples. In our experiments, we adopted the 30 samples and the optimal cell size is computed as 1.8 m * 1.8 m. Then we compared the performance of cell size 1.8 m * 1.8 m with the above three scenarios 1 m * 1 m, 2 m * 2 m, and 3 m * 3 m as shown in Figure 7. We can find that the positioning performance of 1.8 m * 1.8 m falls in between 1 m * 1 m and 2 m * 2 m. But the interest area is difficult to be divided into 1.8 m * 1.8 m cells. For survey convenience, we usually select the 2 m * 2 m cell to sample the received signal strengths as the fingerprint vectors.

The positioning performance using optimal cell size.
5. Conclusions
In this paper, we first analyze the influence of the sampling cell size for fingerprint positioning performances and find the root cause of the similarity between 1 m × 1 m and 2 m × 2 m scenarios. In order to achieve the optimal sampling cell size, we adopted the Gaussian process model to estimate the received signal strengths based on a few samples. Then we used the inherent maximum Euclidean error of fingerprint vectors to compute the optimal cell size. The experiment results also show the availability of Gaussian processes and the efficiency of optimal cell size.
Footnotes
Conflict of Interests
The authors declare that there is no conflict of interests regarding the publication of this paper.
Acknowledgments
The work was supported by the National Natural Science Foundation of China (61202436, 61202066), National High Technology Research and Development Program of China (2013AA014002), “Strategic Priority Research Program” of the Chinese Academy of Sciences (XDA06040100), and Youth Foundation of Taiyuan University of Technology (2013Z060).