
Abstract
How drivers’ visual characteristics change as they pass tunnels was studied. Firstly, nine drivers’ test data at tunnel entrance and inside sections using eye movement tracking devices were recorded. Then the transfer function of BP artificial neural network was employed to simulate and analyze the variation of the drivers’ eye movement parameters. The relation models between eye movement parameters and the distance of the tunnels were established. In the analysis of the fixation point distributions, the analytic coordinates of fixations in visual field were clustered to obtain different visual area of fixations by utilizing dynamic cluster theory. The results indicated that, at 100 meters before the entrance, the average fixation duration increased, but the fixations number decreased substantially. After 100 meters into the tunnel, the fixation duration started to decrease first and then increased. The variations of drivers’ fixation points demonstrated such a pattern of change as scatter, focus, and scatter again. While driving through the tunnels, drivers presented a long time fixation. Nearly 61.5% subjects’ average fixation duration increased significantly. In the tunnel, these drivers pay attention to seven fixation points areas from the car dashboard area to the road area in front of the car.
1. Introduction
With the continuous improvement of national road network and the quality of the road, tunnels have become the essential structures linking highway systems. Nowadays, thanks to the fast development, the quantity and complexity of tunnels of China are the best ones in the world. By the end of 2012, China's national road network consists of 10022 tunnels with 8.0527 million meters, among which there are 441 extra-long tunnels with 1.9848 million meters and 1944 long tunnels with 3.3044 million meters. A tunnel is a tubular structure with both ends opened and the middle enclosed, plus skid resistance, some transitions of alignment design, illumination, and weather conditions, especially at the entrance. Such differences in operation environment greatly increase the drivers’ visual perception load, which subsequently may lead to bad driving behavior and even accidents. This severe safety situation of the tunnel sections, especially at the entrances, has drawn the widespread attention of the highway safety experts [1–6].
Some research shows that whether drivers’ driving demand is met has an important impact on traffic safety. The space visual demand mainly represents the driving demand in the tunnel sections. When a driver is driving on the road, 95% of the visual information the driver receives and processes is dynamic, and drivers’ dynamic visual features are most closely related to the traffic accidents [7–9]. Relative velocity of the driver, illumination, and road conditions may affect the drivers’ dynamic visual characteristics. The driver's visual characteristics were studied by scholars as early as the 1980s [10–13]. In 1993, the boundaries between fixation and scanning were studied by Dave M. Stampe in Canada [14]. In 2001, the driver's visual perception behavior was studied by Baujon et al. through the real vehicle tests in the corners and tangents [15]. In 2002, the effects of the behavior of operating car radio, answering phone, and seeing read mirror on drivers’ distraction were studied by Sodhi of Rhode Island University in America and Vastenburg in Holland [16]. In 2004, Brackstone and Waterson from the University of Southampton studied eye movement behavior of people driving in high speed [17]. In 2005, the experienced and unexperienced drivers’ visual search strategy differences were studied by Falkmer and Gregersen in Sweden using EMR 600 eye movement instrument [18].
These studies are mainly focused on the basic parameters of eye movement. They rarely discussed the drivers’ visual cognitive features. Besides, these studies were carried out mainly through the driving simulator or test base, not in real operating tunnel environments. Some of the “blind” phenomena based upon the test data cannot be satisfactorily interpreted according to the test data analysis, resulting in inconsistent, even conflicting, conclusions. One of fundamental causes of the inconsistent research results was that the driver's visual behavior, vehicle operation, and road environment have not been studied together in previous research. In China, the research in this field started relatively late [19–22], as did the research combined with the certain risk of real vehicle experiments at tunnel sections. Much less has been achieved in this research area on China's national road network.
To fill the above gap in this research, nine drivers were selected randomly to do real driving experiments in the tunnel sections of highway. The drivers’ eye movement data were collected by using the eye movement tracking devices. Through the analysis of drivers’ dynamic fixation behavior, we studied the drivers’ fixation point variations at the entrance and inside of highway tunnel to shed some light on improvement on traffic management and traffic engineering.
2. Experiment Design
2.1. Test Conditions
The experiments were carried out in the daytime with sunny weather on the selected sections of highway systems in different provinces of China, including Xihan highway in Shannxi province, Changzhang highway in Hunan province, and Jinliwen highway in Zhejiang. During the test, the drivers determined the operating speed and driving behavior according to their driving experiences, driving habits, and road traffic conditions without notification of the test purpose.
According to the highway tunnel design specifications about provision for tunnel illumination, a tunnel generally can be divided into five sections: the entrance transition section, the entrance, the inside section, the exit transition section, and the exit section [23]. The main sections of our study are the entrance transition section and the entrance and inside sections. A part of the test section of the tunnel was shown in Table 1.
Part of the test tunnel sections.

2.2. Test Objects and Instruments
Nine drivers were selected randomly as test subjects mainly through recruiting at the toll stations service areas, or random hire. The vehicle used in the experiments was Santana 2000, with 2-axis, 4 wheels, and the maximum wheelbase ≤ 1.3 m. These drivers’ dynamic visual characteristics scene tested by using Eye Link II type eye movement tracking device can be seen in Figure 1. Road alignment, speed, and other parameters were captured using GPS. If there was no signal inside the tunnel, the AM-2600S five rounds of data collection instrument was used to measure the speed, the acceleration characteristics, sliding, and braking performance. During the experiments, drivers’ behaviors were captured by the camera.
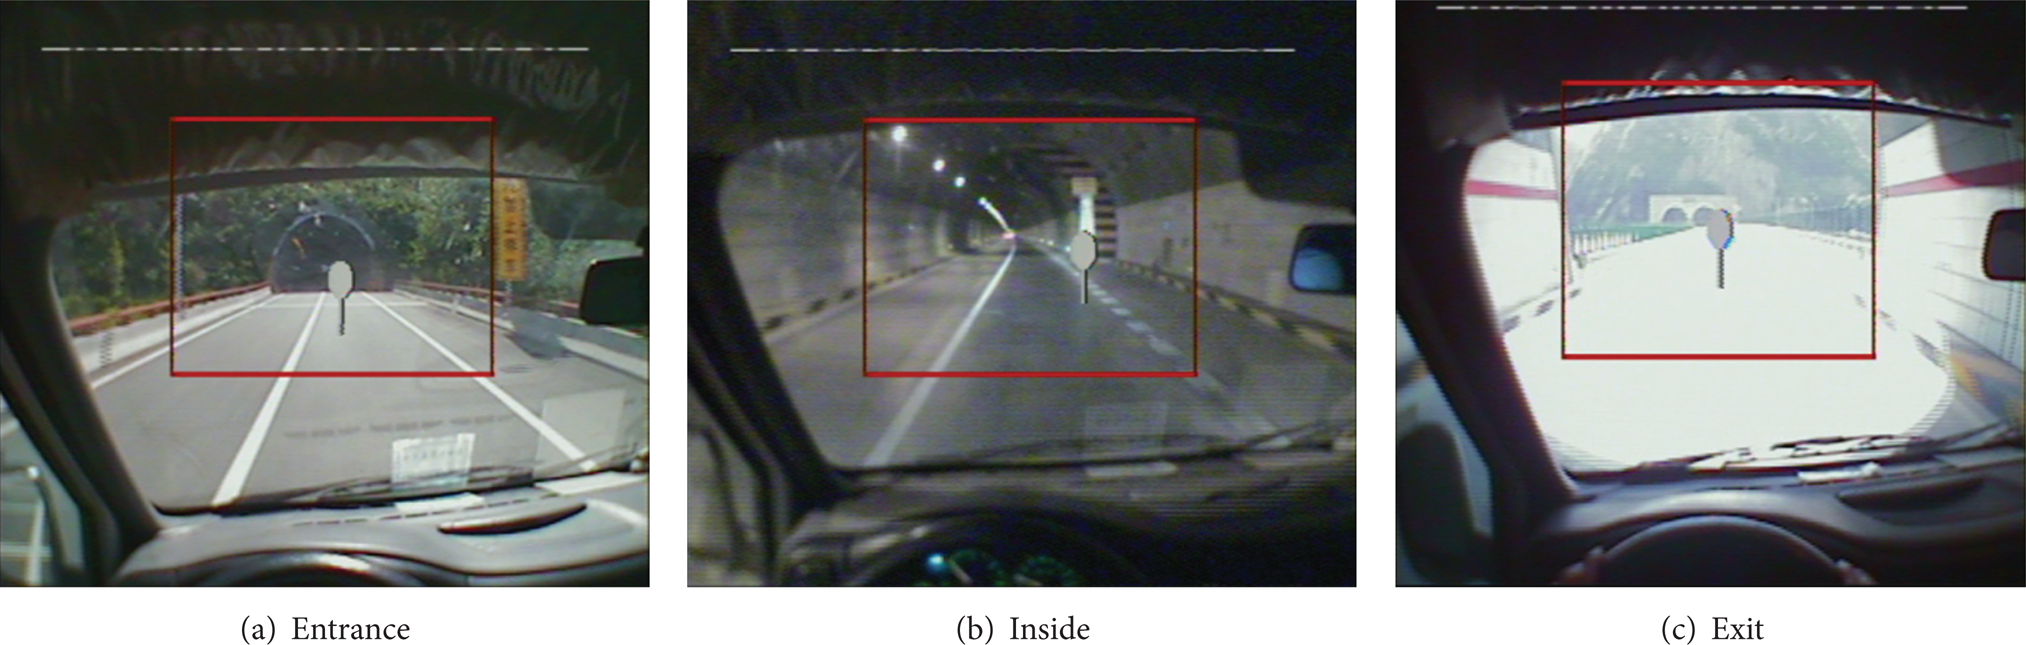
Test scene.
3. Drivers’ Dynamic Visual Mode and Parameters Selection
The mode of drivers’ visual behaviors refers to the way using eyes to perceive traffic information during driving. The mode can be divided into fixation, saccade, and following. The fixation refers to the eye on the target, dropping the images on the retinal fovea, in order to obtain processing more fully to form a clear image. According to the relevant research [24], the eye movement speed and acceleration are adopted to distinguish the fixation and saccade. The number of fixation and the fixation duration are frequently adopted in the research of drivers’ fixation characteristics.
The number of fixation is defined as the total number of fixation points and was once called a fixation point, which is a sign of the importance of the region. The more the number of fixations, the more the test concerned about this area [25]. Fixation duration refers to the time for which drivers fixate on a fixed area. It reflects the degree of drivers’ concern on a fixed area and the difficulty of extracting information. Most of the time, drivers fixate the extended area near the focal point and regularly tend to the road facilities, curb tags, and other vehicles. As the visual field becomes more complex, eye movements become more frequent, combined with shorter average fixation time. For example, when looking at rural roads, drivers’ conscious fixation duration is much longer than watching urban roads, which suggests that the visual scene is more complex in the traffic environment of city. However, drivers’ fixation duration tends to be longer when they are at risk than they are in no risk. The former influence is due to the visual characteristics of the scene and the latter reflects the driver's understanding of the risk and the need to spend more time in dealing with this additional information.
4. Analysis of Drivers’ Fixation Point Feature at Entrance
The tunnel entrance of highway consists of the section between the 200 m before the tunnel entrance and 200 m after the entrance point. In this section, the drivers experience the process of discovery and dark adaptation, from the bright environment of the ordinary, open road to the monotonous, dark, and semiclosed environment.
4.1. Fixation Duration and Fixation Number
Figure 2 shows the tested drivers’ variation of the average fixation duration at the entrance of tunnels. It can be seen in the free flow conditions that the average fixation duration at the entrance increased significantly before entering the tunnel, indicating that the drivers had enhanced the focus on the environment. At the section of 100 m to 200 m before the entrance, the fixation duration changed smoothly. However, the fixation duration increased significantly from 100 m before the tunnel to 50 m into the tunnel, going from 47.7% to 149.6%. After entering the tunnel, the drivers’ fixating duration reduced gradually by different degrees and then changed only slightly. About 85.7 percent of the drivers’ average fixating duration showed a significant change near the entrance of tunnel.

Average fixation duration variation.
The drivers’ average fixation number variations near the entrance are shown in Figure 3. As can be seen from the figure, 71.4% drivers’ average fixation number decreased gradually, especially at 100 m before entering the tunnel. The number of fixation outside the tunnel was significantly higher than inside. This indicated that the drivers were more concerned about the transition area outside the entrance. Minority drivers’ average fixation number increased slightly.

Average fixation number variation.
Taking the complexity of drivers’ eye movement and many relevant factors into account, we ran simulation on human biological neurons and analyzed the eye movement variations using the neural network. In the neural network model of driver fixation duration, 11 neurons in the hidden layer adopted the tangent function as the transfer function that normalized the input values. The output layer neuron used the logsig functions with 500 training steps. The learning error was set to no more than 1%. The fixation duration variations are shown in Figure 4.
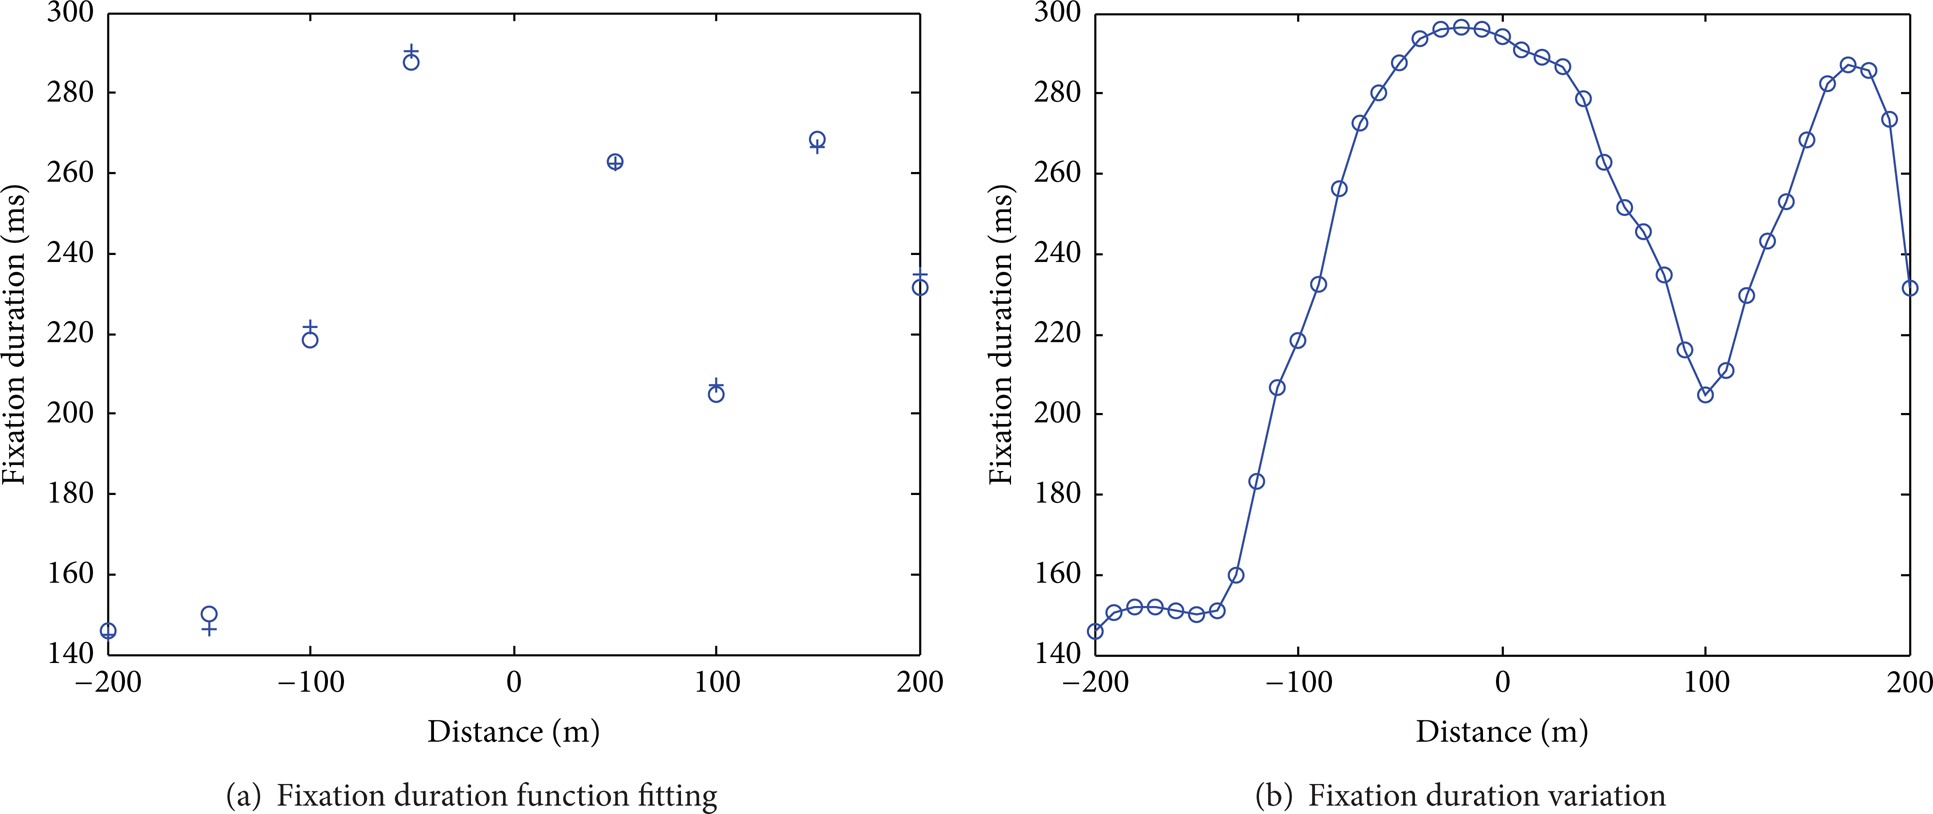
Fixation duration variation near entrance.
The neural network simulation results are shown in Table 2.
Fixation duration simulation results.
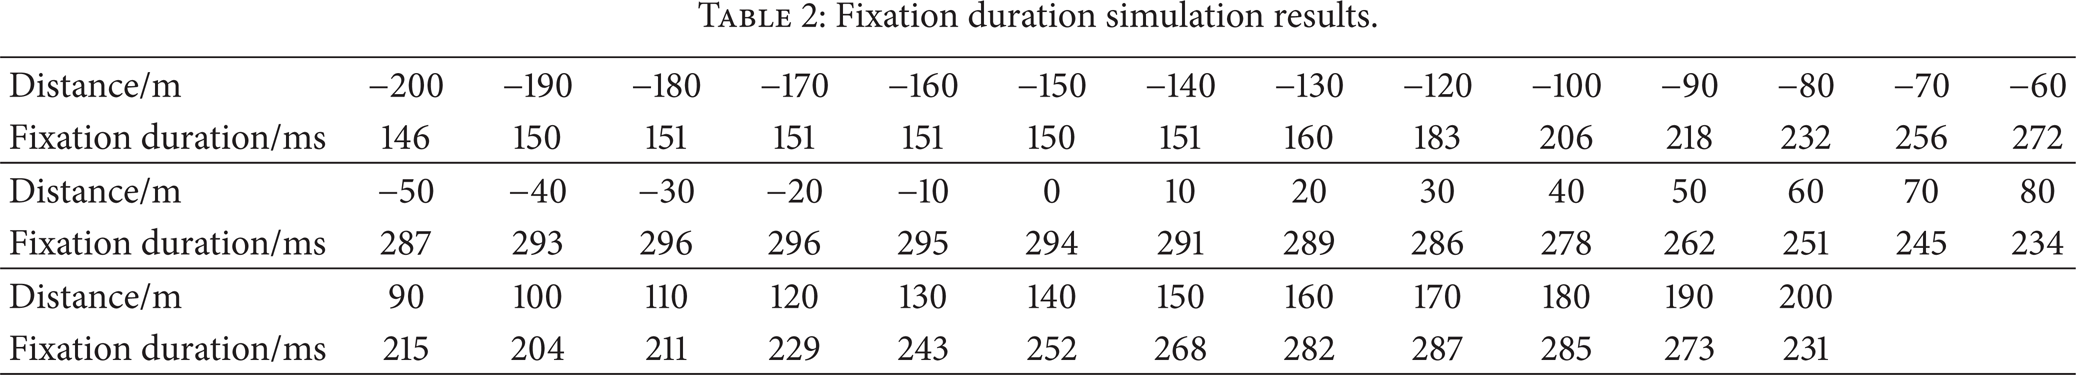
According to the results in Table 2 and the fixation duration variation in Figure 4, drivers’ fixation duration started to change smoothly 180 m before the entrance. As the drivers approached the entrance, their fixation duration increased gradually and reached the highest point as they were at 30 m section before the entrance. It can be seen that the drivers’ visions were significantly influenced by factors such as the intensity of illumination and the alignment variation. The drivers must increase attention consciously. As they drove toward 100 m into the tunnels, drivers gradually adapted to the traffic environment. It was demonstrated by the decrease in fixation duration which reached the minimum at the 100 m of section. Then, the fixation duration started to increase until it reached its maximum at 180 m of section again. The changes of the traffic flow should be the main factors influencing the dynamic visual driver at that moment. The fixation duration inside the tunnel was still lower than the outside. Based on the fixation duration variation and simulation results, the drivers’ fixation duration function with the tunnel position was established by using the regression analysis, as shown in (1). The function fitting was good and effective:
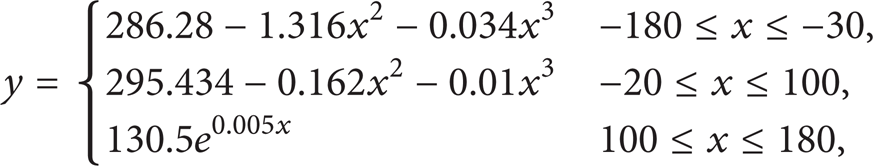
where x is the distance from the tunnel entrance, which is defined as positive according to the driving direction and y is the average fixation duration.
Fixation number variation is shown in Figure 5.

Changes of fixation numbers near the entrance.
The neural network simulation results are shown in Table 3.
Fixation number simulation results.
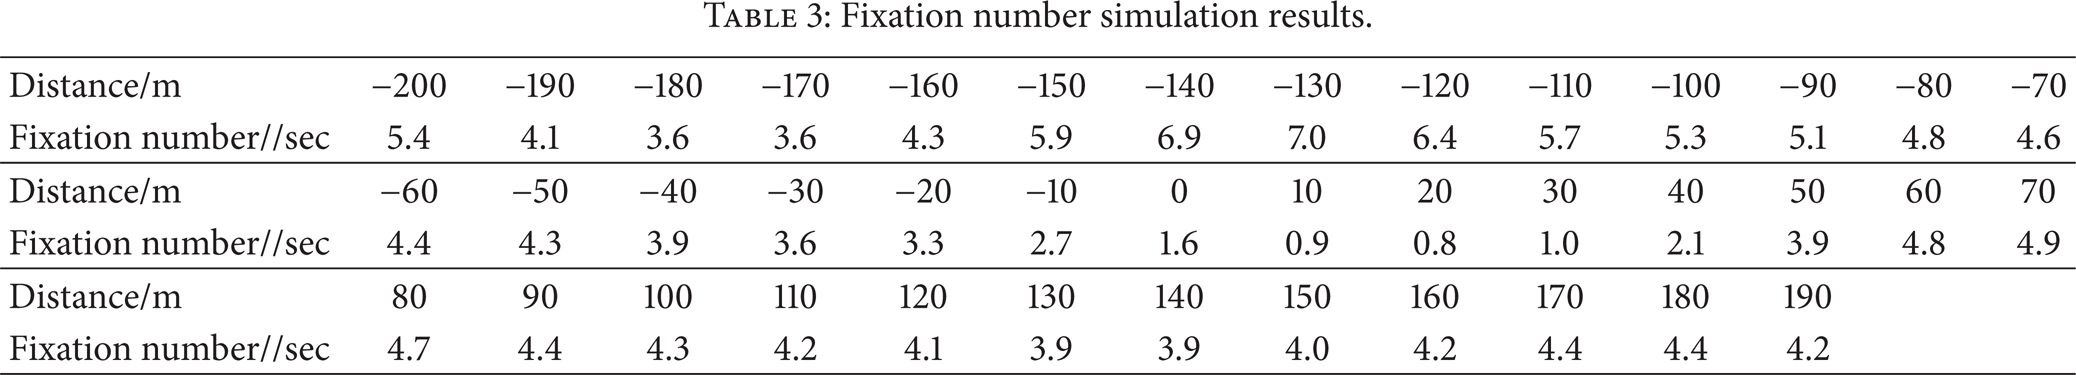
As can be seen from Figure 5, when the drivers drove into the tunnel, the fixation number started to decrease at 130 m away from the entrance, until it reached the lowest at 10 m section in the tunnel. Between 10 m and 70 m from the entrance the fixation number showed a gradual increase, a part of drivers’ dark adaptation process. Since the drivers have yet fully adapted to the environmental change of driving in brightness to darkness, the drivers needed to fixate the road environment changes actively to ensure safe operation. After that, the fixation number changed smoothly. The impact of environmental change on the fixation number near the entrance section happened between 130 m outside the entrance and 70 m inside the tunnel. Similarly, the drivers’ fixation number function was established as shown in

where x is the distance from the tunnel entrance, which is positively defined based on the direction of driving, and y is the average fixation number.
4.2. Fixation Point Distribution
Drivers’ fixation point distribution and the visual area of fixation are an important area for the visual features and search mode research. Because the scene in the static vision is stationary, it is relatively easy to divide the visual area of fixation. In comparison, the precise division in a dynamic visual scene is difficult due to constantly changing area of observation when drivers are driving.
There have been two main ways to divide the visual area of fixation, the view plane method, and the method of video. The view plane method is simple to use and has small statistical workload. But it do not consider drivers’ head deviation and the differences of the testers, vehicles, seat height, and environment. Because of these exclusions, there are big errors in the statistical results using view plane method. The video playback method is much more accurate. However, the method is very hard to be used for large video sample. It is very difficult to achieve statistical processing of large sample.
By using the dynamic clustering theory, the drivers’ fixation point variations in this section were analyzed as a cluster with an interval of 50 meters. The positions of figures in the eye tracking device below represent the locations of drivers’ fixation points in the vertical plane in the video. The numbers indicate the length of fixation durations. Similar points were classified as one group. Drivers’ fixation point changes outside the section of tunnel area were also shown in Figure 6.
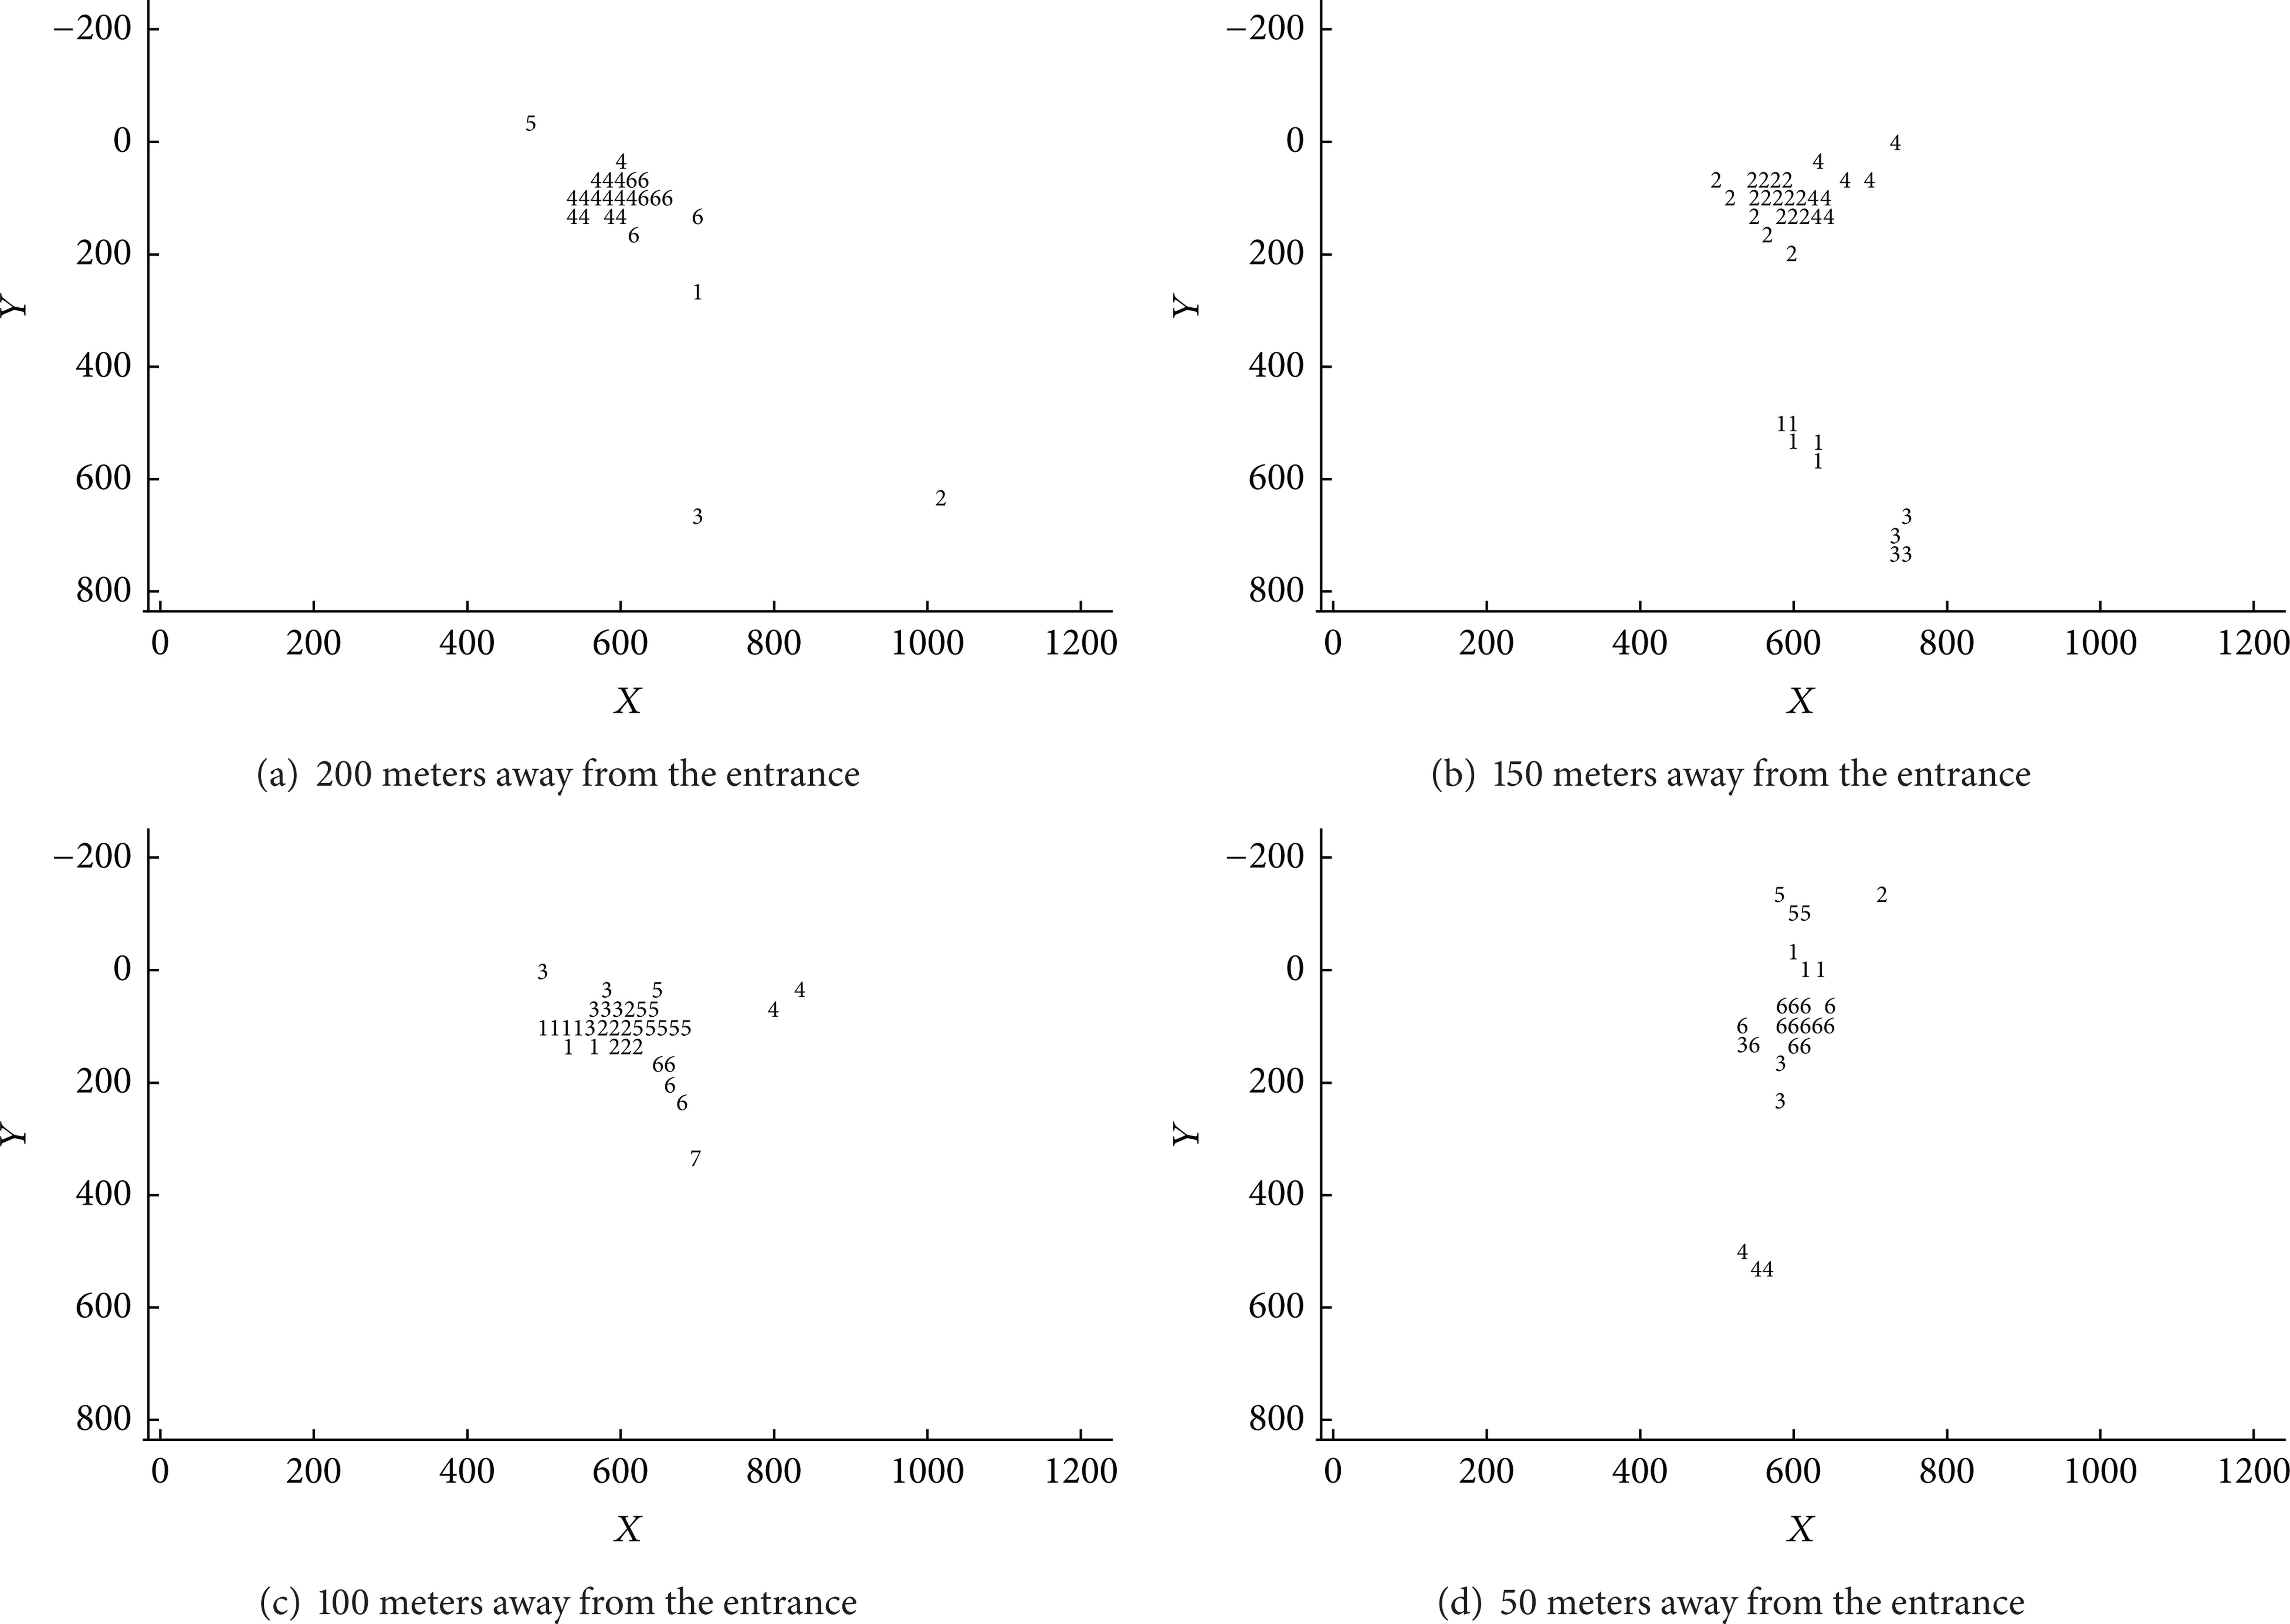
Drivers’ fixation point distribution outside.
It can be seen from Figure 6 that these drivers had found the tunnel and started to pay attention to the surrounding environment of the entrance from 200 m outside of the tunnel. The majority of fixation points were concentrated on the center of the road. Besides, these drivers paid attention to a longer distance, as shown by the concentration of fixation points on their vision vanishing point, which is the location of the tunnel entrance. When they got closer to the entrance, the drivers’ fixation area was still focused on the front, but the distributions of fixation point showed that the right side fixation gradually increased, meaning that these drivers started to pay attention to the right side of the tunnel and the right shoulder of the road. This change suggested that, although not in the tunnel yet, the drivers were affected psychologically by the side wall effect. Their physiological performance of strengthening the focus on the right side was caused by an intention to keep a safe distance between the car and the side wall of the tunnel. About 50 m before entering tunnels the distribution of these drivers’ fixation point in vertical direction was long and narrow. They were mainly focused on the inside of the tunnel and the entrance road to obtain the relevant information. As they got closer to the entrance of tunnels, the drivers became more concerned about the environmental information near the entrance, as shown in an increase of the fixation duration and the reduction in scale of fixation.
The changes in drivers’ fixation point inside the tunnel were shown in Figure 7. After driving 50 m into the tunnel, the distribution of these drivers’ fixation point was similar to the distribution of fixation point 50 m before entering the tunnel. The change exhibited a zonal distribution. After these drivers adapted to the darkness in the tunnel, these drivers started to refocus on the road inside the tunnel. After a driver entered the tunnel about 100 m, the distribution of its fixation point was still narrow and in a zonal distribution. In addition to the refocus on the road ahead, the focus on the rear-view mirror on the left was also intensified. At this point, the fixation points can be clearly divided into four categories—the road in front of the car, the road ahead, the road far ahead, and the left rear-view mirror. Such clarification in the division of fixation points suggested that the drivers gradually became familiar with the environment inside the tunnel. After 150 m into the tunnel sections, the drivers began to disperse the fixation points, in contrast to the previous sections, by increasing the focus on the right front and right shoulder of the tunnel walls. Finally, at the 200 m section of the tunnel, the drivers’ fixation point distributions were more vividly scattered than they were before, when they were mainly in the regions of the dead ahead, the left front, the right front, and the left rear vision mirror. This indicated that the drivers had fully adapted to the tunnel environment and began to pay attention to the surrounding environment variation related to the traffic.
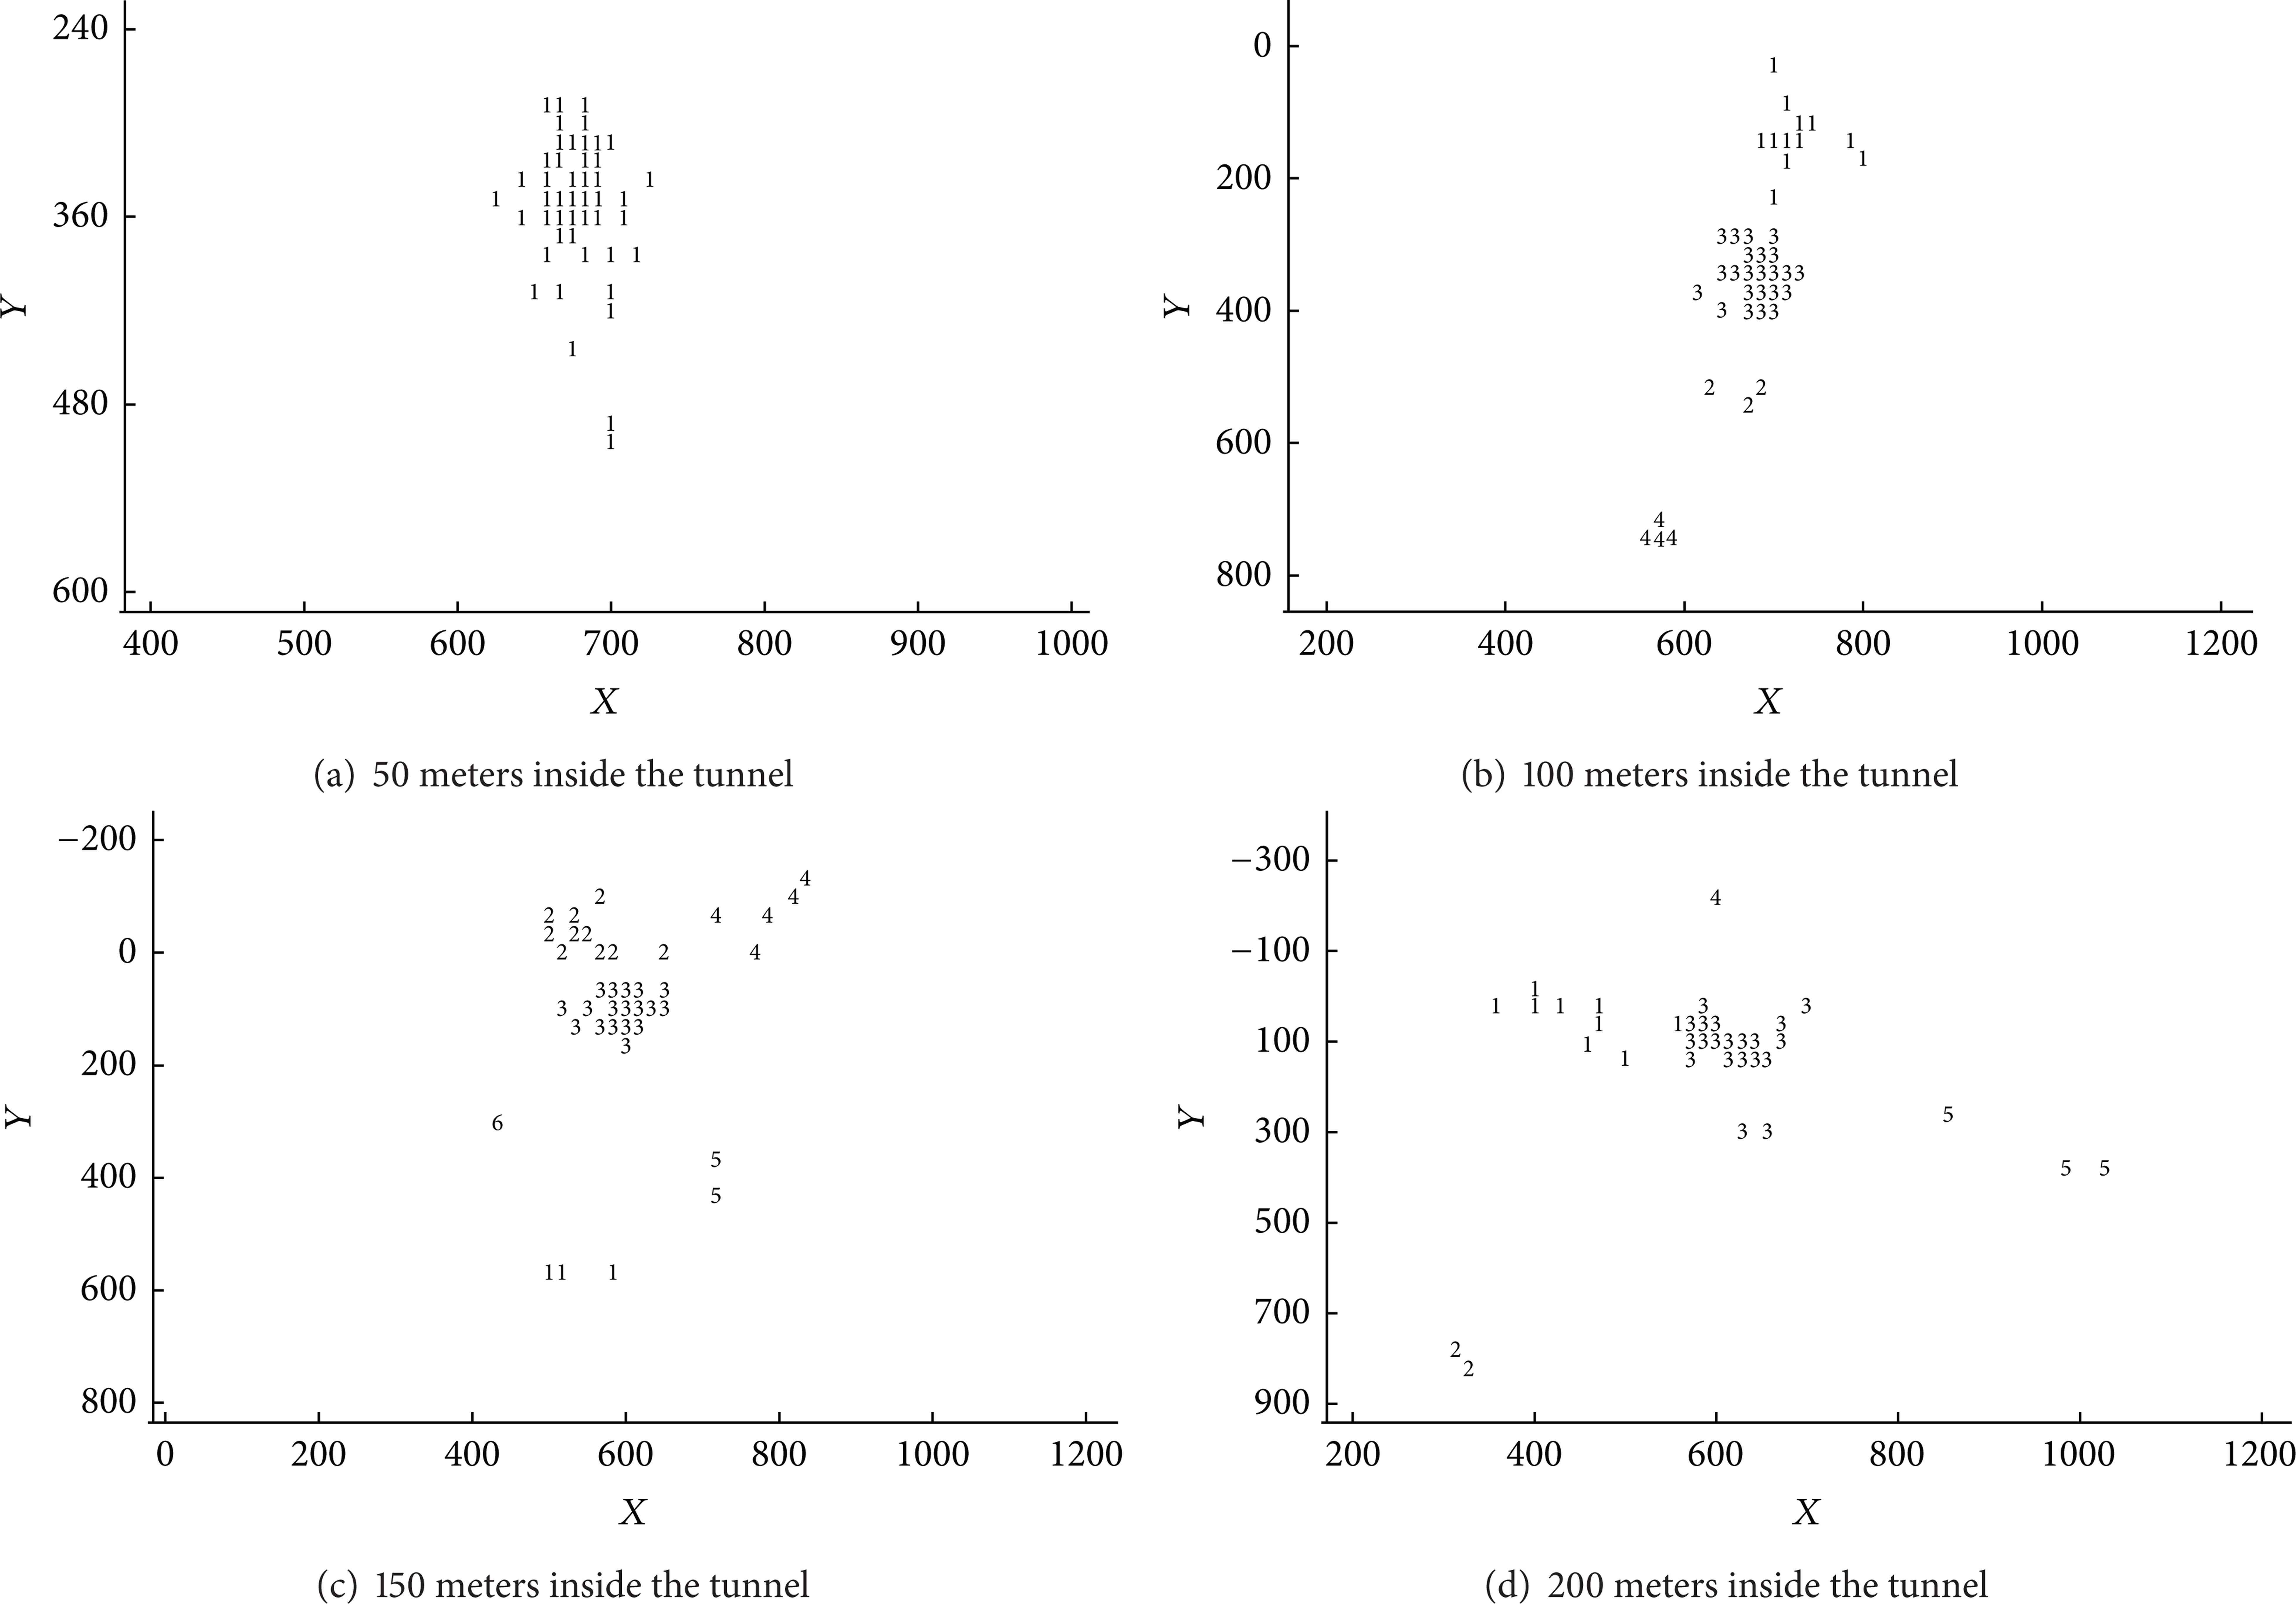
Drivers’ fixation point distribution inside.
The analysis found that the drivers’ fixation variations changed from scattered to focus and back to scattered again. During the process of driving into the tunnel, the fixation areas in turn were the surrounding environment of the tunnel entrance (the mountain, both sides of the road ahead, a wide range, etc.), traffic signs before the entrance, the tunnel entrance, the right side of the road as well as shoulder, inside and outside road of the entrance, and the environment inside the tunnel (fixation point gradually scattered). Furthermore, these drivers also always paid close attention to the left rear-view mirrors and dashboards (speedometers).
5. Analysis of Drivers’ Fixation Point Feature inside Tunnel
The driving section inside the tunnel refers to the section between 200 meters after the entrance point and 200 m before the exit point. In this section, drivers go through a process of adapting to the dark environment and the driving conditions and finding the tunnel exit. While driving, drivers mainly control the speed and select the lane based on the speed limit and traffic flow. Driving time in tunnel is associated with the length of tunnel length and the speed limit.
Compared with the significant changes of the traffic environment at the entrance and the exit of a tunnel, the traffic environment of the section inside a tunnel is monotonous, of low illumination, coupled with small environmental changes. As a result, the changes of the visual index are relatively smooth. This warrants the use of the average indexes inside the tunnel to compare with the visual index of the entrance and that of the exit.
5.1. Comparison of Average Fixation Duration and Fixation Number
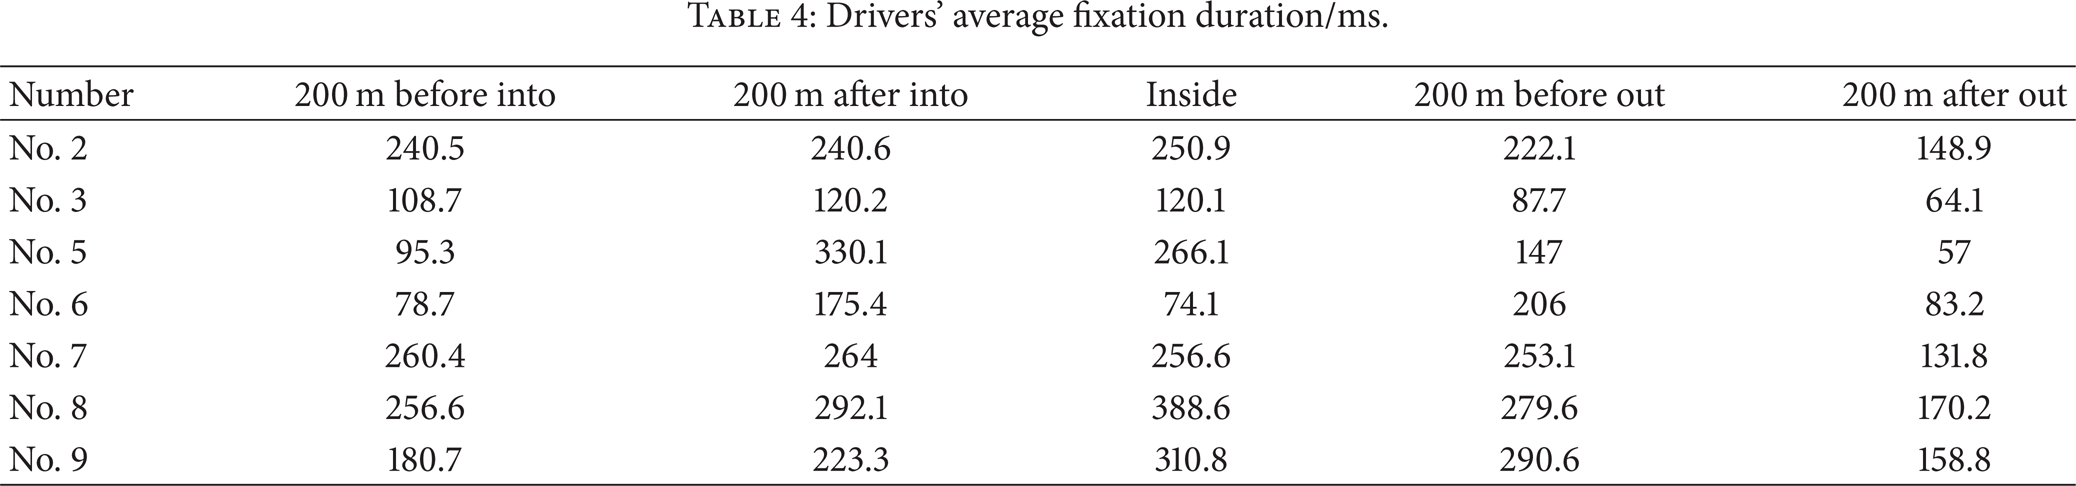
The drivers’ average fixation duration was shown in Table 4. Compared with the entrance section, 61.5% participants’ average fixation duration inside the tunnel increased significantly. Five drivers’ average fixation duration was more than 200 ms and a majority of average fixation durations were long time fixations. This indicated that due to the simple and monotonous environment in a tunnel and the lack of necessary stimulation, these drivers’ reaction time became long, leading to a long time to search and identify a target. Understandably, this visual behavior was easy to cause fatigue and unsafe driving.
Drivers’ average fixation duration/ms.
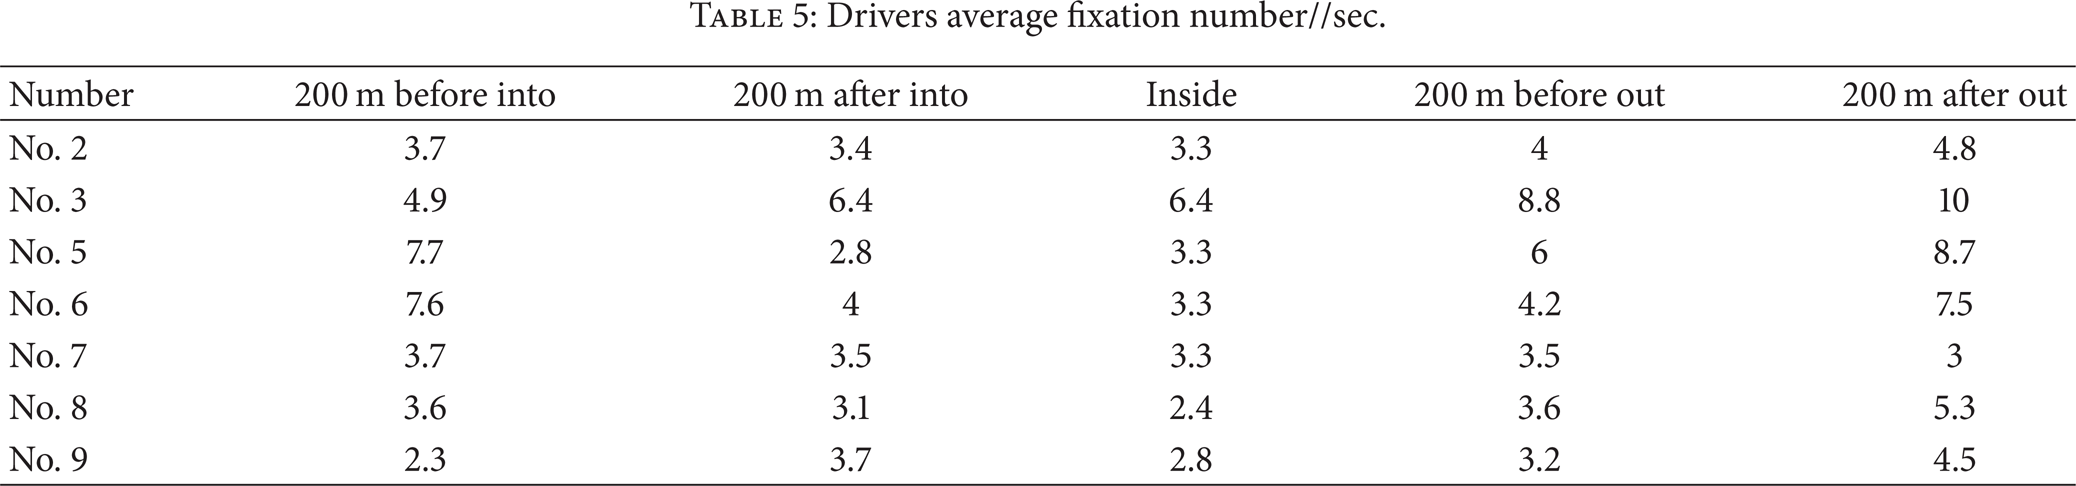
As shown in Table 5, most participants’ average fixation number inside the tunnel was lower than it was at the entrance. The stimulant reduced while the reaction time increased, causing the drivers’ fixation number to decrease inside the tunnel.
Drivers average fixation number//sec.
5.2. Law of Fixation Points Distribution
Taking the drivers’ fixation point analytic coordinates on the vision plane as a clustering variable, we grouped the positions of the fixation points into clusters using the fistulas process in SAS and completed the dynamical clustering. The results of clustering analysis showed that the Cubic Clustering Criterion (CCC) 5.934 was greater than 1 when the clustering number was 7. This suggested that the clustering result was statistically satisfactory.
A closer examination of the fixation areas showed that, correspondent with this statistical result, the drivers’ field of vision in the tunnel can indeed be roughly divided into seven identifiable areas. The clustered distributions of the drivers’ fixation points inside the tunnel and the areas were shown in Figures 8 and 9.

Fixation point distribution.

Fixation area distribution.
These results of cluster analysis suggested that the drivers’ fixation points in the tunnel can be divided into seven categories, as shown in Figure 9. Each area containing the actual fixation target was as follows.
Area 1: the car dashboard area. The car dashboard and the object in front of the car were the key observed content.
Area 2: the left visual area. The rear vehicle and the traffic condition especially the overtaking vehicles were observed mainly through the left rearview mirror.
Area 3: the main visual area near the center. These drivers mainly observed what was in front of their vehicles front and the roads far ahead. Most of these drivers’ fixation points fell on this area, which was the main area for drivers to gain the traffic information.
Area 4: the left side to the main visual area. The key observed contents included the road conditions left ahead, the tunnel wall on the left side, the road shoulder, the pedestrians cross hole, and the other related facilities.
Area 5: the area far away the main central visual area. The key observed contents included the traffic facilities right above the tunnel (including ventilator and lane indication signs) and the tunnel exit in the distance. This area was where the sight ended.
Area 6: the near roads in front of the car, including mainly the traffic conditions.
Area 7: the right side to the main visual area. The key observed contents included the conditions on the right front of the road, the right side of the tunnel wall, shoulder and the emergency lanes, and the other related facilities. The emergency lanes on the right front of tunnel and the related emergency anticollision facilities were the focus of attention in this area.
In our test, drivers generally chose to drive in the right lanes according to the speed limit in the tunnel. As a result, nearly no fixation points fell in the area near the right rear-view mirror. It was noticeable that because tunnels were bounded, the drivers’ vision became very constrained. In addition, tunnels had simple, monotonous environment, dim light and were lack of stimulation that made the targets of original unimportant traffic information get more attention of the drivers. For instance, the area where the sight of drivers ended in a tunnel contained less traffic information. This made drivers focus more on the end of the front tunnel, suggesting that the drivers were more concerned about the tunnel's exit. Psychologically speaking, drivers were eager to leave the half closed tube tunnel.
6. Conclusions
In this paper, based on the physical and psychological theories of the drivers’ dynamical vision, the basic modes and characteristic parameters of the drivers’ visual behavior were discussed systemically. Drawing from rich data collected from real vehicle experiments of different tunnel sections, the drivers’ fixation characteristics of the entrance and inside tunnel sections were analyzed by using advanced statistical procedure of cluster analysis. In the following research, the results can be used in the optimization illumination of expressway tunnels which could reduce accidents induced by visual disturbance and electricity power consumption.
The main findings are as follows.
On the entrance section of the tunnel, drivers’ average fixation duration started to increase at 100 m prior to the entrance and then decreased after 100 m into the tunnel. Soon afterwards it increased again. Before drivers entered a tunnel, the average number of the diver's fixation points decreased gradually, especially during the distance of 100 m in front of the entrance.
Inside the tunnels, the drivers exhibited a long time fixation due to the monotonous internal environment. Compared with the entrance sections, 61.5% subjects’ average fixation duration ascended significantly in contrast to the average number of fixations decreased while they drove in the tunnels.
Utilizing the transfer function of BP artificial neural network, the variation of the drivers’ eye movement parameters of the fixation duration and fixation number were simulated at the entrance. A model of the relationship between the eye movement parameters and the distance of the tunnels was established in order to analyze the drivers’ dynamic characteristics of eye movement.
A method of using dynamic cluster theory to determine the drivers’ visual area of fixation was proposed and tested. In this method, the analytic coordinates of fixations in visual field were clustered to obtain different visual areas of fixation. By comparing the visual area of fixation with the test video clips, the cluster model was able to identify the main fixation object in different areas. It was found that the drivers’ fixation variations followed a pattern of changing from scatter to focus and then back to scatter at the entrance. Inside tunnels the fixation areas can be divided into 7 regions correspondent with the car dashboard area, the left visual area, the main visual area near the center, the left side of the main visual area, the near roads in front of the car, and the right side of the main visual area.
Conflict of Interests
The authors declare that there is no conflict of interests regarding the publication of this paper.
Footnotes
Acknowledgments
The project is supported by National Natural Science Foundation of China (no. 51308059, no. 51408229, and no. 51308058), China Postdoctoral Science Foundation (2014M552399), and the Special Fund for Basic Scientific Research of Central Colleges, Chang'an University (no. 2013G1221025).