
Abstract
Analyzing the importance of the factors which influence the flow safety of the heated oil pipeline is an important part of the whole assessment process, which is of great significance on the results analysis, phenomenon explanation, and risk control after the assessment. Focusing on the problems in the influencing factors' importance analysis on crude oil pipeline flow assurance assessment, a new method to analyze the importance of the influencing factors is proposed which considers the factors' fluctuations. Based on the actual probability distribution of the influencing factors during the stable operation of the pipeline, a new measure standard of the factors' importance is defined which can measure different factors importance and realize the importance sorting of each factor. The influence of different factors on the inlet temperature is taken as an example. The importance analysis and sensitivity analysis of the influencing factors on the actual pipeline have been done, the results of which are also compared. The results show that this method can combine the pipeline actual operating conditions and the influencing factors' actual fluctuation, reflecting the effect on the results' importance in different values of each factor and different fluctuation. This method can make comprehensive analysis on the importance of the influencing factors effectively.
1. Introduction
In the flow assurance assessment of the heated crude oil pipeline, analyzing the importance of the factors that affect the flow safety is an important process and indispensable part of the whole assessment system. The importance analysis of the factors means measuring the factors importance and effect degree on the final results, which is a quantitative analysis method. The sensitivity analysis of the factors is also an important reference of the importance analysis. Through the importance analysis of the factors those which have larger effect on the assessment will be determined, which is of great significance on the results analysis, phenomenon explanation, and risk control.
Crude oil pipeline flow assurance assessment uses reliability-based limit state method [1, 2]. Through the large-scale sample calculation, the reliability index would be got. The main flow safety influencing factors are of uncertainty, which often meet a certain probability distribution, of which the normal distribution is quite common. The parameters of the probability distribution such as the average value and standard deviation (fluctuation) would be got through the on-site operating data probability statistics. For the flow assurance assessment, a complex issue, the assessment target mainly includes the temperature drop along the pipeline (especially the inlet temperature), the critical transmission amount, and the restart pressure. The independent factors involved can be divided into the following categories: crude oil rheology, the output temperature, ground temperature, heat transfer coefficient, wax deposition, and pipeline transmission capacity [3–5].
2. Research Status
For these uncertain factors importance analysis, there exist many methods, of which the most commonly used method is sensitivity analysis [6]. Sensitivity analysis is a quantitative analysis technique which studies the effect degree on the target parameters when the factors change [7]. In essence, by changing the value of the influencing factors and observing the magnitude of the target parameters’ changes, the impact degree on the entire system of this factor will be determined. However, the sensitivity analysis requires the factors change in a same rate, so the result is comparable. This method does not consider the actual changes and the probability distribution of the influencing factors. For example, a certain factor sensitivity analysis showed that it has a large effect on the target parameter, but the actual statistics found that within the acceptable range of probabilities its magnitude of fluctuation is very small. Relative to the low-sensitivity and high-fluctuation factor, it may have little effect on the actual results. As a result, the factor mentioned above can only be regarded as sensitive factor, but not an important factor. Another approach is to design a factors’ evaluation index system and calculation method, then using expert scoring [8, 9], fuzzy mathematics [10], or other methods to determine the weight coefficient and other key indicators, which is a comprehensive evaluation. Obviously, this method is greatly influenced by people subjective wishes. Fan and Zhang [11] proposed a factor importance analysis method based on sorting interval numbers, which draws on the magnitude comparison method between interval numbers. The standard to evaluate and measure the importance is the specific value between the maximum span and the sum of length of the two interval numbers. However, I think Fan's method is to compare and sort the result interval numbers that are affected by different influencing factors by the size (the position on the number axe), which is determined by the measure standard definition and just an aspect of influencing factor importance analysis. So it cannot reflect the importance of different factors completely.
3. Research on Factor Importance Analysis Method
Considering the existing problems of the factor importance analysis, a new analysis method to measure different factors importance is given in this paper. The importance of influencing factors is reflected by the amount of results change when each factor changes alone. With all the other factors unchanged, one single factor's interval number (range of fluctuation) is used to calculate the result's interval number, which reflects how the target value changes when this factor varies. Drawing on the interval number comparison and sorting method [12–16], the index calculation method to evaluate and measure the factors importance is defined, through which the quantitative evaluation standard can be got. This method not only takes into account the value zoom in and out led by the mathematical formula itself in the calculation process but also considers the probability distribution of the influencing factor values, which can characterize the factors importance through the results led by the factors comprehensively.
3.1. Factor Importance Evaluation Method
(1) Through analyzing the operation statistics of many heated crude oil pipelines in China, the influencing factors basically meet the normal distribution. By means of statistical analysis of the actual running data, the average value μ, standard deviation δ, and other parameters of the factors can be obtained. Then the interval number of this factor can be determined.
(2) The interval number is used to describe the factor value and the fluctuation range. For example, assuming that the factor is f, the average of f is μ, and the standard deviation is δ, the interval number of f is [f−, f+] = [μ − 3δ, μ + 3δ]. It does not use the upper and lower limits of the statistical value f's range as the left and right boundaries of the interval number. Considering the effect of the factor's probability distribution, the 3δ rule in probability statistics is used as the basis for the interval number value determination [12].
(3) The target parameters value range should be calculated and gain the value interval number for each factor change alone. The factor f's interval number should be taken into the target calculation formula so that the target value interval number can be calculated, which we called t. Consider t = [t
L
, t
U
]. The average value of t is
(4) The evaluation standard should be determined which is used to define the quantitative factor importance index. The target value calculated when taking the average value of each factor into the calculation formula is taken as the reference point called r. r is defined to measure the relationship between the target value interval numbers and this reference point. The dominance index and possibility index of interval number defined in other papers are used as a measure standard to compare size of different interval numbers. However, the purpose of the method in this paper is not to compare the size of different interval numbers but the minimum “distance” between one interval number and the reference point. In this paper, the importance evaluation index used to measure the minimum “distance” is defined as follows:

where r is the reference point. The probability of the target value calculated at this point is largest.
The physical meaning of this index is the distance between the midpoint of the target interval number and the reference point plus the length of the interval number, which is used to measure the deviation from the target to the reference point and the degree of fluctuation in the size of the target value. The larger P is, the more results deviate from the maximum probability of the target value or the greater target value fluctuation is. Because the result P is calculated by the factor interval number, the larger P means that the factor has a greater effect on the target value and is of more importance. The coordination factor θ is used to coordinate the two evaluation factors influence degree on the overall evaluation index P. The value of θ can be selected referring to the ratio
The specific value of θ should refer to the size of
(5) According to the size of the evaluation index P, the factor importance can be sorted. The sorting standard is in order of size. The larger P is, the more important the factor is. If the P values are the same, the results of the sensitivity analysis can be referred to, to adjust the sort.
3.2. The Process of Factor Importance Analysis
Identify the target that we want to analyze. For example, in the flow assurance assessment of the heated crude oil pipeline, the targets or the key indicators that need to be analyzed include the critical transmission amount, temperature drop along the line, inlet temperature, and restart pressure.
Select or recognize the uncertain factors that affect the target. In the flow assurance assessment of the heated crude oil pipeline, the independent factors including crude oil rheology, output temperature, ground temperature, heat transfer coefficient, wax thickness, and the flow are generally taken into consideration.
Make the probability distribution statistics of the factors selected and determine its statistical parameters. In general, the normal distribution is used as a probability model.
Calculate the interval numbers of the target value when each factor changes alone. In accordance with the importance evaluation method given above, the importance evaluation index of each factor can be calculated.
According to the evaluation index, the importance of each factor can be sorted and the degree of influence of each factor on the target results can be determined.
4. An Example Analysis
4.1. Importance Analysis
A section of one heated crude oil pipeline from Station A to Station B is taken for an example, the operation data which in January 2012 are selected for further analysis. The ground temperature, T0, the overall heat transfer coefficient, K, the flow rate in volume Q, and the output temperature, T R , are selected as influencing factors. The inlet temperature of Station B is chosen as the target. The importance of each factor to the target will be analyzed asshown in Table 1.
Parameters from Station A to Station B of some crude oil pipeline.

Through statistical analysis on the running data of 2012, the statistics in operating condition from A to B in different months can be got. In this paper, the statistical data that is representative in each quarter is shown in Table 2.
Statistics in operating conditions of different months.

The properties of the oil transported in this pipeline are shown in Table 3.
The oil properties.

Through the data in Table 3, the interval numbers of each factor (the value range of each factor) are shown in Table 4.
The interval numbers of each factor.

After calculation, the interval number of target value (the inlet temperature) can be got, which is shown in Table 5.
The inlet temperature interval numbers calculated by that of each factor.

In accordance with the calculation method of importance evaluation index proposedin Table 5, the importance sorting based on the results calculated by each factor can be made, as shown in Table 6.
The importance sorting of the four factors in 4 months.
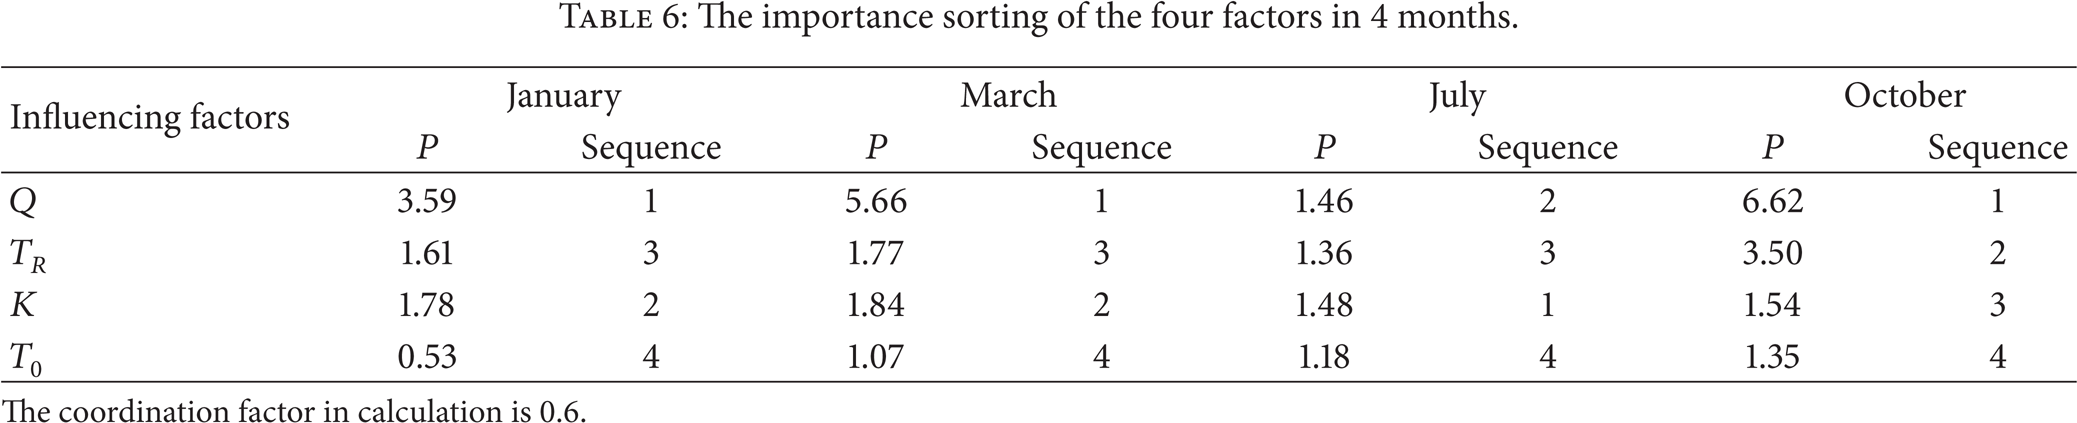
The coordination factor in calculation is 0.6.
Through the importance analysis, taking the actual statistics of each factor into consideration at the same time, it can be found that in January, March, and October the flow rate Q of the pipeline segment A-B is the most important influencing factor of the inlet temperature. The reason is that the flow of the three months is in relatively large fluctuations. The influence of the different factors on the inlet temperature is the same in January and March. The overall heat transfer coefficient has a larger effect on the inlet temperature than the output temperature of the station. The ground temperature is the last one. In July, since the average value of the flow Q in statistical data is smaller and so is its fluctuation, the importance of the flow drops to second place, which is between the overall heat transfer coefficient and output temperature. In October, the output temperature has great fluctuations so that the importance of it jumps to second place.
Based on the analysis, it can be determined that under actual operation conditions of this segment pipeline A-B and among the factors that have effect on the inlet temperature, the flow rate is the most important one. The overall heat transfer coefficient comes second. While, the ground temperature in the actual condition is of little importance to the inlet temperature. The conclusion above is consistent with the experience on site and the actual operation management experience.
When evaluating the flow safety of heated crude oil pipeline, if the evaluation results of some pipeline segment in a certain month cannot meet the safety requirements, the reason must be analyzed and problem should be found according to the importance analysis of each factor. Then against the factor found through importance analysis, improvement measures and flow assurance programs should be proposed. If the results of the flow assurance assessment show that the safety level of some pipeline segment in a certain month is quite high and has a large margin of safety, the limits of some factors can be relaxed and the energy-saving programs should be developed according to the importance of each factor, which will improve economic efficiency of the pipeline running.
If the statistical data of the same quarter in many years in the normal operation conditions of the pipeline is analyzed, the importance of each factor on the target results can be measured comprehensively using the influencing factor importance analysis in this paper.
4.2. Sensitivity Analysis
The data of January is taken to make the sensitivity analysis, the results are shown in Table 7.
The effect of the changed factors on the results.

The inlet temperature trend affected by the influencing factors is shown in Figure 1.
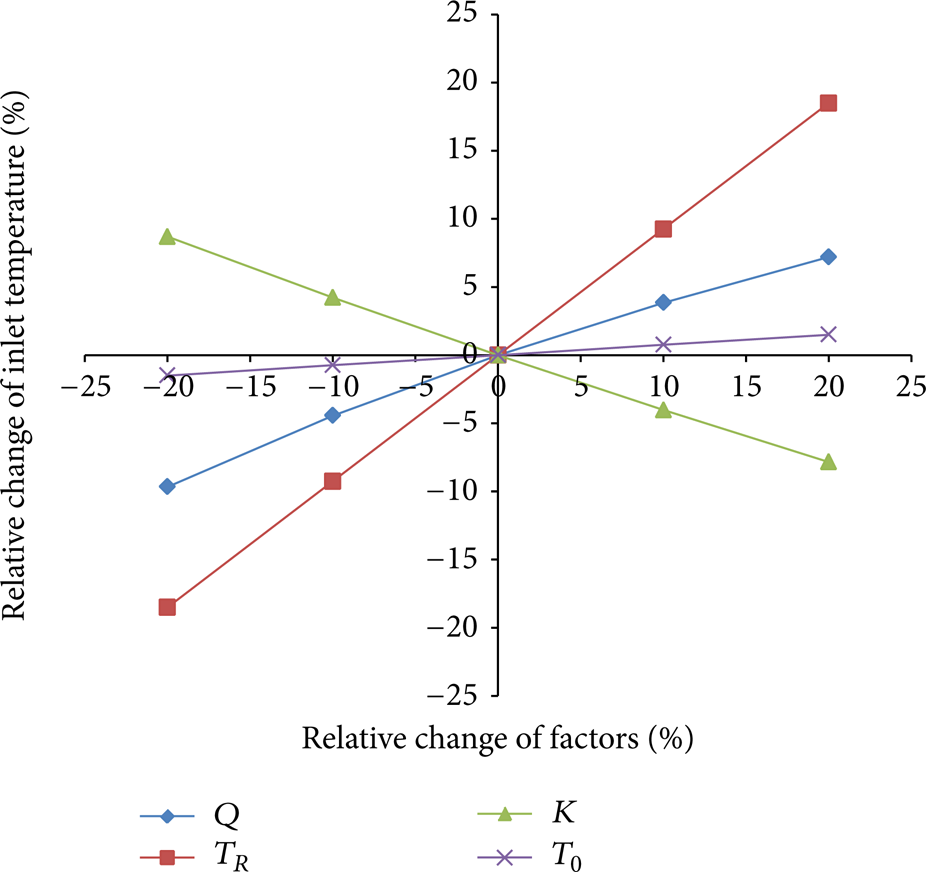
Sensitivity analysis of the influencing factors on inlet temp.
Through the sensitivity analysis, it can be found that in terms of each influencing factor that has effect on the inlet temperature the most sensitive one is the output temperature, followed by the flow rate, the overall heat transfer coefficient, and the ground temperature.
4.3. Results Contrast
The results contrast between the importance analysis and sensitivity analysis of the influencing factors is shown in Table 8.
Results contrast between importance analysis and sensitivity analysis.
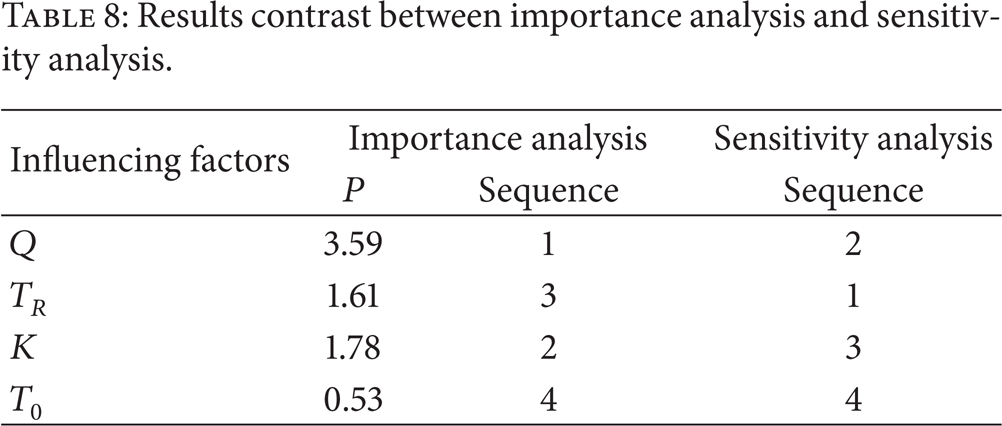
Through the sensitivity analysis, the most sensitive factor is the output temperature followed by the flow rate, overall heat transfer coefficient, and ground temperature. However, the results of the importance analysis show that the factors that should be most concerned about this pipeline segment are the flow rate and the overall heat transfer coefficient. The output temperature and ground temperature rank the 3rd and 4th.
The results of sensitivity analysis are comparable only when the influencing factors change in the same magnitude. Moreover, the sensitivity analysis reflects the results’ zoom in and out owing to the mathematical formula itself which is used to calculate the target by the influencing factors in the calculation process assuming the factors change in the same magnitude. It does not take the actual changes of each factor in the pipeline operation conditions into consideration. In fact, a certain factor is very sensitive but the fluctuation is quite small found through the probability distribution statistics so that the influence degree of this factor on the actual target is not great. The importance analysis method proposed in this paper takes the value, fluctuation, and probability distribution of each factor into consideration, which can give a comprehensive evaluation of the pipeline and reflect the actual operation conditions.
5. Conclusion
Focusing on the influence degree of the factors on the results, the influencing factor importance analysis method is proposed. In the influencing factor importance analysis of the flow assurance assessment of the heated crude oil pipeline, the interval numbers are introduced to describe each factor's values considering their probability distribution. Based on this, the new importance evaluation standard is given and so the new factor importance analysis method. According to the actual operation conditions, this method can reflect the importance and influence degree of each factor on the target considering different values and actual fluctuation of the influencing factors such as flow rate, overall heat transfer coefficient, and output temperature. This method overcomes the problems of the currently used methods which are also affected by individual subjective thinking and separate from the actual data fluctuation of the pipeline and only consider the same change rate of the factors on the target results.
Conflict of Interests
The authors declare that there is no conflict of interests regarding the publication of this paper.