
Abstract
Due to the large scale of wireless sensor networks (WSN) and the huge density of WSN nodes, classical performance evaluation techniques face new challenges in view of the complexity and diversity in WSN applications. This paper presents a “state-event-transition” formal description for WSN nodes and proposes an event-driven QPN-based modeling technique to simulate the energy behaviors of nodes. Besides, the framework architecture of a dedicated energy evaluation platform has been introduced, which can be used to simulate the energy consumption of WSN nodes and to evaluate the system lifetime of WSN. Case studies prove that this platform can be utilized for the selection of WSN nodes and network protocols, the deployment of network topology, and the prediction of system lifetime as well.
1. Introduction
With the rapid progress of information and communication technologies (ICT) and the wide range of applications in wireless sensor networks (WSN), the performance evaluation and analysis techniques in WSN have made great progress [1, 2]. Classical evaluation techniques, such as the data or bits flow analysis [3], the state transition modeling based on Markov chain [4] and Petri net [5], and the model-driven architecture analysis [6], have to face some new challenges due to the following. On one hand, it is the large scale of wireless sensor networks and the huge amount of WSN nodes, which make the physical testing become very complex when the costs and scales of WSN applications must be taken into account. On the other hand, it is the diversity of system tasks and the complexity of application environments, which make mathematical calculation become extremely complex when considering a large number of time-varying factors, such as network traffics, wireless channels, and network topologies.
In addition, the power state and its transition correlations in most of classical energy models are generally oversimplified, which normally focuses on RF transceivers but ignoring other components may result in an imprecise evaluation especially when taking into account of the cases with heavy workloads on processors and sensors. Due to the employment of these imprecise models in the simulation tools (such as NS-2/3, SHAWN, and OPNET) [7] or on the evaluation platforms [8–10], the evaluation accuracy is deteriorated and the evaluation scopes of WSN applications are thus constrained.
In this paper, we propose an event-driven queuing Petri net(QPN) model to simulate the energy consumption behaviors of sensor nodes in Section 2. The framework architecture of a dedicated energy consumption evaluation platform is introduced in Section 3. In Section 4, we give some case studies to evaluate the energy consumption of WSN nodes. Finally, we draw the conclusions and present the ongoing works.
2. Event-Driven QPN Model of WSN Nodes
WSN nodes adopt the component-based system architecture and the event-driven operation mode. In this paper, we define the
2.1. State-Event-Transition Formal Description
From the view of energy consumption, a WSN node has an energy source (i.e., batteries) and some core components (i.e., PU-microcontroller, TU-RF transceiver, and SU-sensor). Each component has its power states and some preset state transitions. By analyzing the energy behaviors of components, the sensor node is defined as “state-event-transition” (SET), illuminated as follows.
State (S). It indicates the power degrees of a component, which are customizable according to component characteristics, such as TU Event (E). It reveals the correlations between components as well as between a WSN node with its surrounding. It can be a message, data, or an interruption, and so forth. Transition (T). It donates
In view of the correlations of system operations, events are divided into three classes:
event from outside ( event between components ( event within a component (
Figure 1 shows the event-driven correlations in sensor nodes, in which WSN nodes interact with the surroundings via TU and SU. The environmental data are collected in SU and are processed in PU and finally being transmitted via TU. Moreover, the packets (carriers) sent from other WSN nodes are detected in TU and then being processed in PU according to the packet types.

Event-driven component correlations in sensor nodes.
2.2. QPN Energy Model of Sensor Nodes
Nowadays different techniques are used to evaluate the energy consumption of WSN node: stochastic analysis [11], finite state machine [12], color Petri net [13], and formal and analytical model [14]. In this work, we adopt queuing Petri net (QPN) [15] because from our point of view, QPN is more appropriate to represent the event-driven based operations of WSN and easier to describe the service queue behavior. Notice that the popular TinyOS and Contiki are event-driven WSN operating system. In order to minimize energy consumption, most of the WSN adopt sleep and wakeup and duty cycle operation modes which may be easily modeled by a finite state machine or QPN. In comparison with the existing techniques, we propose a versatile technique which enables simulating easily any WSN platform (e.g., TinyOS, Contiki, etc.).
Consequently in this paper, we adopt QPN by combining the functions and features of queuing theory and Petri net model to describe system architectures and its scheduling strategies. A 4-tuple QPN
P (Place). It represents resources or states, which provides interaction spaces between WSN nodes (components) with its surroundings. M (Token). It indicates event occurrences in “Place”, which is continuously activated during transitions. T (Transition). It indicates state transition actions of WSN node components, while events drive actions resulting in state transitions. F (A set of directed arcs). It describes conditions and influences of state transitions, which can be defined as
// { For each state s, For every p, initialize the power propertyies with the power of component in state s. } // { For each transitions { Define a transition t in QPN, Add a queue related to event e in place Initialize the service time of event e in the two queues; If Add double arrow between transition t and state }Else{ Add an arrow Initialize the time property of arrow } } }
In order to evaluate the energy consumption of SET system, several time relative parameters are defined in the QPN model as the properties of power states, that is, wait time, service time, and residence time, which are used to estimate the time duration that a WSN node (component) operates in a power state. For most of WSN nodes, there is a single core processor and a RF transceiver; thus, we can suppose that only a unique service provider exists in a place. Generally, as the WSN node has low workload, the component's service rate is always larger than events arrival rate, which means that the event queue can be simplified as an infinite queue. Furthermore, since the wait time that tokens arrive at a place is uncertain and the service time is generally determined, the
2.2.1. Definition of QPN Energy Model
(A) Place. In the QPN model, two classes of places (shown in Table 1) are defined: state place, also known as queue place, represents a power state of WSN nodes (components); resource place provides resources to simulate event-driven behaviors or generate activation condition.
Place definition in the QPN model.

(B) Token. In the QPN model, three classes of tokens (shown in Table 2) are proposed: event token corresponds to events in SET; state token provides “customer” under nonoperation states; resource token provides the channel allocation.
Token definition in QPN model.

(C) Transition. In the QPN model, transition reveals system operations of WSN nodes through tokens migration within places, which resulted in state changes. Define transition rules as follows:
The QPN model declares 19 transitions to describe the correlations among components, nodes, and its surroundings based on tokens and places. Giving an example to illuminate state transition, for example, the 6th transition, termed p_Tx_data, contains two operation modes: (1) data processing: the transition expression is

Graphical modeling instantiation of 6th transition: p_Tx_data.
2.2.2. Instantiation of QPN Energy Model
Based on the model definitions of the 4-tuple QPN

QPN model implementation on QPME.
3. Energy Evaluation Platform Based on QPN Model
3.1. Framework of Energy Evaluation Platform
Based on the QPN model, a dedicated energy evaluation platform is designed for WSN nodes, shown in Figure 4, which consists of two main components: an event generator and the QPN energy simulator.

Framework of energy evaluation platform for WSN nodes.
This paper aims to propose a common platform for energy evaluation of WSN nodes, which must cover the differences in the HW and SW architecture, diversified tasks, and complex environments. From our point of view, on one hand, the runtime environments and tasks determine the occurrence frequency and the success rate of events; on the other hand, system architecture and its strategies have a significant impact on energy consumptions of WSN nodes.
The event generator can generate event sequences similar to the real scenarios, which allows users to customize the runtime characteristics of environments and tasks, and the system architecture and its strategies as well. The customized information is sent to the network simulation engine (i.e., NS-2) and then the event sequences can be achieved as the simulation outputs.
3.2. Evaluation Methodology of Energy Consumption
Several hypotheses are proposed to simplify the energy consumption calculation of WSN nodes: (1) energy source (i.e., battery) has the linear charge and discharge characteristics without regard to recharge issues. (2) Energy consumption of WSN node (
From the view of the QPN model, events drive system operations and then result in energy consumption of sensor nodes. Considering an event ein a place p, to analyze its energy consumption, we need to count the four parameters: the operation time (
Assuming that the conversion time of state transition is termed as 
4. Energy Evaluation of Sensor Nodes: Case Studies
This QPN model is instantiated on the QPME emulator [16]. Some case studies are investigated to evaluate this model, including the energy evaluation and lifetime prediction of WSN nodes. The obtained results are compared with other approaches ones.
4.1. Energy Consumption Evaluation of WSN Node
4.1.1. Node Architecture and Simulation Conditions
The energy evaluation platform allows users to customize the architecture of WSN nodes and configure the simulation conditions according to requirements. In this case study, we suppose a WSN node (i.e., telos, termed
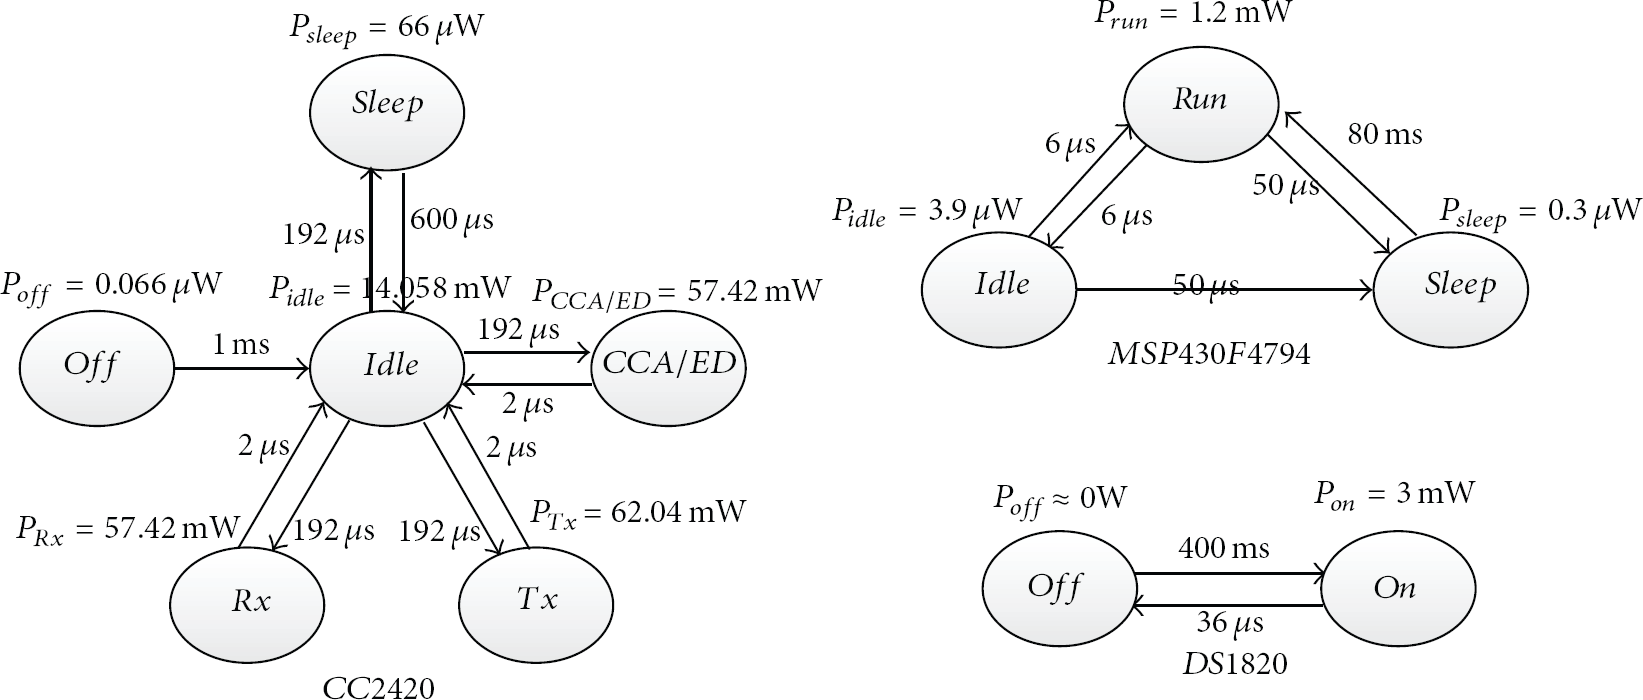
Performance parameters and the state relationship in node
Three simulation tests are performed which aim to compare the energy consumption of WSN nodes in different workload models, described in Table 3.
Simulation conditions in

4.1.2. Simulation Results and Analysis
The two statistical parameters, the operation time (
Simulation results of energy consumption in

The evaluation results under different simulation conditions are shown in Figure 6. Some conclusions can thus be summarized as follows.

Simulation results of energy consumption in
In WSN applications, those nodes surrounding the sink node or the cluster-head node in general consume more energy due to the higher arrival rate of data packet comparing with others, which may lead to the phenomenon of “surveillance holes”. In test 1 and test 2, different rates of packet arrival are proposed to evaluate the balanced energy consumption issue of WSN. Moreover, different task models generate different workloads that lead to different energy consumption. In test 2 and test 3, different sampling frequencies of SU are proposed to evaluate the workload influences on energy consumption of nodes.
In Figure 6, because test 2 has the double rate of packet arrive than test 1, the WSN node in test 2 thus has higher energy consumption; because test 3 has the four times of sampling frequency than test 1, the WSN node in test 3 thus has higher energy consumption as well.
4.1.3. Simulation Comparison Based on Node Architecture
In order to evaluate the influence of node architecture on energy consumption, assume another WSN node (i.e., Mica2, termed
Simulation conditions in

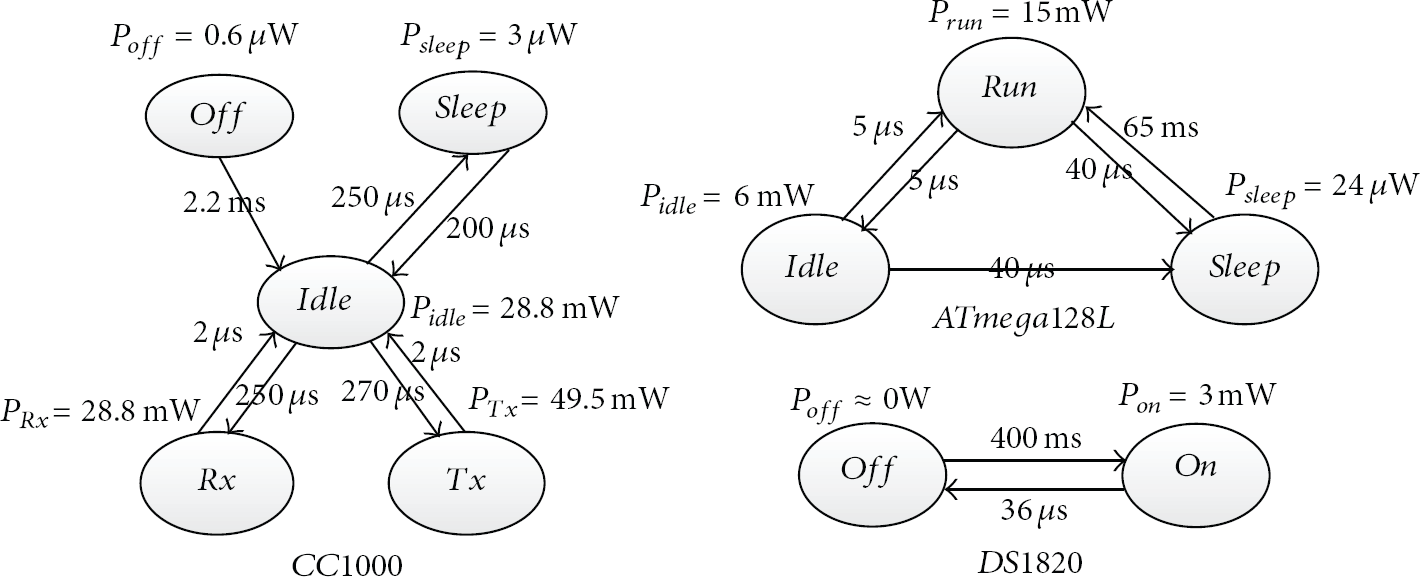
Performance parameters and the state relationship in node
The energy results are obtained based on the QPN model simulation, shown in Table 6. Some conclusions can be summarized as follows.
Energy consumption in

As an event-driven system, most of WSN node components enter the low-power state to save energy when no event occurs. In Table 6, test 4 and test 5 show the energy evaluation in
Comparing with the results in test 1 (
4.2. Lifetime Prediction of WSN Node
4.2.1. Node Architecture and Simulation Conditions
In WSN applications, the lifetime of WSN node is a key parameter for the protocol selection and topology deployment, which is predictable based on the QPN simulation and energy evaluation. In order to evaluate the lifetime of WSN node, assuming another WSN node (termed
Simulation conditions in


Power and time parameters in PU component of
4.2.2. Simulation Results and Analysis
Figure 9 shows the energy prediction of WSN nodes, in which the linear approximation functions of node energy consumption are
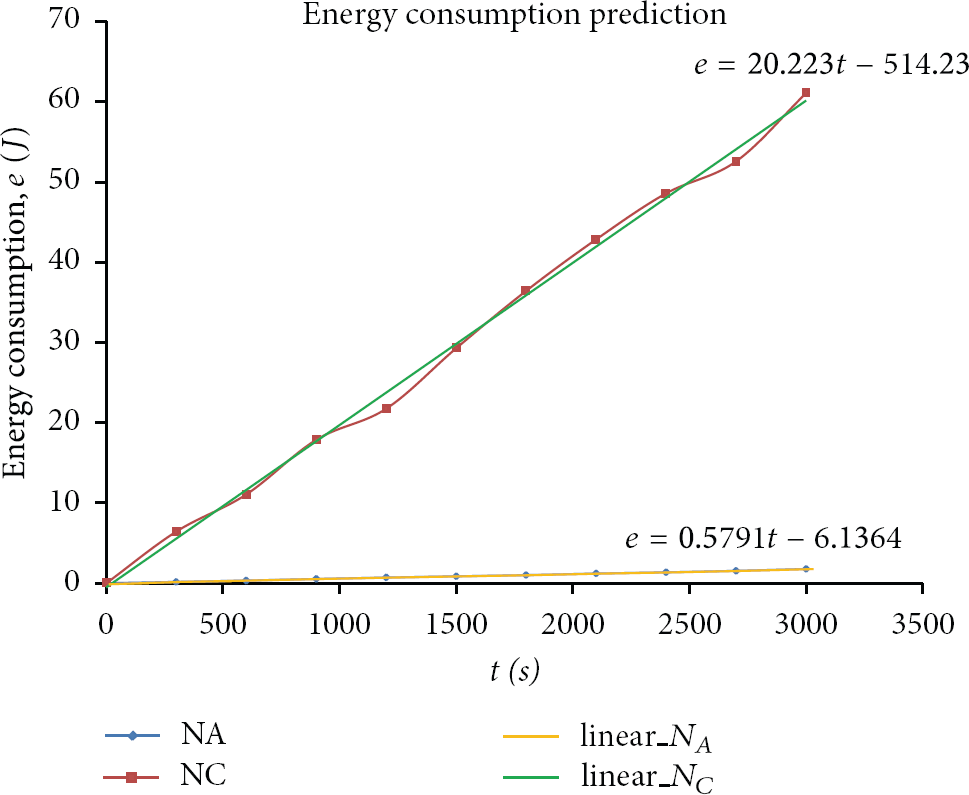
Energy prediction of WSN nodes (
Based on the linear functions, the lifetime of WSN node can be predicted. Suppose that an energy source of WSN node is 100 J and the operation scenario is described in Table 7; then, the lifetimes of

Lifetime prediction of WSN nodes.
4.3. Comparison and Verification with Other Approaches
In order to evaluate this QPN model, we compare the simulation results with other evaluation approaches.
4.3.1. Comparing with NS-2 Simulation
In [17], an energy model is developed to replace the original energy model in NS-2, which can be used to compare with this QPN model, given the same simulation environment defined in Table 8.
Simulation conditions based on QPN and NS-2.

The result comparisons of energy consumption based on QPN and NS-2 are shown in Figures 11 and 12, illustrated as follows. (1) The two energy curves in QPN and NS-2 are linear approximation and the simulation results are thus approximate; (2) TU in NS-2 consumes more energy than in QPN because the wireless channel model and the control packets are considered in the energy evaluation of NS-2, which make the NS-2 simulation more precise.

Comparisons of node energy consumption based on QPN and NS-2.

Comparisons of component energy consumption based on QPN and NS-2.
4.3.2. Comparing with Physical Measure
The physical measure is performed to verify the performance of QPN model. The target node is CC2430 (termed

Prototype of sensor node CC2430.
Table 9 defines the simulation and test scenario and the initial capacity of battery is 10.8 KJ. The test approach refers to [18], and the physical test is performed per hour to measure the battery capacity at the moments.
Simulation and test conditions in

Figure 14 shows the energy comparison between the QPN simulation and physical test. The results show that the QPN simulation has the similar energy tendency and its energy curve is close to the actual energy consumption. However, in Figure 14, the energy curves also expose the widening gap with the time duration. Assuming that the failure threshold of battery capacity is 50 J, the estimation lifetime of WSN nodes is 234.8 days according to the QPN simulation curve but only 176 days according to the measurement curve. The main reasons resulting in the gap include the power consumption of hardware circuits, the nonlinear discharge characteristics of battery, imprecise measurement method, and so forth. In view of the electromagnetic discharge curve and the conclusions in [18], we can confirm that the difference is reasonable.
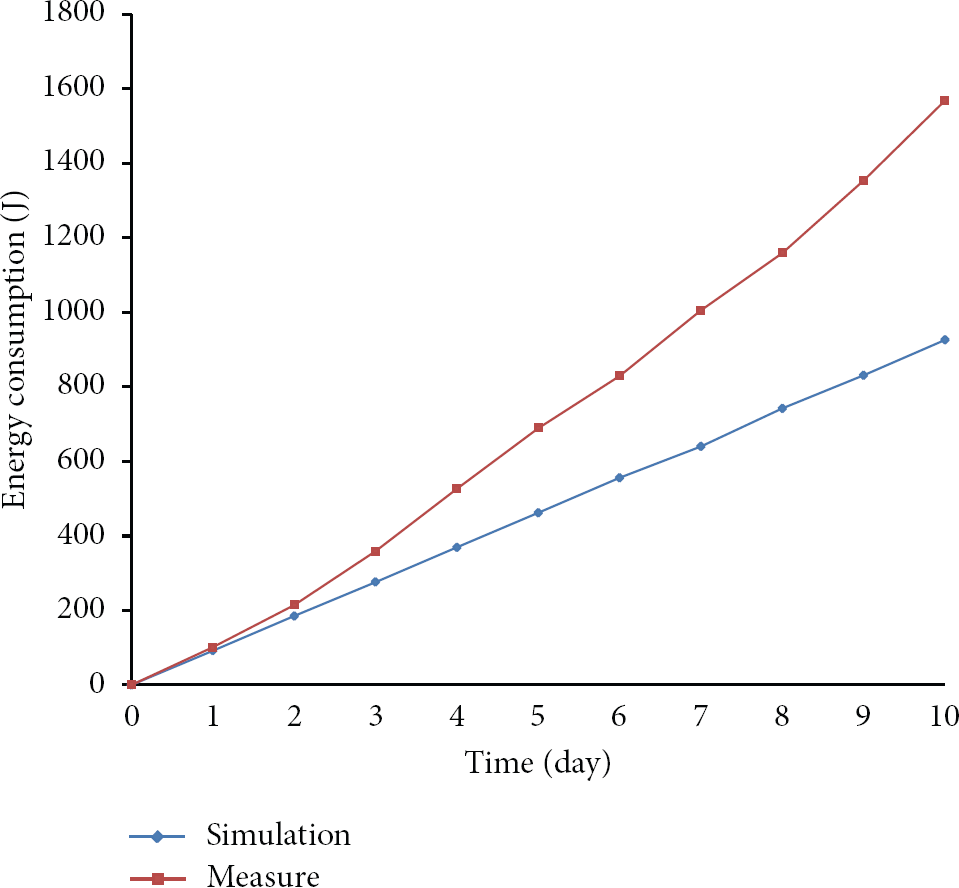
Energy evaluation in model simulation and physical measure.
5. Conclusions
At present, the “state-event-transition” formal descriptions for the energy behaviors of WSN nodes are defined, and the event-driven QPN model is proposed and instantiated on QPME. Besides, a dedicated energy consumption evaluation platform based on the QPN model is implemented, on which some cases studied are investigated to evaluate the energy consumption of WSN nodes and to predict the lifetime of WSN. The evaluation results prove that this platform can be utilized for the selection of WSN nodes and protocols, the deployment of network topology, and the evaluation of system lifetime as well.
In order to improve the accuracy and efficiency for this QPN model, the ongoing works focus on the following topics: (1) to obtain accurate power and time parameters of components and the capacity of batteries; the testing platform and benchmarks are being designed to measure energy consumption of WSN nodes; (2) to compare with the performance results obtained from other approaches; the simulation approach based on network simulation tools and the physical testing approach are adopted to validate the accuracy of this model; and (3) to analyze energy consumption of WSN; based on this QPN model, the energy consumption of WSN are modelled to evaluated the system lifetime and then to predict the evolution of WSN system in the future.
Footnotes
Conflict of Interests
The authors declare that there is no conflict of interests regarding the publication of this paper.
Acknowledgments
The authors would like to thank all the colleagues and copartners who have contributed to the study. The authors are also grateful to the International Scientific Cooperative Research Program of China (no. 2010DFA14400), the National High Technology Development 863 Program of China (no. 2013AA01A215), the Fundamental Research Funds for the Central Universities (no. HIT.NSRIF.2014067), and the National Natural Science Foundation of China (no. 61173020) for their supports.