
Abstract
The goal of pavement is to deliver the fine roughness and the safe road surface to traffic. It requires a secured and comfortable surface using the controlled speed of road. Through adjusting driving speed, skid resistance can be altered in one of the performances of the pavement surface. In high speed driving, there might be a certain level of risk, not in the same level as the proposed roads. Hence, this study first analyzes the speed equation under a consideration of a braking distance and then suggests the friction coefficient in high speed driving with the principle of conservation of energy. If we accept simply that the coefficient of friction is independent of speed, the difference between analysis and test value for braking distance is greatly generated. Therefore we have to analyze the coefficient of friction as an exponential function of braking speed of a vehicle.
1. Introduction
A car and a tire require such diverse performances: handling, braking, durability, wear-resistance, NVH performance, fuel-efficiency, and so forth. Among them, a driver's stability is mainly related with the performances of handling and braking. Technology has put a greater emphasis on a customer's stability through the installation of ABS system of airbags. There are three elements deciding performances of ABS: first, ABS system of the car second, braking characteristics, and third, friction characteristics of the brake pad. In 2001, NCAP (New Car Assessment Program) was introduced in Korea, and it has influenced the local car manufacturers to take a braking performance of the car more seriously. Therefore, the expectation of automobile manufacturers on braking performances of a tire has risen. Consequently, this has produced an external atmosphere which spurs tire manufactures to develop technology improving performances of ABS braking. In this regard, this study is to suggest experimental results of brake performances of the tire. The current speed limit is restricted to 100 km/h not only by NCAP tests but also under most of the local road conditions. Nevertheless, nowadays road conditions have been improved to allow higher speed (100 km/h or faster). Thus high speed driving of the vehicle becomes more important to the safety of driver [1]. The purpose of this paper is to prevent vehicle accidents with correct prediction for the braking distance at high speed driving. Driver's safety and specifically braking performances are to be commonly considered under a higher speed. Recently under the management of the Ministry of Land, Transport and Maritime Affairs, a verifying and announcing system about collision durability and ABS braking performances directly linked to the driver's life has been introduced in Korea with limitation to new cars for a domestic consumption. While collision tests of cars have already been performed, a system with ABS notifying brake performances to consumers under dry and wet conditions was introduced in 2001 to protect consumer's benefit. This system referred to as New Car Assessment Program (NCAP) has been implemented in advanced countries such as the USA and Japan.
2. Friction Mechanism with respect to Characteristics of Road Surface
According to the Coulomb Law, a friction coefficient of a perfectly elastic body such as steel is determined by the load and the friction force of the body, and the value of a friction coefficient cannot exceed 1 [2, 3]. However, an object such as elastomer becomes deformed when an external force is applied. Thus, to describe the mechanism of this process is far more complicated. The mechanism needs to be analyzed in a totally different way on the texture of the road surface with which elastomer contacts. As shown in (1), the friction coefficient of elastomer is determined by adding three coefficients such as an adhesion friction coefficient of a molecular interaction between the road surface and elastomer, a friction coefficient of a hysteresis on deformations of elastomer [4–6], and a friction coefficient of the cohesion due to wear or tear.

Here, the adhesion which means a friction mechanism of polymer interactions between surfaces of the tread rubber and the road surface determines friction characteristics on the smooth and dry road surface as shown in Figure 1(a). The grip especially on the icy or snowy road surfaces depends on the friction mechanism.
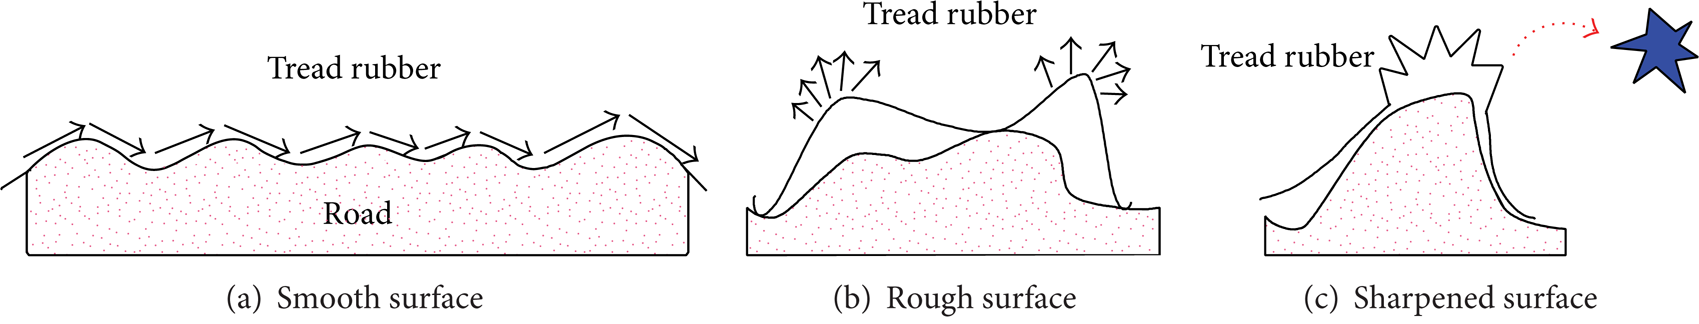
Friction mechanism on texture of road surface.
Hysteresis is a frictional characteristic by the loss of hysteretic energy which occurs due to the repeated deformation of the tread. As the hysteresis acts as the major factor on the wet road surface, hysteresis characteristics of the compound are very important for a wet brake performance. Since the friction coefficient of cohesion applied to both wear and tear is relevant to abrasion characteristics of the tread rubber, it is significant for very rough road surface. However, the influence of the friction coefficient by cohesion over the total friction coefficient is generally as slight as negligible compared to adhesion or hysteresis [7–9] terms. Grip characteristics with respect to the road surface are to be summarized as follows. As for the characteristics of a compound, a superior adhesion feature is favorable to a smooth road surface, a high hysteresis is good to a rough road surface, and superior wear-resistance and high tear energy are advantageous to a sharpened road surface. In case of snow or ice grip relevant to a smooth road surface, a compound is required to be softer. So, a compound with a low hardness is widely to be employed. Since a rubber tends to be hardened as the temperature drops, grip of rubber is deteriorated on icy road surface. Thus, in order to prevent this, it is desirable to use a silica compound with a low temperature-dependency against hardness. The adhesion mechanism results in molecular interactions between the rubber and the compound of road surfaces. There exists a higher adhesion element of them on the dry road condition. The more adhesion, the less friction loss. On the other hand when the road surface is wet, adhesion decreases generally. So, friction loss increases on the wet road. The hysteresis mechanism means an energy loss due to deformations of rubber produced by the sliding of rubber on the road compound. Table 1 summarizes a friction mechanism with respect to characteristics of road surface as mentioned above.
Friction mechanism with respect to characteristics of road surface.

The result of a wet friction coefficient obtained from Dynamic Friction Tester (DFT) on diverse types of road surfaces is described below. As shown in Figure 2, four types of road surface consisting of asphalt, cement, basalt, and epoxy are suggested for this test in the laboratory. Asphalt surface that was tested was made of the same asphalt that was used on the highway. Concrete surface consisted of mixture with the same rate as the sand and cement. Basalt surface was generated by basalt rock polishing. Also epoxy surface has the same level coefficient of friction as ice. And then DFT with a rotating disk plate is employed to measure a friction coefficient.

Road surface textures.
Figure 3 explains how DFT measures the friction coefficient. When the disk plate attached to three rubber samples rotates, there exists a friction between the rubber samples and the wet ground surface. DFT measures friction forces until the disk plate stops due to the friction. After measuring torque applied to three rubber specimen attached flat plates, the frictional force and coefficient of friction can be measured. This test method is used to determine the relative effects of various polishing techniques on materials or material combination and is provided in ASTM in detail.
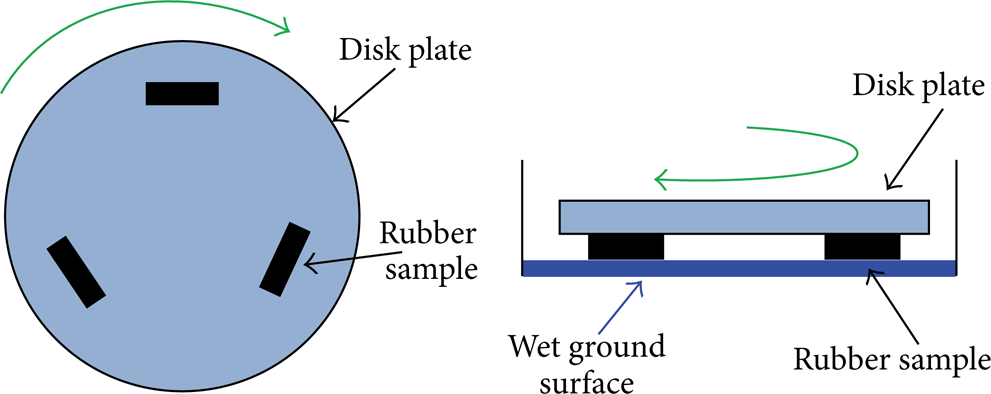
Configuration of dynamic friction tester.
Dimension and shape of rubber sample attached disk plate in Figure 3 are well expressed in Figure 4.

Dimension and shape of rubber sample attached disk plate.
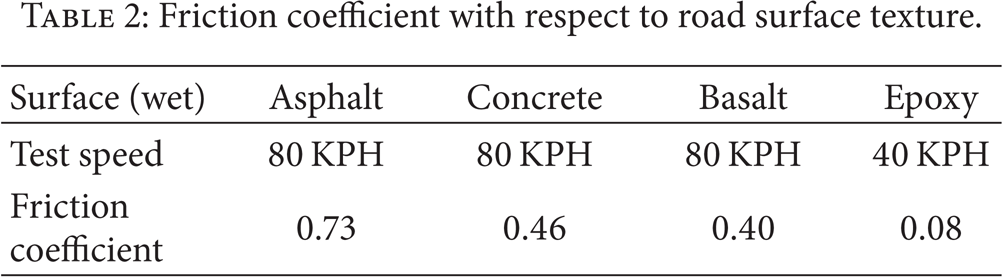
According to test results in Table 2, wet friction coefficients for asphalt and concrete are 0.73 and 0.46 respectively, whereas that for epoxy similar to icy road surface is less than 0.1.
Friction coefficient with respect to road surface texture.
3. Relationship between the Speed of a Car and the Friction Coefficient
In general, traction performances of the tire are represented as a braking distance and a friction coefficient, which is expressed as μ-slip ratio curve. Firstly, the relationship between the friction coefficient and the change of speed will be suggested. As shown in Figure 5, major characteristic values relevant to friction need to be understood [6, 10, 11].

Schematic diagram on friction coefficient and slip ratio curve.
Slip ratio on the axis of abscissa is defined as speed ratio between the car and the wheel as indicated in (2). Peak Friction Coefficient (μ p ) means the highest friction coefficient obtained with respect to the change of slip ratio. Sliding Friction Coefficient (μ s ) denotes the friction coefficient as the wheel under a locked state slides. Braking stiffness relevant to stiffness, foot length, and foot width of the tire is the gradient of friction coefficient on the initial slip ratio. Consider

Slip ratio is the definition to express the degree of the slip arising from the difference between the vehicle speed and the rotational speed of the tire. In case of braking it cannot exceed a value of 1 and generally has a value of approximately 10–20% for ABS vehicles.
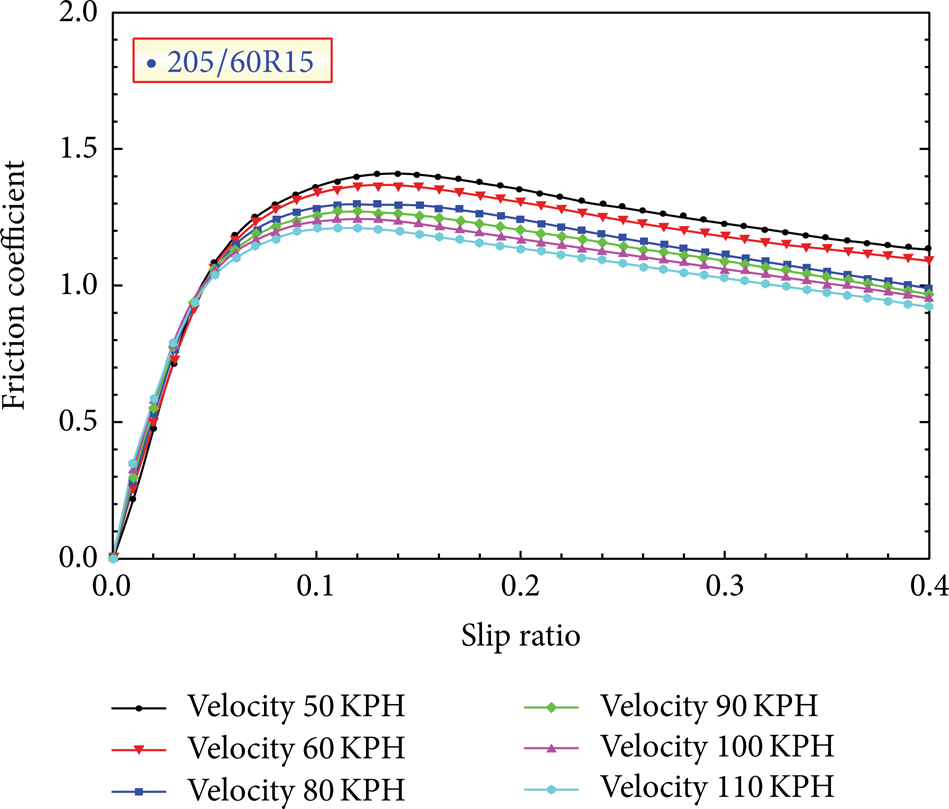
Friction tests were performed for 205/60R15 tire using the DFT with the focus on the change of friction characteristics with respect to the speed of a car [12, 13].
Dynamic friction behavior of the tire with the change of speed from 50 Km/h to 110 km/h is expressed in Figure 6.
Friction characteristic with respect to speed change.
Figure 6 presents a dynamic friction behavior of the tire with respect to the change of speed from 50 Km/h to 110 km/h. From Figure 6, it can be well known that Peak Friction Coefficient (μ p ) and Sliding Friction Coefficient (μ s ) decrease as the speed increases when a car brakes and that the region of slip ratio with a peak friction also decreases [14–16].
4. Theoretical Background
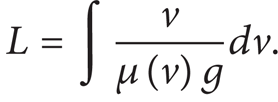
Energy balance (4), kinematic energy of the car (3), and friction energy between the road surface and the car are used to convert the braking distance of the car into friction coefficient. In (3), m and v represent load and speed of the car, respectively. In (4), μ and L denote friction coefficient and braking distance. Consider


Under the assumption that the friction coefficient has a constant value irrespective of the speed, it can be expressed as

If the friction coefficient is the function of speed, two cases will be considered. One is decrement of the friction coefficient in proportion to speed as shown in (7) and the other is decrement of the friction coefficient in exponential function as indicated in (8). Consider


Here μ o is intrinsic parameter which is irrelevant to the speed. A and B are constants. Under the assumption that the friction coefficient is the function of speed, the braking distance can be depicted in
Firstly, if the friction coefficient is a linear function of speed, the braking distance can be obtained as (9) by substituting (7) into (9). This can be also expressed in (11) by developing (10) in Taylor series,
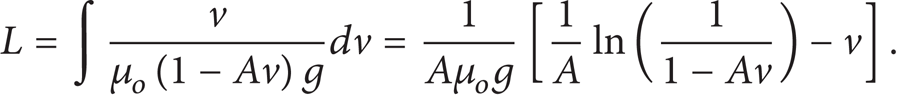
In order to change (10) into (11),


Parameter μ o and constant A can be determined from the gradient and the intercept. If the friction coefficient is an exponential function like (8), braking distance, L, can be developed as follows:

If it is assumed that the value Bv is small fully, (13) can be developed into

From the gradient and the intercept of (15),

The parameter, μ o , and constant B are to be determined. Both a coefficient from a traction trailer and a braking distance from NF Sonata are presented in Tables 3 and 4. By employing the tire of 195/65R14, tests were performed on the wet asphalt road surface with water depth of 1.5 mm.
Change of friction coefficient depending on speed change.

Changes of braking distance with respect to the speed.

As expected, braking performances of tires 1, 2, 3, and 4 are different from each other.
From the test results, it is well observed that mp and ms decrease greatly as the speed increases during braking. This means that a friction coefficient is the function of speed of a car. Table 4 shows changes of braking distances with respect to the speed.
Table 5 provides intercept, gradient, and μ o , values calculated from L/v2 and v plot relevant to (15).
Intercept and gradient adopted in modeling.
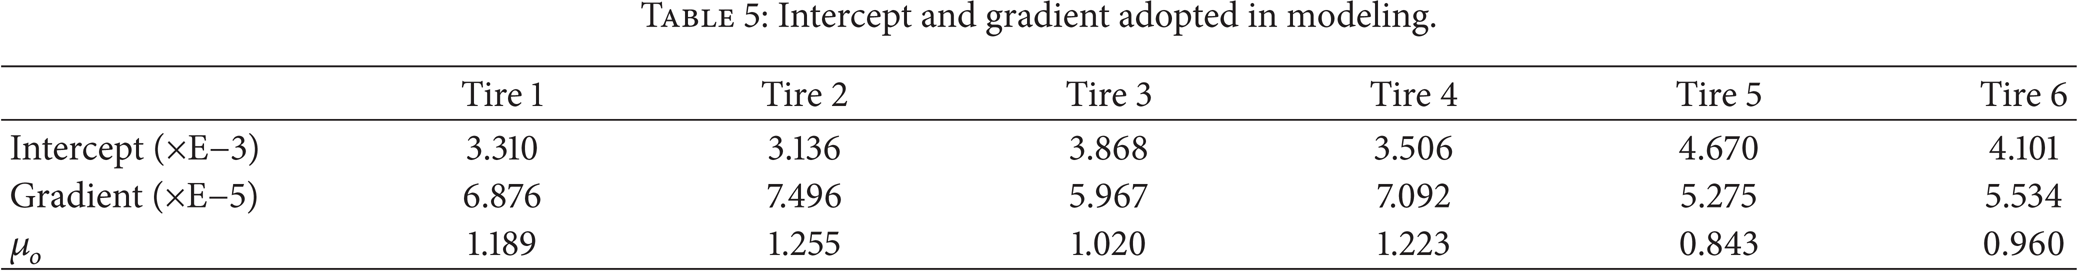
From the results, a braking distance of tire 5 can be expressed as a function of speed as follows:

In case of perfectly elastic body, the braking distance is in proportion to the squares of speed in general. However, the braking distance on the wet road surface becomes far longer than the theoretical value, which is proportional to the squares of the speed. Figure 7 compares the braking distance calculated in this paper with theoretical braking distance, which is proportional to the squares of speed.

Comparison between a theoretical braking distance and one from the model formula with respect to speed change.
From Figure 7, it can be observed that the actual braking distance is much longer than the assuming one where the friction coefficient is a constant value irrespective of the speed. This comes from the fact that the hydroplaning phenomenon appears in a high speed on wet road surface. On the wet road surface, the tire drifts away from the road surface in some degree due to hydroplaning which ultimately causes a loss of grip.
5. Conclusion
For this study, a braking distance as a function of the speed is to be inferred in (16) from test results. Equations proposed in the study are nearly identical to the actual test results. However, equations should be used in limited conditions, because parameters are calculated by adopting the test results under fixed conditions with the specific tire and road conditions. As a result, under conditions with the fixed tire and road conditions, the braking distance can be estimated as a function of the speed of a car by measuring changes of a friction coefficient according to speed change. Moreover, even though the car runs in a high speed, it is still possible to forecast the braking distance.
Conflict of Interests
The authors declare that there is no conflict of interests regarding the publication of this paper.