
Abstract
Sensor-based activity recognition is attracting growing attention in many applications. Several studies have been performed to analyze activity patterns from an activity database gathered by activity recognition. Activity pattern classification is a technique that predicts class labels of people such as individual identification, nationalities, and jobs. For this classification problem, it is important to mine discriminative features reflecting the intrinsic patterns of each individual. In this paper, we propose a framework that can classify activity patterns effectively. We extensively analyze activity models from a classification viewpoint. Based on the analysis, we represent activities as activity graphs by combining every combination of daily activity sequences in meaningful periods. Frequent patterns over these activity graphs can be used as discriminative features, since they reflect people's intrinsic lifestyles. Experiments show that the proposed method achieves high classification accuracy compared with existing graph classification techniques.
1. Introduction
The advances in sensor technology make activity recognition possible. Activity recognition is a technique that automatically recognizes human activities by analyzing senor data [1–6]. Recently, several studies [7–10] have been performed to analyze activity patterns from an activity database gathered by activity recognition. Activity pattern classification is a technique that predicts class labels of people based on activity patterns. The class labels can be not only individual identification but also meaningful groups such as nationalities, genders, jobs, and hobbies. Therefore, activity pattern classification has many applications which vary the class labels accordingly. For example, recommender systems can recommend similar items to users with the same hobbies.
Accurate classification of activity patterns requires a deep understanding of activity patterns. Activity patterns are styles in which people perform their activities and they reflect people's lifestyles. People have both intrinsic and common activity patterns. The intrinsic patterns play a key role in distinguishing each individual from the others. They can appear in individuals’ specific activities in different frequencies [11, 12], orders, days, and periods [13]. In order to find these intrinsic activity patterns, we need to explore activity patterns by adjusting the frequencies in all combinations of days. For example, certain people perform their hobbies on weekends, but others may perform the same hobby once a month.
However, it is hard to explore frequent activity graphs in all combinations of days. This naïve approach requires a very long running time and produces redundant frequent patterns. The lifestyle of people is itself a solution to solve this problem. People usually repeat similar activity patterns in specific periods such as daily, weekly, monthly, and yearly. Therefore, we only need to explore activity patterns from every combination of days in specific periods. By avoiding the exploration of meaningless combinations, we can reduce the search space in order to find discriminative features. From a classification viewpoint, these features are as effective as the features from all the combinations of days.
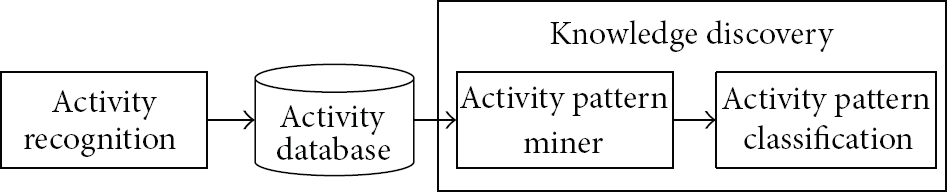
The other important point is to determine pattern types for activity pattern classification. The types are determined depending on activity data models. Various activity data modeling studies have been proposed to represent activity data collected from sensors such as statistics, sequence, and graph-based modeling. Statistics-based activity models [7, 8] calculate the average frequency or duration of each activity. Sequence-based activity models [9] represent activities as daily sequences based on the occurrence time. Graph-based activity models [10] generate activity graphs by combining activity sequences in various periods such as daily, weekly, monthly, and yearly. Nodes and edges of the activity graphs represent activities and the occurrence order between two activities, respectively. Among these modeling techniques, the graph-based activity model is suitable for the activity pattern classification problem. This model can maintain sufficient information to mine the intrinsic activity patterns such as frequencies and occurrence orders and various meaningful periods of activities.
In this paper, we propose a novel feature selection framework for classifying activity patterns effectively. The proposed framework generates activity graphs by combining all combinations of daily activity sequences in each meaningful period. By performing frequent subgraph mining over these graphs, we can find all discriminative frequent activity patterns efficiently, which can reflect individuals’ intrinsic lifestyles. In order to remove redundant frequent patterns, we select highly discriminative features by adopting topological similarity based feature selection (TSFS) [14]. Since topologically similar graphs involve similar activity patterns, we can effectively remove redundancy. Through experiments, we show that the proposed framework can achieve a high performance in classifying activity patterns.
The remainder of this paper is organized as follows. We briefly introduce the existing activity modeling and graph classification studies as related work in Section 2. We analyze the effectiveness of various types of activity patterns in Section 3. In Section 4, we define the activity pattern classification problem and propose our feature selection framework in detail. Section 5 presents the experimental results of the proposed framework, and Section 6 concludes this paper.
2. Related Work
Activity recognition has gained a lot of interest in recent years due to its potential and usefulness in context-aware computing such as smart homes [3–6] and aged care monitoring [7, 8]. The purpose of activity recognition is to infer people's behaviors from low level data acquired through sensors in a given setting, from which other critical decisions are made. There are two approaches to acquire human activities using sensor systems. First, sensors are attached on the body and the signal readings are interpreted [1, 2]. This approach can recognize low level activities such as “sitting,” “running,” and “walking.” Second, sensors are deployed to objects and devices in the environment and the sensor readings are interpreted [3–6]. This approach can recognize high level activities such as “eating,” “sleeping,” “showering,” and “leaving home.” The low level activities are used for short-term activity monitoring such as the elderly falling down. The high level activities are used for long-term activity pattern monitoring such as healthcare.
Mining techniques generally require appropriate data models to find informative patterns to improve effectiveness or efficiency. Various studies have been proposed to represent activity data collected from sensors such as statistics, sequence, and graph-based modeling. Statistics-based activity models [7, 8] calculate the average frequency and duration of each activity. Large deviations from the average time or number are considered abnormal activity patterns. Sequence-based activity models [9] represent activities as daily sequences based on the occurrence time. Sequential pattern mining techniques can be applied to activity sequences to mine informative patterns. The graph-based activity model [10] generates activity graphs by combining the daily activity sequences in every monitoring period. The activity graphs can maintain various activity related information through multilabels of nodes and edges such as frequencies, time, durations, and locations of activities. The main advantage of this activity model is that we can analyze activity patterns in various frequencies and periods.
Graph classification studies [14–18] have been proposed to classify graph modeled data such as chemical compounds, social networks, and XML documents. The techniques represent graphs as feature vectors with values indicating the presence or absence of graph structural features, and a discriminative power of each feature is estimated by feature evaluation criteria including G-tests and information gain (IG). The graphs are then classified by using a machine learning classifier.
The existing techniques mostly adopt frequent subgraphs as graph structural features for classification. Many efficient frequent subgraph mining algorithms have been proposed such as FSG [11] and gSpan [13]. These algorithms enable us to extract frequent subgraph features in practical time. TSFS [14],
3. Analyzing Activity Patterns in Various Activity Data Models
Individual lifestyles are hidden in one's frequently performed activity patterns. It has also been shown in literature [19] that frequent patterns are highly discriminative in various classification problems. Therefore, we adopt frequent patterns as features for this activity pattern classification problem.
Frequent patterns involve different information depending on data models. The representative models for activity data are statistics-, sequence-, and graph-based models. In these models, frequent activity patterns include the frequency of activities, frequent activity sequences, and frequent subgraphs, sequentially. We analyze a discriminative power of each type of frequent activity pattern.
The frequency of activities does not involve enough information for activity pattern classification, because it cannot express the occurrence order among activities. People can have similar frequencies but different activity orders. Therefore, the occurrence order is very valuable information. For example, Figure 2 shows parts of activity sequences in two consecutive days. The frequencies of “sleeping,” “eating,” and “toileting” are 4, 1, and 1 in the activity sequences. From this information, we cannot perceive that the person is suffering from insomnia. This kind of distinct patterns can be helpful in distinguishing people.
Frequent activity sequences involve the occurrence order of activities. However, the orders are valid only in their own sequences, because we have fractions of sequences. Occurrence order relationships among activity sequences, especially when a sequence shares common segments, can provide a more precise occurrence order among activities of different sequences. For example, we can interpret the activity sequences as two different meanings in Figure 1, that is, “eating or toileting” or “eating and toileting” in the middle of sleeping.

Sequence- and graph-based activity data models.
Overview of the proposed method.
Frequent activity subgraphs represent the occurrence order of activities together in multiple activity sequences from various periods. From these graphs, we can get the occurrence order of activities at a similar time in different periods, which is useful knowledge for activity pattern classification. For example, we can accurately interpret an individual's activity patterns as “eating or toileting in the middle of sleeping” from the activity graph in Figure 2.
4. Classifying Activity Patterns Based on Activity Graphs
The proposed method uses activity database accumulated with unit activities recognized from various sensors. In this paper, we assume unit activities are recognized exactly. We present the proposed feature selection framework for activity pattern classification. In Section 4.1, we define an activity pattern classification problem. We analyze discriminative activity graph features in Section 4.2 and suggest a method that mines the discriminative features efficiently in Section 4.3. In this paper, our scope is limited to knowledge discovery process in Figure 2.
4.1. Notation
In this section, we present notations related to the activity graph approach [8] and the formal definition of the activity classification problem.
Definition 1 (unit activity).
A unit activity,
Definition 2 (activity sequence).
An activity sequence,
Definition 3 (modeling period).
A modeling period,
Definition 4 (combination days).
Given the modeling period, p, the combination days of p are the all possible combinations of days in p, that is,
Definition 5 (activity graph).
An activity graph,
Activity sequences are generated every day. In order to represent activities of more than one day concisely, we combine corresponding activity sequences and generate activity graphs using multiple sequence alignment (MSA) [18]. The number of combined sequences is determined depending on the modeling period, p, and combination days, c.
Figure 3 is an example of an activity graph generated using MSA, when p is 3. MSA first combines the activity sequences (

Generating an activity graph by MSA.
Definition 6 (activity pattern classification).
Given the set of activity sequences,
Definition 7 (frequent activity pattern).
A frequent activity pattern, f, is a subgraph of f that occurs no less than the minimum support. A support of subgraph f, denoted by support (f), is calculated as
Definition 8 (discriminative feature).
Given the set of activity graphs,
In this paper, we focus on mining discriminative features for activity pattern classification. In order to mine these features efficiently, we represent activity data as activity graphs by combining every combination of daily activity sequences in each meaningful period and find frequent subgraphs,
4.2. Discriminative Activity Graph Features
Based on the activity pattern analysis in Section 3, we adopt a graph-based activity data model for classifying activity patterns. In this section, we present the way in which discriminative activity graph features are mined efficiently.
People have their own intrinsic lifestyles that are expressed by activity patterns in different frequencies, orders, days, and periods. Therefore, we should generate activity graphs by combining all combinations of daily activity sequences and perform frequent subgraph mining on the activity graphs so that we can find all discriminative frequent subgraphs.
However, exploring frequent subgraphs from all of these activity graphs is very inefficient, since it requires a long running time and many redundant frequent subgraphs are mined. In order to solve this efficiency problem, we observe people's lifestyles. People repeat similar activity patterns in specific periods according to their own lifestyles. For example, office workers go to their companies on weekdays and have religious activities on the weekends. They may climb a mountain as a hobby every month. Through this observation, we claim that the frequent subgraphs of the combinations of days in a specific period have similar discriminative powers compared with the frequent subgraphs of all combinations of days.
Theorem 9.
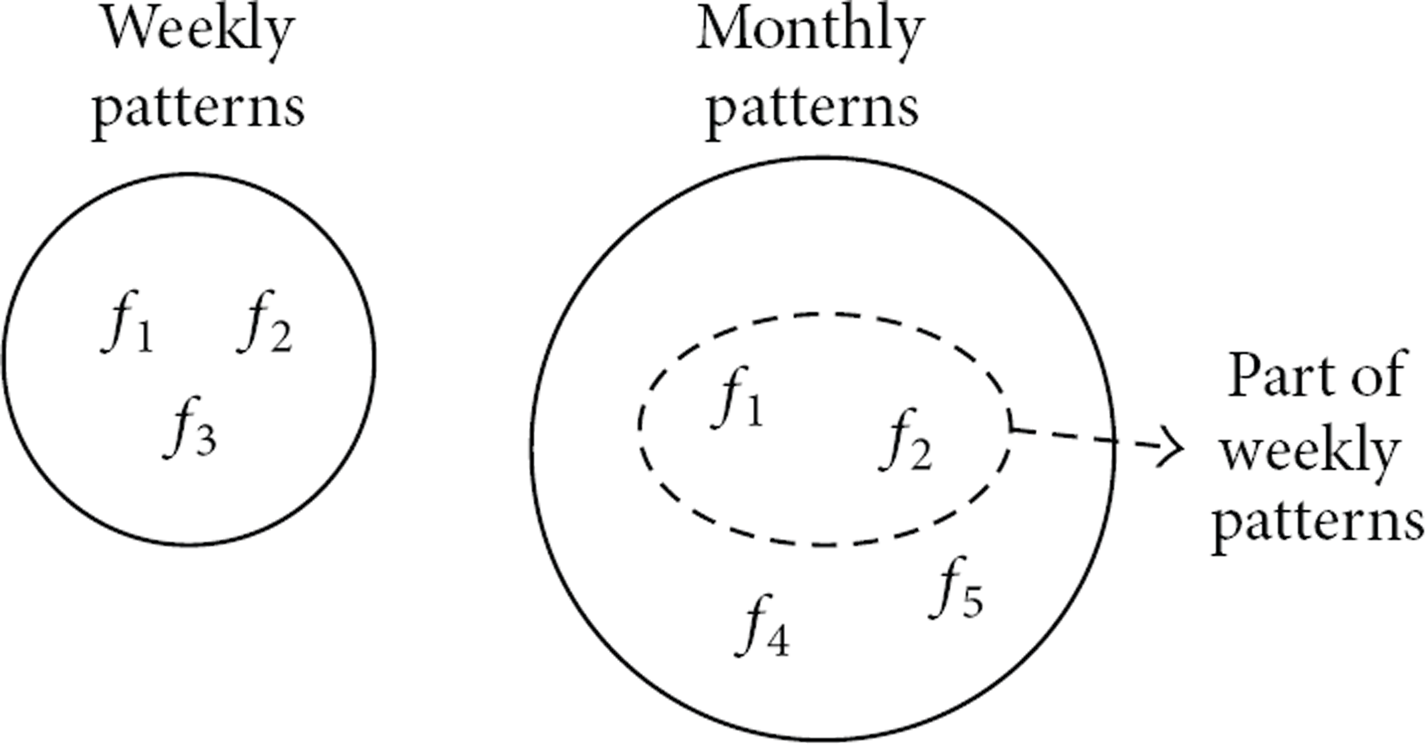
For each p, given the set of activity graphs,
Proof.
Suppose that we generate all possible combinations within a modeling period; each combination of an activity sequence is unique. Moreover, daily activity sequences are different in a specific period. Therefore, we generate different graphs with each combination of days of
Theorem 10.
Given the set of activity graphs,
Proof.
We prove it by contradiction. Suppose that a set of frequent subgraphs,
We present an example explaining Theorem 9. Figure 4 shows two sets of frequent subgraphs,
Discriminative patterns in various modeling periods.
Observation 1.
People repeat similar daily activity sequences in specific periods according to their own lifestyles; that is,
Claim 1.
Given all the activity sequences for n days,
Proof.
Based on Observation 1, graph set,
As we observed above, people repeat similar activity patterns in very specific periods; that is,
4.3. Mining Discriminative Features
Based on Claim 1, we mine frequent subgraphs in the activity graphs generated in every
Figure 5 shows the processing steps of mining frequent subgraphs when

Processing steps of mining frequent subgraphs.
Though we generate activity graphs with all possible combinations within the periods,
Figure 6 shows an example in which duplicate graphs are generated with all possible combinations in a set of modeling periods,

Example of duplicate graphs generated with a set of modeling periods.
After generating activity graphs, frequent subgraph mining is performed on the activity graphs to extract frequent activity patterns. A number of duplicate frequent subgraphs occur, since activity graphs are generated from the same activity sequences. Many of them have similar graph structures to each other. These redundant patterns degrade the performance in both the accuracy and running time of the classification.
We select highly discriminative features by removing the redundant frequent subgraphs. A number of feature selection methods [14–20] have been proposed. Among them, we adopt the TSFS approach [14]. This approach has proved that topologically similar graphs have similar discriminative powers and a method has been proposed that selects discriminative subgraphs by clustering frequent subgraphs based on their similarity. TSFS is very suitable for an activity pattern classification problem since similar activity graphs involve similar activity patterns.
We generate frequent subgraph clusters,
Figure 7 shows a processing step that selects highly discriminative features from a set of frequent subgraphs,
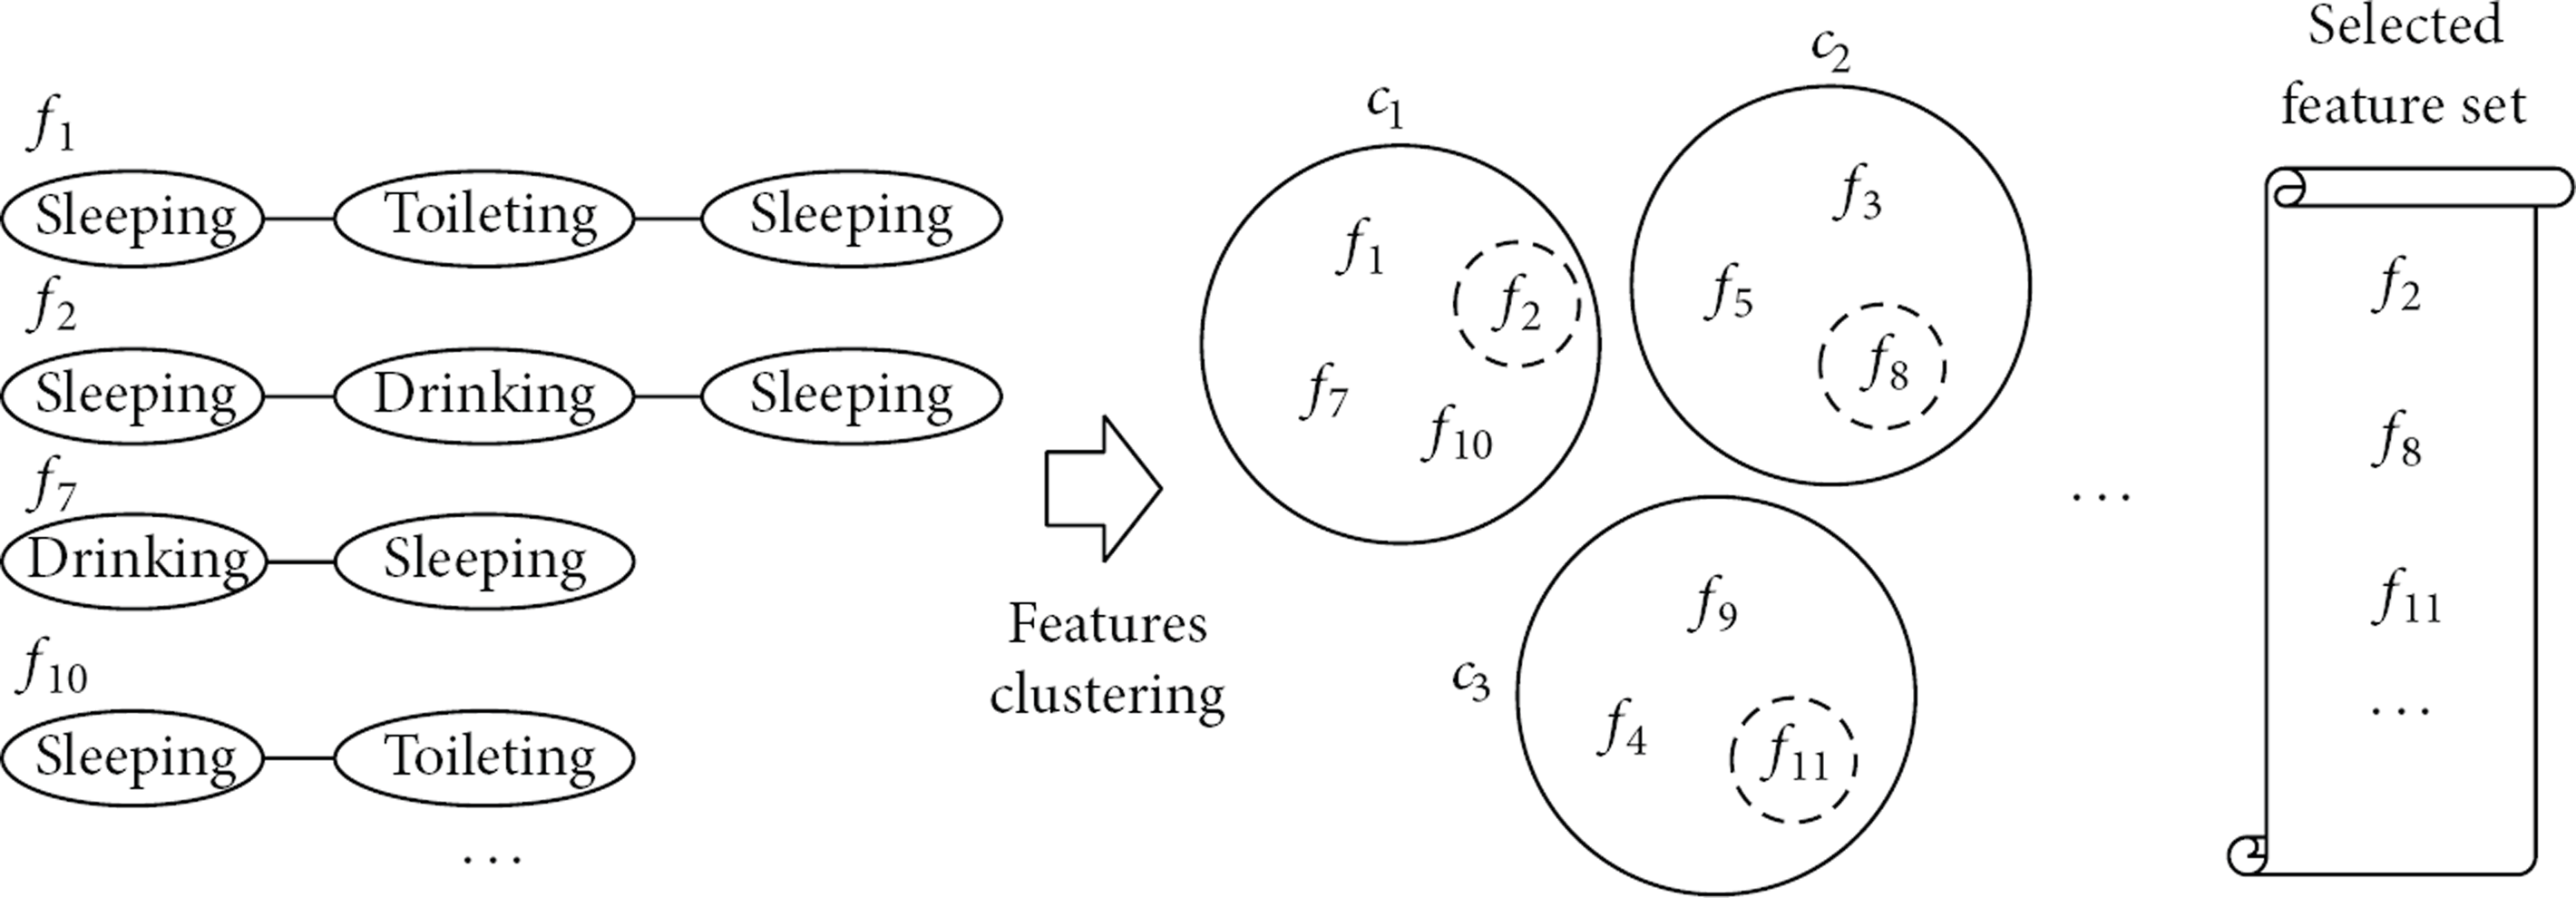
Feature selection based on topological similarity.
We then convert each activity graph,

Algorithm 1 is the pseudocode for mining highly discriminative features and training an activity pattern classifier. Algorithm 1 takes the set of activity sequences, S, the minimum support,
min_sup: A minimum support threshold H: An activity pattern classification model (1) (2) (3) Divide S by modeling period p (4) (5) generate graph g with (6) (7) (8) (9) (10) (11) choose the highest discriminative feature, (12) (13) Generate feature-graph matrix, M, by using (14) Train model H using (15)
5. Experiments
In this section, we experimentally evaluate the effectiveness of our feature selection framework on a real dataset.
5.1. Experimental Setup
Due to the lack of activity datasets using sensor-based activity recognition, we gathered a real activity dataset for the experiments. The dataset was gathered by eight Kyung Hee University students for a year. Users inputted their activities manually on the activity gathering system. Figure 8 shows the interface of the system, where each activity is inputted with properties such as activity type, duration, and time. The dataset for each student contains more than 2,000 activities and consists of 19 target activities, as shown in Tables 1 and 2.
Description of dataset.

Target activities of dataset.


The web interface of the activity gathering system.
In order to show the effectiveness of our method, we conduct the following experiments. Modeling periods, p, are set to 1, 2, 5, and 7, meaning a day, a weekend, a weekday, and a week, sequentially. To classify activity patterns, we use user IDs for class labels and perform fivefold cross validation using an SVM classifier:
effectiveness of graph features: comparison of classification accuracy among features from various activity data modeling methods, the best minimum support threshold for frequent activity subgraphs: comparison of classification accuracy in various minimum supports, discriminative features in each period: comparison of classification accuracy between proposed method and naïve method extracting features in a single period, effectiveness of TSFS: comparison of classification accuracy among feature selection algorithms, top-k, MMRFS [19], and TSFS, ineffectiveness of conventional graph classification: comparison of classification accuracy between the proposed method and conventional graph classification algorithms such as the model-based search tree
5.2. Effectiveness Evaluation
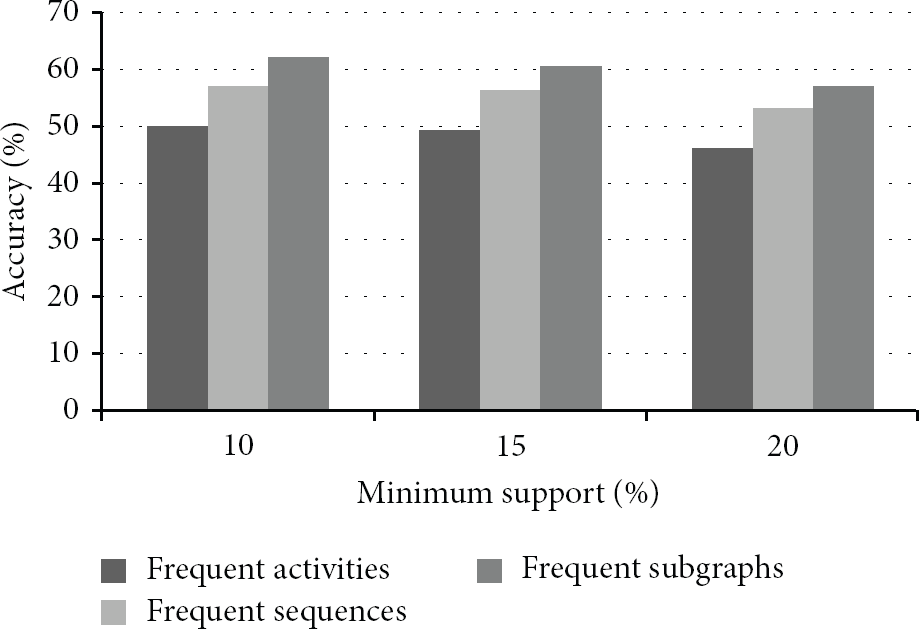
The first experiment aims to show the effectiveness of graph features. We compare classification accuracy among features mined from statistics-, sequence-, and graph-based activity data modeling. We select the top 60 discriminative frequent activity patterns as features in each modeling technique. We mine the frequent activity patterns with various minimum supports such as 10, 15, and 20. We set the modeling period to 7 for generating activity graphs.
In Figure 9, the graph-based activity modeling outperforms other modeling techniques over all the minimum supports. As we explained in Section 3, graphs involve sufficient information such as the order of activity occurrences and relationships among activity sequences. This experiment demonstrates that graph-based activity modeling is suitable for an activity pattern classification problem.
Comparison of the accuracy among modeling techniques.
The second experiment aims to select the best minimum support threshold for mining frequent activity subgraphs. We vary the minimum support when the topological similarity,
In Figure 10, the highest classification accuracy is 72% when the minimum support is 10%. Frequent subgraphs with a small minimum support appear in most of the graphs having any class labels. Frequent subgraphs with a large minimum support appear only in a few graphs. Therefore, frequent subgraphs with too small or too large of a minimum support cannot have high discriminative powers. We chose to set the minimum support threshold to 10%.
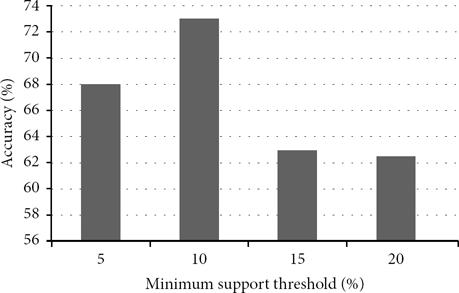
Comparison of the accuracy with various minimum support thresholds.
The third experiment aims to show that discriminative features are involved in each period. We compare classification accuracy between a fixed period and various periods. We set the fixed period to 7 and the various periods to
In Figure 11, the results show that frequent subgraphs mined in activity graphs with various periods are highly discriminative according to Theorems 9 and 10. In all the period settings, the proposed method achieves better classification accuracy compared with the fixed period, except for
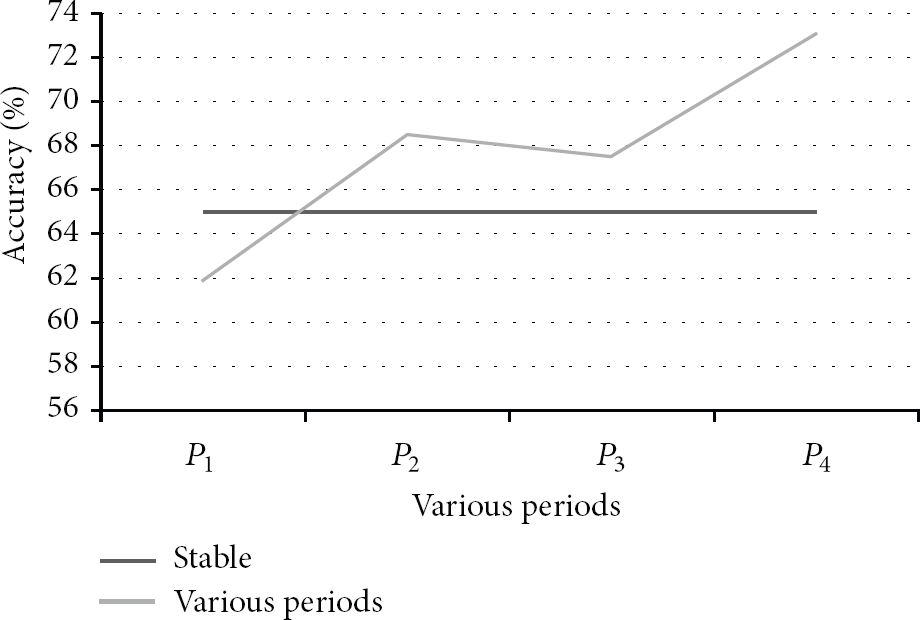
Comparison of the accuracy with various period settings.
The fourth experiment aims to show the effectiveness of TSFS. We compare the classification accuracy among feature selection algorithms, Top-k, MMRFS, and TSFS. We use the same number of features for all the feature selection algorithms. We vary the topological similarities by 65%, 70%, 75%, and 80%.
In Figure 12, the results show that TSFS achieves the highest classification accuracy compared with Top-k and MMRFS over all of the topological similarities. Particularly, TSFS achieves the highest accuracy when the topological similarity is set to 70%. A loose topological similarity loses discriminative features because many features belong to one cluster. A tight topological similarity incurs redundant features because too many features as clusters are generated. From this experiment, we can observe that topologically similar activity graphs involve similar activity patterns.

Comparison of the accuracy according to feature selection techniques.
The fifth experiment aims to show the ineffectiveness of conventional graph classification algorithms for the activity pattern classification problem. We compare the classification accuracy with representative graph classification algorithms, MbT and MMRFS.
In Figure 13, the proposed method achieves a classification accuracy that is about 5% higher than the existing algorithms. The existing algorithms do not consider frequent patterns from various periods, since they are developed for other graph data such as compounds, web page link networks, and social networks. Moreover, the existing algorithms cannot remove redundant frequent activity patterns well, since they do not consider the topological similarity for feature selection.

Comparison of the accuracy between graph modeling techniques.
6. Conclusion
Classification is an important technique for analyzing activity data. We have defined the activity pattern classification problem and proposed an effective feature selection framework for classifying activity patterns. We have shown that a graph model is effective for activity pattern classification because the activity graphs reflect individuals’ specific activities in different frequencies, orders, days, and periods. By analyzing the lifestyles of people that repeat similar activity patterns in specific periods, we have proposed an effective and efficient feature selection technique. We select frequent activity patterns in all combinations of daily sequences in meaningful periods.
Experimental results have shown that the proposed method achieves (1) suitable model for activity pattern classification, (2) better discriminative power extracting combinational features than that extracting features in a single period, and (3) higher accuracy than that of existing graph classification methods. In addition, we discussed the optimal thresholds of minimum support and topological similarity for activity pattern classification.
Footnotes
Conflict of Interests
The authors declare that there is no conflict of interests regarding the publication of this paper.
Acknowledgment
This work was supported by the National Research Foundation of Korea (NRF) grant funded by the Korea government (MEST) (No.2012R1A2A2A01047478).