
Abstract
To study the fuel gas combustion hazards, the methane/air flame structure and flow characteristic in an open duct influenced by a rectangular obstacle were explored by experiment and realizable k-∊ model (RKE). In the test, the high-speed schlieren photography technology and dynamic detection technology were applied to record the flame propagation behavior. Meanwhile, the interaction between flame front and flame flow field induced by the obstacle was disclosed. In addition, the laminar-turbulence transition was also taken into consideration. The RKE and eddy dissipation concept (EDC) premixed combustion model were applied to obtain an insight into the phenomenon of flow change and wrinkle appearing, which potently explained the experimental observations. As a result, the obstacle blocked the laminar flame propagation velocity and increased pressure a little in an open duct. Some small-scale vortices began to appear near the obstacle, mainly due to Kelvin-Helmholtz instability (KHI), and gradually grew into large-scale vortices, which led to laminar-turbulent transition directly. The vortices thickened the reaction area and hastened the reaction rate; reversely, the higher reaction rate induced larger vortices. The RKE model result fitted the test data well and explained the wrinkle forming mechanism of two special vortices in the case.
1. Introduction
As an important alternative energy, natural gas was more and more widely used in combustion field and power system. The management on transportation of fuel gas played a key role in the safe and effective application of natural gas, which may cause gas fire and explosion, for example, a fuel pipeline explosion in Qingdao, east China's Shandong Province in November 22, 2013; more than 60 people were killed and 180 injured after the leaking pipeline caught fire and explosion. Incident statistics data of fires and explosions showed that flammable gas was involved in 90% of the total accidents, which was one of the most destructive accidents in industry and living field. To discern gas explosion and flame propagation mechanism, many researchers paid great attention to the phenomenon of fuel gas explosion by tests and mathematical simulation methods.
Numerous industrial incidents showed that the gas explosions were usually induced by faint ignition. Although flame propagation velocity was small enough at the beginning of the explosion, environment conditions and some external factors may accelerate flame propagation and enhance explosion intensity greatly [1–3]. Generally, in the case of accidental ignition, the transition from laminar flame to turbulent combustion took place firstly and following accelerated the flame propagation speed, which increased the combustion surface area and heat release rate, and finally caused serious explosion disaster due to the rapid overpressure rise. Under many conditions, gas explosive intensity was mainly laid on the flame propagation velocity; therefore, flame acceleration characteristic usually became a focus of gas explosion study. In practical gas explosions, for example, in complex plants, the premixed flame propagating away from an ignition source may encounter obstacles with various shapes and boundaries along the path. The unsteady coupling of the moving flame and the flow field induced by the presence of local blockage may produce vortices with different length and velocity scales ahead of the flame front. The flame vortex interaction caused the initially laminar flame to turbulent combustion transition and thus accelerated the flame propagation and hastened the pressure rise rate [4, 5].
As a direct factor inducing the deflagration-to-detonation transition (DDT), the influence of obstacles was discussed by many scholars, most of which mainly focused on trigger condition to DDT with single or multiple obstacles and the damage effect of DDT. But these studies rarely involved the effects of obstacles on flame transformation process in the early stage before DDT performing [6–8].
Lots of experimental and numerical investigations of flame vortexes induced by obstacle aimed at explaining the mechanisms responsible for its formation [8–22], including the experiment study on acceleration of flame front [12, 15], overpressure [9, 10, 13, 14, 16], influence of blockage ratio [16], and obstacle shapes [9]. Flow field and reaction rate were also studied by numerical simulation [17–22]. However, most studies focused on methane/air premixed flame propagation in a closed duct. The dynamics of the flame and pressure behavior in open duct were discerned to be quite different from the case in a closed duct. In this study, the flame front structure behavior and the effect of obstacle on flame propagation were explored. Moreover the mechanism of vortexes appearing and the wrinkle forming at the back of obstacle were taken into deep consideration.
In order to understand and predict the hazards and risks associated with gas explosions influenced by obstacle in an open duct, a small-scale experiment and predictive numerical simulation model were essential [23]. In contrast to simple empirical or lumped-parameter models, the CFD model was much more feasible to detect the inner dynamics and effect of explosion flame by taking into account the interplay between flame propagation and flow field.
Turbulent premixed combustion was involved in a range of engineering applications, including boilers, furnaces, gas turbine combustors, industrial burners, and spark ignition engines. The turbulent flow behavior in gas explosions was usually a major issue in chemical and process industries [22]. Due to the development of computational method, tiny grid was also usually applied in combustion simulation. In this study the realizable k-∊ was used as turbulence model, and the reaction model was eddy dissipation conception model. Realizable k-∊ model was substantially superior to the standard k-∊ model in many applications, which generally brought forth much more accurate data [24]. As a compromise of accuracy and computational time cost, the EDC was successfully applied in different regimes of combustion [25–27] by using detailed reaction mechanism.
2. Experiments
2.1. Experimental Set-Up
In order to acquire the flame propagation characters, the experimental set-up was schematically shown in Figure 1, which was composed of a semivented explosive pipe, a gas mixing system, an electrode ignition system, a synchronous control system, a data acquisition station (DAS), and a high-speed schlieren and camera system.

Schematic of experimental system. 1: combustion pipe; 2: explosive vent; 3: iodine-tungsten lamp; 4: convex lens; 5: reflector; 6: concave mirror; 7: knife-edge; 8: ignition electrode; 9: high frequency pressure sensor; 10: DAS; 11: synchronous controller; 12: high-speed camera; 13: initiator; 14: gas equipment; 15: vacuum pump.
The explosion pipe was a cuboid with an open vent, which was 50 cm long and the cross-section dimension was 8 cm × 8 cm. An ignition electrode was set up at 6 cm away from the right end, and a high frequency pressure sensor was set up at 42 cm away from the right end to collect pressure history data. The recording data would be processed by the software Lab View. Moreover, a high-speed camera was applied to record the schlieren photography of the combustion flow field instantaneously with a recording rate of 20,000 frames/second at a resolution of 512 × 512 pixels. The synchronization controller was used to control the electrode ignition system, DAS, and high-speed photography system.
2.2. Experimental Conditions
Combustible gas: premixed methane/air with φ = 1; rate of the opening vent area: 25% of cross-section; blockage area ratio: 50%; the ignition voltage: 580 V; the initial temperature: 278 K; the initial pressure: atmospheric pressure; high speed camera shutter: 1/12000 s.
2.3. Experimental Procedure
The methane/air premixed gas was firstly prepared under a certain equivalence ratio and then be pumped into the open venting pipe. Finally, the premixed gas was ignited by the high voltage ignition electrode; meanwhile the DAS and high-speed photography system began to capture pressure data and the schlieren photographs of flame propagation process Figure 2.

Schematic figure of experimental procedure.
3. Numerical Models
3.1. The Governing Equations
Unsteady compressible flow with premixed combustion was governed by the reactive Navier-Stokes equations, including the conservation equations for mass, momentum, energy, and species, and the constitutive and state equations. The governing equations were employed here for the realizable k-∊ model, which improved the ability of the normal k-∊ model to predict complex turbulent flows [24].
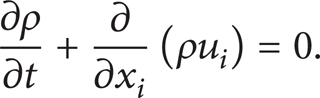
Mass conservation equations:
Momentum conservation equations:

where τ ij = − |2/3|μ(∂u k /∂x k )δ ij + μ((∂u i /∂x j ) + (∂u j /∂x i )) and δ ij = 1 if i = j, 0.
Energy conservation equations:

where q
i
= − λ(∂T/∂x
i
) + ρ∑k = 1
N
h
k
Y
k
V
k, i
and
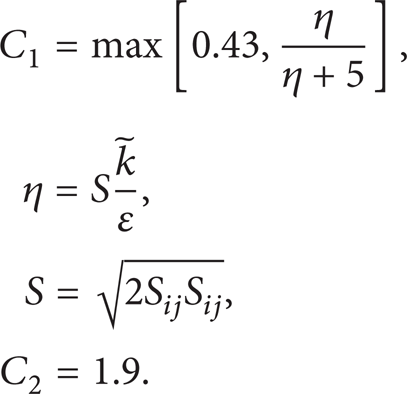
Turbulence modeling with the two-equation realizable k-∊ model was recommended for axis symmetric jet flows [24, 28]. The realizable k-∊ model contained a new formulation for the turbulent viscosity. A new transport equation for the dissipation rate ∊ was derived from an exact equation for the transport of the mean-square vorticity fluctuation:

where
3.2. EDC Model
In combustion simulation, the physical and chemical processes were of great importance, both of which acted in vastly different time scales; moreover, the chemical process covered the entire time scales of the physical process [27]. The eddy dissipation concept (EDC) model with an extension of eddy-dissipation model and detailed chemical mechanisms in turbulent flows was included. The reaction was assumed in small turbulent structures in fine scales. The EDC relied on the Kolmogorov cascade of energy dissipation on all scales in turbulent flows from the largest eddies to the smallest ones. The chemical reactions, as well as molecular mixing associated with turbulence dissipation, occurred within fine flow structures, where the reactants were homogenously mixed, similarly to a well stirred reactor.
In the EDC model, the smallest eddies with an extensive expression was shown as

For these scales, dissipation of turbulent kinetic energy

One recognized that γ was solely obtained from turbulence magnitudes as

The chemical reaction was represented by an isobaric, adiabatic, perfectly stirred reactor, which means that the radiation from the fine structures was neglected. The mixing rate 1/г characterized an open reactor vessel with the retention time г [26]. This reactor was described by


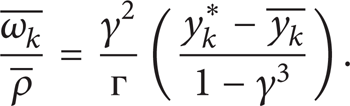
The mixture exchange of the reactive and the inert portion was modeled by γ2/г as proposed by Gran and Magnussen [26]. The required expression for the mean reaction rate

By using (10), (11) could be rewritten with cell-averaged values:
According to the implementation of the EDC model in the CFD code, it was notable that the expression χ, as shown in Magnussen's original expression of formulas (10) and (11), was set to unity as proposed by Rehm et al. [27].
4. Result and Discussion
4.1. Experimental Phenomenon Analyses
4.1.1. High-Speed Schlieren Images
Figure 3 shows a sequence of high-speed images of flame propagation during the course of explosions, as the CH4/air premixed gas concentration was 9.5% (φ = 1). The time represented the elapsed time after ignition and subsequent flame images were obtained since t = 3 ms to t = 105 ms. The flame in the early stages, from t = 3 ∼ 70 ms, propagated forward like an expanding sphere bubble from the central ignition point at the left side of the duct.

High-speed schlieren images of premixed methane/air flame propagation.
Before t = 70 ms, the flame was purely laminar and the flame front propagated from left to the right in hemispherical profile. When the flame structure approached the obstacle at t = 75 ms, the curvature of flame front turned to increase, mainly due to the variational pressure distribution in the area in front of the obstacle. As seen from the image at t = 80 ms in Figure 3, interestingly, the flame front did not touch the obstacle but rounded it. Through the experimental phenomenon, it is sure that, due to the low pressure in an open duct, the pressure drag in the upper duct without obstacle was small enough, which caused the flame front to pass over the obstacle fleetly. It was quite different from what was exhibited in the closed duct [9–16].
The flame shape turned to be sharp and the curvature became larger. As the flame front propagated towards the obstacle, the gas flow ahead of the flame was pushed across the obstacle. After flame front passed by the obstacle, small-scale vortexes appeared at flame front bottom. Figure 4 shows the formation of small-scale vortexes at t = 83 ms, where the perturbations occurred at the lower boundary and the flame sheet rolled-up by stream vortices. It was usually believed that the Kelvin-Helmholtz instability (KHI) led to the perturbations and vortexes [28]. The Kelvin-Helmholtz instability usually occurred when velocity sheared in a single continuous fluid or when a velocity difference ran across the interface between two fluids [29, 30]. In this test there was heat and mass transfer across the interface, and both fluids were taken as viscous with different kinematic viscosities. Thus, a shear layer between burned gas and unburned gas would play a vital role in flame instability. As induced by KHI effect, small-amplitude perturbations appeared near the lower boundary of flame.
Development of a flame rolled-up in a vortex (t = 83 ms).
Moreover, the flow velocity in burned area was larger than the flow velocity in unburned area in the downstream direction. As a result, the flame front scrolled down, as shown in Figure 4. With flame propagation, small-scale vortexes turned to large-scale vortexes gradually, as exhibited in images at t = 85–87 ms. As the reaction rate increased sharply, flame front propagated toward the back of the obstacle rapidly. Finally, the large-scale eddies were destroyed and induced the transition from laminar to turbulent flow at t = 92–105 ms.
With the vortexes forming, a wrinkle appeared in the image at t = 87 ms, which was induced mainly by the change of flow field. To explain the phenomenon wholly, some dynamic mechanisms should be taken into account besides the high-speed schlieren images.
4.1.2. Overpressure and Flame Propagation Velocity
Generally, explosion pressure and the rise rate were usually considered in gas explosion characteristics. In this test, no noticeable pressure rise appeared ahead of the flame front during flame propagation in the duct. The overpressure peak was 0.019 MPa at t = 12.8 ms, which was much less than in other similar cases, as shown in Figure 5. The small pressure drag induced by explosion was released adequately in the duct and the thermal expansion played a leading role in the pressure section, where the pressure curve was in a downward trend.

Overpressure, flame propagation velocity, and velocity acceleration versus time.
The flame velocity in Figure 5 was obtained by measuring the displacement of flame front in high speed schlieren pictures among unit time. As obstacles were set in the duct, the flame propagation speed, as shown in Figure 5, fluctuated intensely behind the obstacles. It is well known that flame speed usually increased when the flame climbed over an obstacle due to the thermal expansion of the burned gas. However, the flame speed behind the obstacle decreased because of the eddy effect, which could increase again when the eddy was destroyed. The destroyed eddy in turn hastened the turbulence intensity and the combustion reaction [31]. In contrast, the flame velocity ascent after passing the obstacle was quite different from the flame acceleration in the early stage, which get an approximate logarithmic correlation with time, and the fitting formula could be indicated as a = 215.37ln (t) + 913.57.
Based on the results above, it was believed that the eddy momentum behind the obstacle caused the decrease of the flame velocity, while the turbulent diffusion in the wake of eddy destruction led to the increase of flame speed. Results showed that the obstacle only slowed down the flame for a short while but led to the increase of the flame speed eventually.
4.2. Numerical Simulation
The overpressure peak simulated from RKE model was 0.0187 MPa at t = 26.9 ms, which was slightly lower than that in experimental data, as shown in Figure 6. However, in the numerical simulation, the second wave crest was higher than the first one. The time of overpressure reaching the peak was much different from the experiment. Even so, the trend of overpressure trace from simulation agreed with the experimental data well, which was helpful to correct numerical simulated by RKE and EDC model.

Overpressure simulated by RKE model and experimental data.
Combustion was initiated by the spark plug and a flame propagated radially with a spherical shape until the flame reached the end duct wall behind the spark plug, as shown in Figure 7. The development of flame front structure and temperature fields distribution in the duct were obtained at t = 5 ∼ 80 ms. Figure 7(f) reflected the flame shape at t = 72 ms when flame front was passing by the obstacle. Nevertheless, the flame front passing by the obstacle at t = 80 ms shown in Figure 3 showed that the speed of flame propagation is slightly faster than that in the experiment.

Flame shape at the central plane of the combustion duct from simulation.
The flow field dynamic behavior is related to the velocity vector. The velocity vector in each note reflected the flow behavior distinctly, by using formula

Streamtraces of flow field reflected by linking the velocity vector.
As shown in Figure 8(a), the flow in unburned area mainly presented a counter-clockwise order vortex in the early stage of flame propagation without turbulent flow yet.
The velocity direction of unburned flow was different from flame propagation at the lower flame front, where a velocity shear layer came into being, similar to the discussion in experiment section. Therefore, it is feasible to use RHI to explain flame instability in this case.
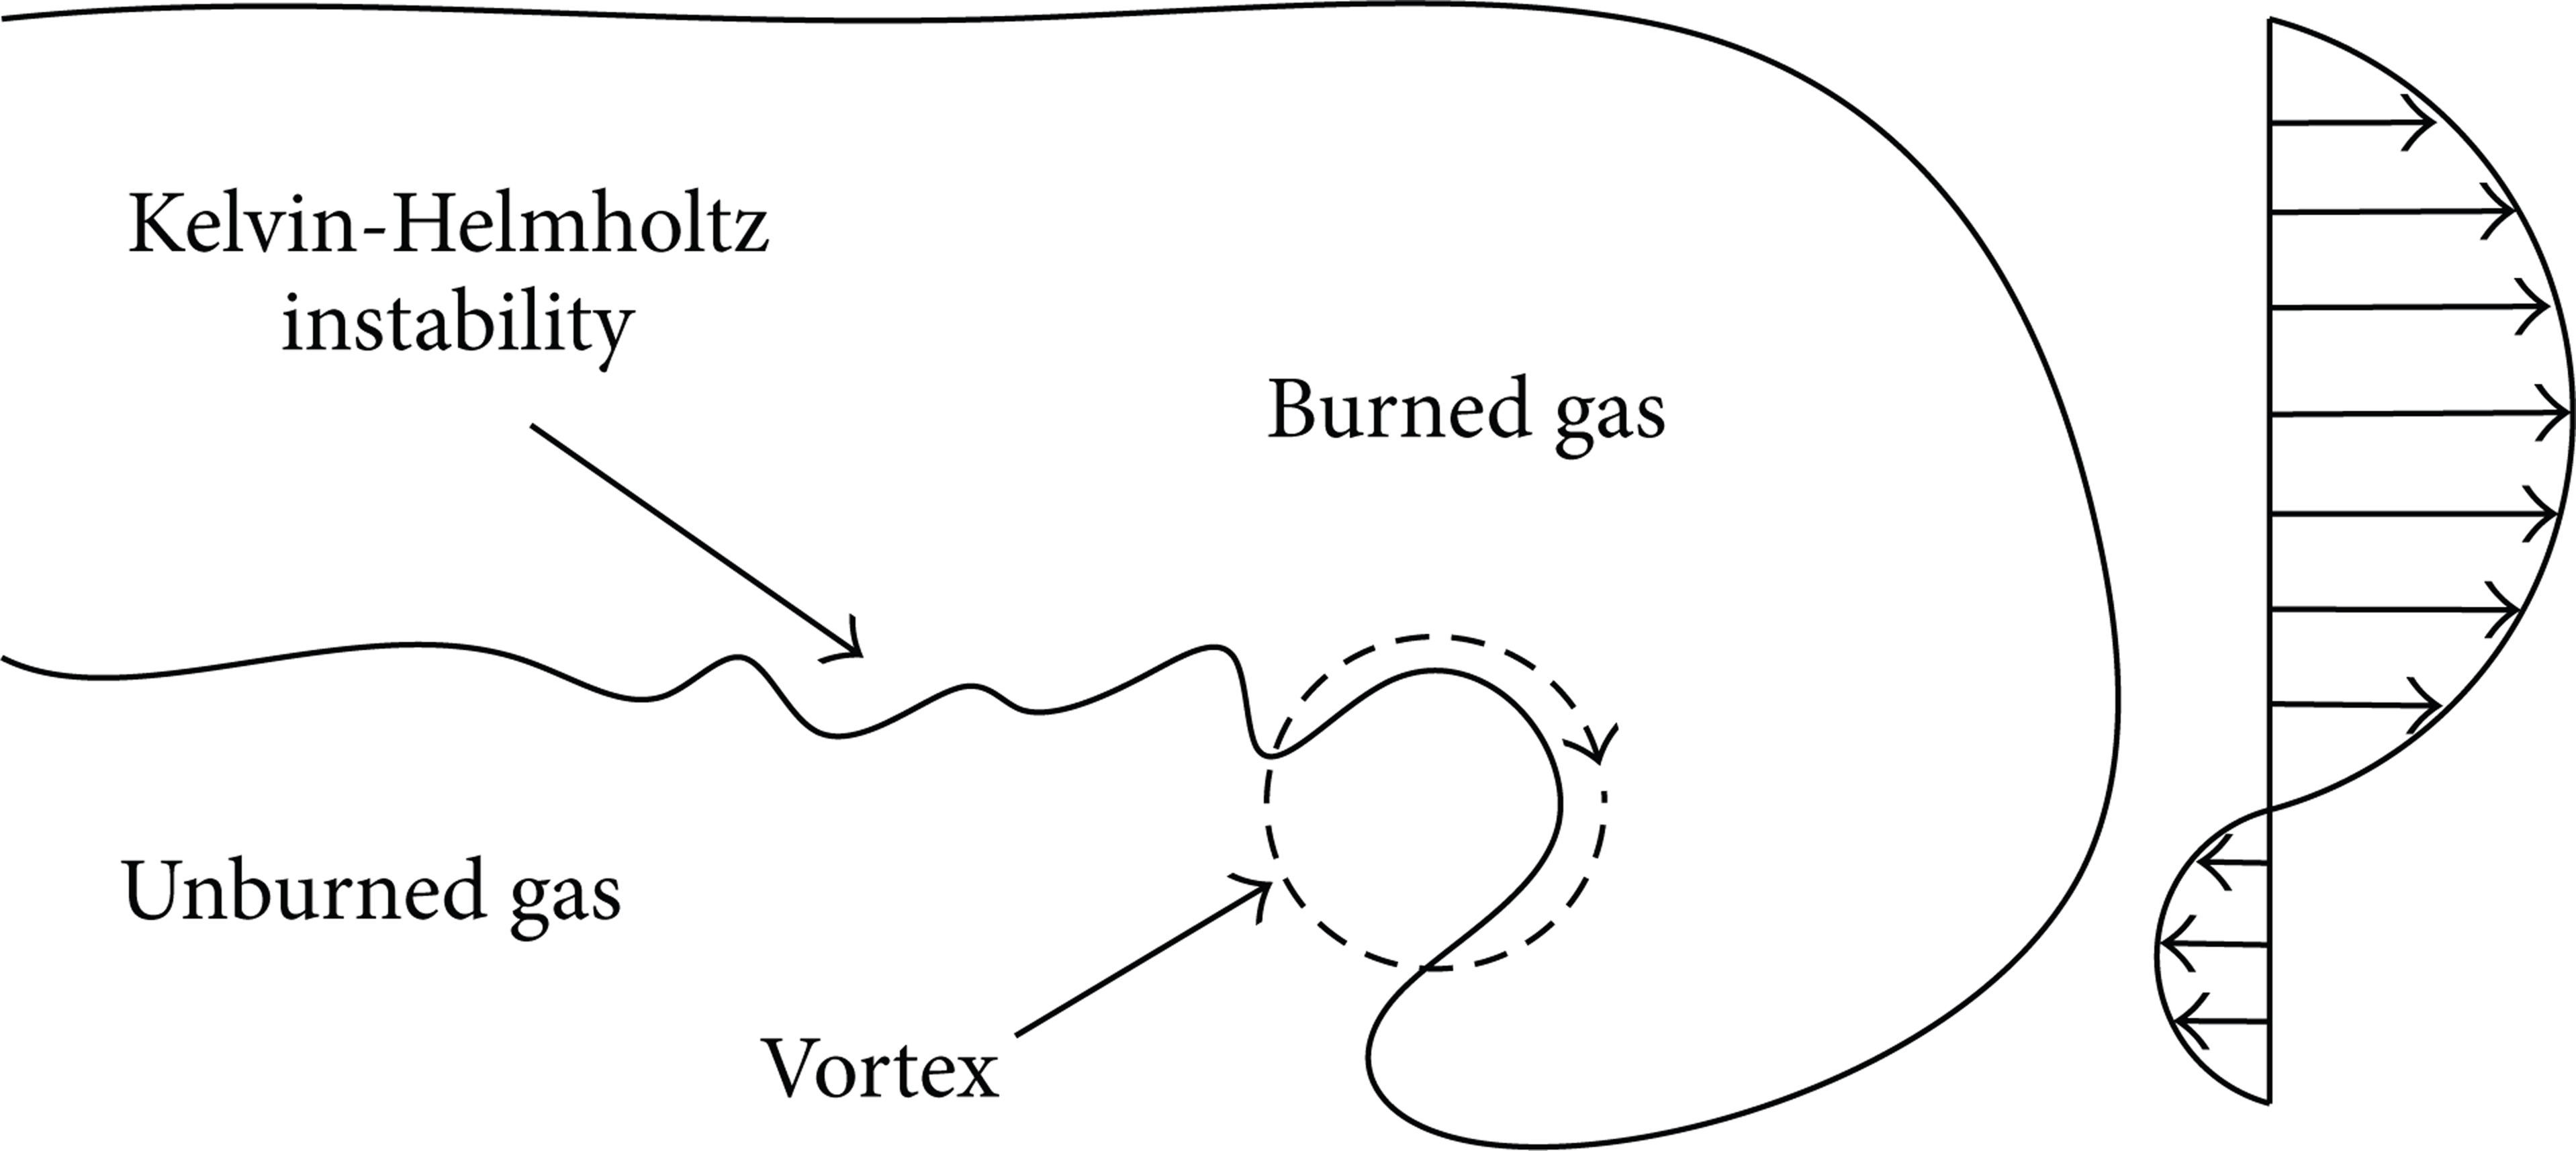
Moreover, two vortices (vortex 1 and vortex 2 in Figure 8(e) reflected the flow traces at t = 80 ms) appeared in the burned area. Compared with high-speed schlieren images, the two vortices explained the wrinkle phenomenon well at t = 87 ms in Figure 3. Vortex 1 with reversed direction of rotation compared with vortex 2 was described in Figure 9.

Scheme of wrinkle induced by vortex 1 and vortex 2.
Vortex 1 forming attributed to the backflow was shown from Figures 8(b) to 8(d). Due to thermal expansion in the burned area, the pressure at the left area of obstacle was much lower than the right area, which caused the combustion products of flame front to move back to the capsule before the obstacle. The vortex 1 came into being near the obstacle boundary gradually due to the influence of 90° angle rectangle obstacle during the backflow passing by the obstacle. However, the formation of vortex 2 was mainly due to flame rolling up after losing stabilization. Finally, two vortices with different rotation direction caused the wrinkle forming. The wrinkle enlarged the flame surface, sequentially increased the reaction rate, and contributed to the flame acceleration finally.
5. Conclusions
In this study, the dynamics of premixed flame front propagation in an open duct with a rectangle obstacle was investigated by using high-speed schlieren photography and pressure recording, accompanied with realizable k-∊ and eddy dissipation conception simulation, and the conclusions were drawn as follows.
In an open duct, no contact was found between flame propagation front and obstacle when the flame passed over the latter, which was dissimilar to those in closed duct. The transition from laminar to turbulent flow, after flame front was passing by the obstacle, was mainly induced by Kelvin-Helmholtz instability.
The overpressure had no noticeable rising but in a downward trend and the thermal expansion played a leading role. The obstacle only slowed down the flame for a short while but led to the flame speed increase eventually.
The realizable k-∊ and EDC model simulation results agreed with the experiment well. Moreover the flow traces reflected the forming process of wrinkles induced by two vortices, which resulted from backflow passing through the obstacle edge and flame rolling up after losing stabilization, respectively.
Footnotes
Nomenclature
Conflict of Interests
The authors declare that there is no conflict of interests regarding the publication of this paper.
Acknowledgments
This work was supported by the National Natural Science Foundation of China (no. 51374164, 51174153, and 50804038) and the Hubei Natural Science Foundation (no. 2014CFB879).