
Abstract
The resonance of the armature assembly is the main problem leading to the fatigue of the spring pipe in a torque motor of hydraulic servo valves, which can cause the failure of servo valves. To predict the vibration characteristics of the armature assembly, this paper focuses on the mathematical modeling of the vibration characteristics of armature assembly in a hydraulic servo valve and the identification of parameters in the models. To build models more accurately, the effect of the magnetic spring is taken into account. Vibration modal analysis is performed to obtain the mode shapes and natural frequencies, which are necessary to implement the identification of damping ratios in the mathematical models. Based on the mathematical models for the vibration characteristics, the harmonic responses of the armature assembly are analyzed using the finite element method and measured under electromagnetic excitations. The simulation results agree well with the experimental studies.
1. Introduction
Hydraulic servo control systems have been widely applied in many areas, such as manufacturing machines, automatic production lines, aerospace actuation controls, and agriculture machines, because of significant advantages, such as a large power density, high responding speed, and high control precision. Because hydraulic servo valves are key components in hydraulic control systems, they have a significant influence on the performance of the whole system [1, 2].
Unpredictable self-excited noise at high frequency causes performance deterioration and even failure of hydraulic servo valves. Such noise is a combination of fluid dynamic and mechanical noise, which is often accompanied by an intense oscillation of the armature assembly and is a main cause of spring pipe fracture, oil leakage, and control failure. Much work has been carried out to study the mechanism of self-excited noise in hydraulic valves, and the studies have shown that cavitations, shear-layer oscillations inside the flow fields, and vibration of the armature assembly are the possible causes of this noise [3–6]. Watton examined the dynamic characteristics of the pilot flow field in the nozzle-flapper servo valve and found a relationship between the high frequency noise and the oil supply pressure as well as the return pressure [7]. Kawashima et al. proposed a new four-port nozzle-flapper-type servo valve using slit structures instead of orifice plates. The noise and pressure fluctuations were effectively reduced in the newly developed valve [8]. The flow field distribution and flow pressure characteristics in the pilot stage of servo valves were studied by McHenya et al. [9]. Li et al. made experimental observations and numerical simulations of cavitation phenomenon in the flow field between the flapper and nozzle of servo valves and confirmed that turbulent pressure fluctuations contributed to cavitation [10]. All the numerical or experimental studies on the flow field above have partly improved the understanding of self-excited noise in servo valves. However, less attention was paid to the vibration characteristics of the armature assembly because of the difficulty in prediction and measurement. A reasonable mathematical model for the vibration characteristics of the armature assembly considering the main vibration modes in the working plane will be helpful in the mechanism discovery and depression of self-excited noise and the structure fracture.
To date, many improved mathematical models for the dynamics of servo valves have been proposed by researchers. A nonlinear dynamic model for a two-stage servo valve was developed by Zavarehi et al. [11]. Improved results were reported by comparing theoretical values with the corresponding experimental values. Based on a corrected and experimentally verified mathematical model of two-stage mechanical feedback servo valves, Gordic et al. studied the effects of the variation of a few torque motor parameters on the dynamic performance of servo valves [12]. Li and Song established a mathematical model to predict the dynamic characteristics when the torque motor was not fixed on the valve body [13]. The dynamic response of armature assembly in the frequency domain was simulated and tested. However, these models have mainly considered the first vibration mode when the dynamic characteristics of the armature assembly were studied, which are not correct for obtaining the resonance regularity in high frequency ranges.
The finite element method is often used to extract high mode modal parameters such as nature frequencies, mode shapes, modal stiffness, and damping ratios [14]. Urata and Suzuki investigated the stiffness of a spring pipe in a servo valve torque motor using finite element method analysis [15]. Somashekhar et al. attempted to simulate the steady-state operation of a jet pipe servo valve based on finite element models [16]. In Urata and Somashekhar's work, the output torque of the torque motor was assumed to be constant and the effect of the magnetic spring was ignored. A magnetic spring, which is created by a permanent magnet, greatly influences the resonance peaks and frequencies of the armature assembly, especially when the stiffness of the magnetic spring and the mechanical spring pipe has the same order of magnitude.
The damping ratio, one of the key parameters describing the dynamic deformation of a structure, is of great importance in the understanding of structure dynamics. In [13, 17], the damping parameter was mainly based on empirical value that causes inaccuracy in the dynamic response prediction. Various time domain and frequency domain methods have been developed for damping identification. A combined empirical mode decomposition (EMD) and random decrement (RD) method was presented by He et al. to identify modal damping ratios from monitoring vibrational data [18]. The damping ratios were identified from the free decay response obtained by the EMD-based RD technique. Liao et al. presented a new modal technique for extracting the damping properties of polymethyl methacrylate (PMMA) beams based on the hammer excited free response [19]. This technique is useful for estimating high mode damping ratios using the log decrement method and band-pass filters.
In this paper, a mathematical model including the main vibration modes of an armature assembly in a servo valve torque motor is presented. The modal parameters are extracted by means of simulation and experiment. A finite element model considering the effect of the magnetic spring is established. Experiments are conducted by measuring the dynamic response of an armature assembly under electromagnetic excitations. A damping ratio identification method based on the resonant free delay response is adopted in this work.
2. Structure and Working Principle of the Armature Assembly
The construction of a hydraulic nozzle-flapper servo valve and the armature assembly is shown in Figure 1. A hydraulic servo valve usually consists of two parts: the electromagnetic part and the hydraulic part. The electromagnetic part is an electromagnetic torque motor, including permanent magnets, cores, armature, and coils. The hydraulic part is also called a two-stage hydraulic amplifier. The pilot stage of the hydraulic amplifier is a nozzle-flapper valve that consists of two nozzles and a flapper. The power stage is a spool valve that includes a spool and a valve body. The armature, spring pipe, and feedback rod compose the armature assembly, which is connected to the spool valve through the feedback rod.

The construction: (a) armature assembly and (b) a hydraulic nozzle-flapper servo valve.
There are four working gaps between the armature and the cores, as shown in Figure 1(b). When the input current Δi = i1 − i2 is zero, the armature will stay at the neutral position between the cores under the permanent magnetic force. Theoretically, because of the symmetrical structure of the torque motor, the magnetic field distributions will be the same in the four working gaps. Therefore, the permanent magnetic force at both ends of the armature will be equal and balanced. The armature will stay at the middle position without any rotation.
When the input current Δi = i1 − i2 is positive, the torque motor works under the interaction of the control flux induced by the coils and the permanent magnet. The direction of the permanent magnetic flux and the control flux is shown in Figure 1(b). The magnetic flux densities in working gaps 2 and 4 will increase and become larger than those in working gaps 1 and 3. There is an output torque proportional to the input electric current driving the armature assembly to rotate anticlockwise. When the counter torque from the deformation of the spring pipe equals the output torque, the armature assembly stops rotating and remains at a balanced position. As hydraulic oils jetted out from the two nozzles, the movement of the flapper will introduce a pressure difference to both sides of the spool so that the spool will move to a new position. When fluids jetted out from the nozzles, shear-layer instability or cavitation may appear inside the flow field between the flapper and nozzle, which may irritate the fluid-structure coupling between the flow field and the armature assembly. The resonance of the armature assembly is then excited.
3. Mathematical Models
The output torque for operation around the neutral position is usually linearized to be [20]

Therefore, the force acting on the end of the armature can be written as

where K t and K m are the torque constant and the magnetic spring constant of torque motor, respectively, Δi is the current difference in the coils, θ is the rotation angle of the armature, x is the displacement of the end of the armature, and a is the radius of the armature from the pivot to the center of the pole face.
Formula (1) shows that the output torque is a function of the input difference electric current and the rotating angle of the armature. K t Δi represents the electromagnetic torque due to the control current when the armature is at neutral position. K m θ represents an additional electromagnetic torque due to air gap variations when the armature is away from the neutral position. The additional torque, which is proportional to the rotating angle, works like a spring to drive the armature further away from the neutral position. Thus, the additional torque is often called the magnetic spring torque.
When the torque motor is not fixed on the valve body, the motion equation of the armature assembly considering all the degrees of freedom (DOF) can be expressed as [21, 22]

where
For a linear time-invariant system in which normal modes exist, through modal coordinate transformation, we have

where

where

where ω i , ζ i , and J i are the modal frequency, damping ratio, and rotational inertia of the ith mode, respectively.
When the modal parameters, such as the modal frequency, damping ratio, rotational inertia, and mode shape, are extracted, (6) can be solved. In this paper, the modal parameters are obtained using numerical and experimental methods.
4. Finite Element Model of the Armature Assembly
An equivalent finite element model is built to study the vibration characteristics of the armature assembly using ANSYS software. The geometry model is shown in Figure 2. The effect of the magnetic spring is simulated by the spring element with negative stiffness K = − K m /2a2. Fixed boundary conditions are applied to the surfaces of the four bolt holes, as shown in Figure 2. All of the material properties for each component of the armature assembly are listed in Table 1. The construction parameters of the torque motor used for the simulation are shown in Table 2.
Material properties of the armature assembly.

Construction parameters of the torque motor.

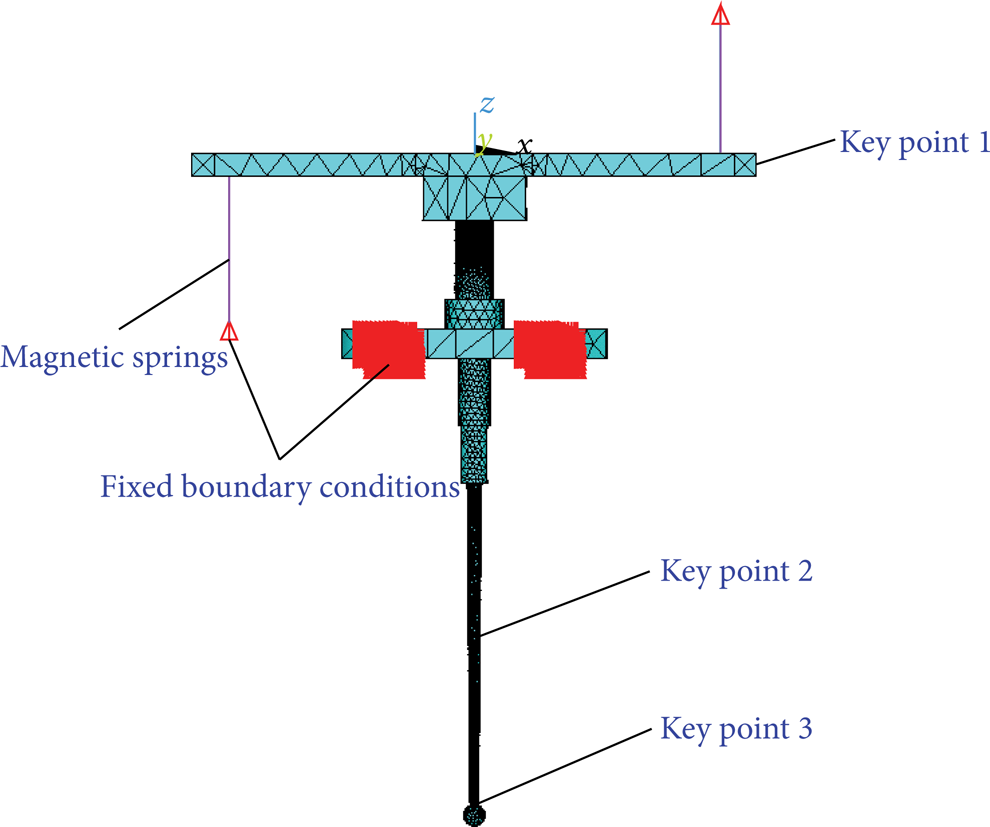
Finite element model with boundary conditions and the positions of three key points.
The vibration in the working plane (xoz plane) is dominant when the armature assembly is excited by the electromagnetic force or the force due to the flow from the nozzles. The vibration characteristics of the armature assembly in the working plane, which are the main interests of this paper, are acquired through harmonic response analysis using modal superposition methods. First, modal analysis is performed to obtain the mode shapes and natural frequencies. Based on the results from modal analysis, the harmonic response analysis of the armature assembly under sinusoidal excitations can be carried out. The vibration mode shapes of the armature assembly within the range of 0∼4500 Hz in the working plane are shown in Figure 3. The modal analysis shows that there are five vibration modes in the working plane and a large deformation appears in three positions: the end of the armature and the middle and the end of the feedback rod. Then, to obtain the resonance regularity in the range of 0∼4500 Hz, the harmonic response curves of three key points (as shown in Figure 2) in the x direction will be tested and analyzed.

First five mode shapes of the armature assembly in the xoz plane.
5. Experimentation
The thickness of the spring pipe is 0.065 mm, and the total mass of the armature assembly is approximately 9 g. The spring pipe is so fragile that traditional experimental modal analysis methods excited by a shaker or an impact hammer cannot be applied in this work. Furthermore, the mass added by the sensor (e.g., accelerometer) could influence the identification of the modal parameters greatly if a contact measurement is employed. For the reasons above, an electromagnetic excitation and noncontact measurement method is developed and presented.
5.1. Experimental Setup
The composition of the experimental system to measure the vibration characteristics of the armature assembly is shown in Figure 4(a). The system includes a laser displacement sensor (LK-G5000, KEYENCE Company), a personal computer, a DA converter (PCI-1710, Advantech), a servo amplifier, and the tested armature assembly. The picture of the test rig is shown in Figure 4(b).

(a) Setup of the experimental system. (b) Test rig for displacement measurement.
In this experiment, the armature assembly is excited using the electromagnetic force supplied by the torque motor. The computer and DA converter are used to generate excitation signals in analog format, and the servo amplifier magnifies and converts the signals from voltage to current before they are supplied to the torque motor. The electromagnetic force is proportional to the input current. To avoid uncertainties in the boundary conditions, the flange of the armature assembly and the permanent magnet part of the torque motor are fixed tightly by a clamp. The laser displacement sensor is used to measure the displacements of the armature assembly. The measurable displacement of the sensor ranges from 17 mm to 23 mm, and the displacement resolution is as high as 1 nm. The highest sampling frequency can be up to 392 kHz. High speed data communication can be realized between the sensor controller and the computer through USB port.
5.2. Harmonic Response Test
The vibration characteristics of the armature assembly are studied through the harmonic response test. The harmonic responses of three key points (as shown in Figure 2) in the x direction are measured by the laser sensor. To compare with the simulation results of harmonic response analysis and validate the effectiveness of damping ratio identification method, the stepped-sine excitation method is adopted to obtain accurate sinusoidal steady-state responses. Also the stepped-sine test is usually characterized by optimal signal-to-noise ratios as well as avoiding spectral errors (such as aliasing and leakage) [23]. Furthermore, the measurement time can be reduced by adjusting the frequency interval.
This test uses a number of sinusoidal forces to excite the armature assembly. The frequency varies from 0 to 4500 Hz, and the amplitude is kept constant. The test initially adopts a frequency interval of 50 Hz within the entire frequency range. The frequency interval is then reduced to 10 Hz and 1 Hz in the resonance region where the response amplitudes change rapidly [24]. To capture the accurate amplitude at high frequencies, the sampling frequency of the laser sensor is set to 100 kHz. To eliminate the influence of the transient response, the duration of the excitation is 10 seconds and we only use the response data of the last second for analysis.
When a linear system is excited by a sinusoidal force, the steady output will also be a sinusoidal signal with the same frequency but the amplitude and phase will change [25]. Because of the nonlinearity of the servo valve torque motor, the steady output includes not only the excitation frequency but also higher harmonics whose frequencies are multiples of excitation frequency. To eliminate the higher harmonic components, a fitting function only including the excitation frequency is used to fit the output signal. The form of the fitting function is as follows:

where a0, a1, a2,… are the coefficients of the function that can be identified by the least squares method. Thus, the amplitude of the output signal can be calculated as
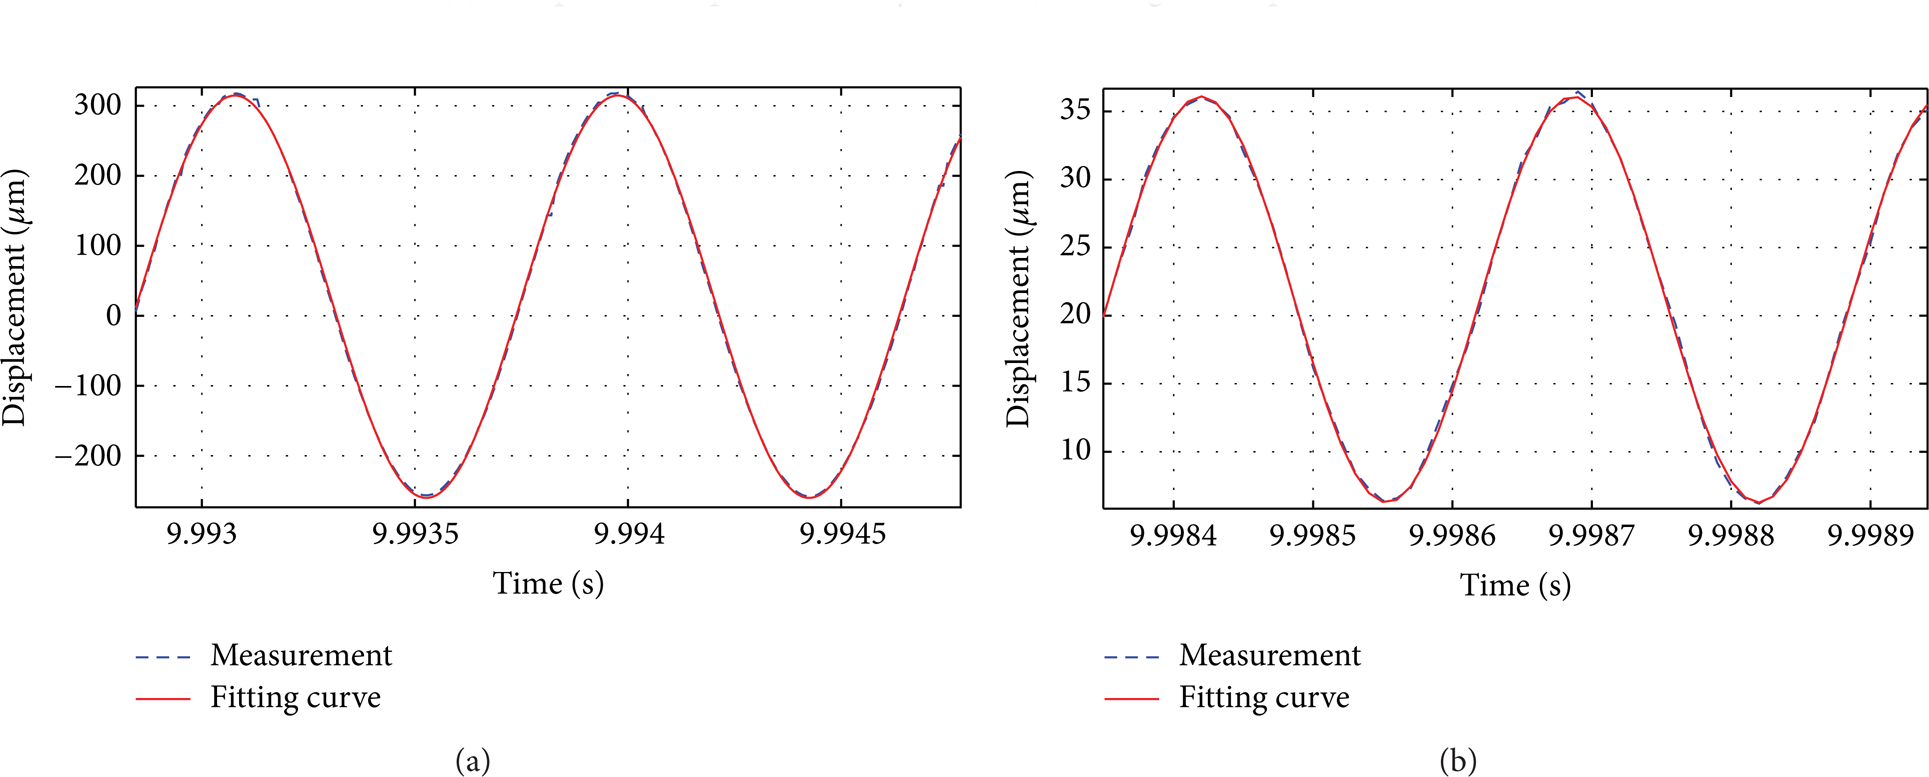
The curve fitting results for the middle point of the feedback rod: (a) 1113 Hz and (b) 3752 Hz.

The harmonic responses of key points in the x direction (experimental results).
5.3. Identification of the Damping Ratio
It is essential to obtain the damping ratio of a structure to accurately predict the dynamic response. For a system in which the excitation and the response cannot be measured simultaneously, traditional damping ratio identification methods are not applicable. In this case, a damping ratio identification method based on the resonant free delay response is adopted.
The free delay response of a linear damped multidegree-of-freedom (MDOF) system with “m” real modes [26] can be written as

where ω
i
is the ith undamped natural frequency,
The free delay response can be regarded as a linear combination of its single modes, and every mode has its own damping ratio. When we excite the structure using a sinusoidal excitation at the resonance frequency ω di , the contribution of the ith mode to the free delay response will be dominant and the other modes can be ignored in comparison. Therefore, by identifying the attenuation coefficient − ζ i ω i , the damping ratio of each mode can be estimated [21, 22]. The attenuation coefficient is identified by exponential curve fitting for the peaks of the free delay response.
In the experiment, the armature assembly is excited using a sinusoidal electromagnetic force at the tested resonance frequency. After the response reaches steady state, the excitation is stopped. The free delay response can be measured by recording the displacements with the laser displacement sensor. Figure 7 shows the whole and part time histories of the free delay response at the middle point of the feedback rod at 523 Hz. The result of the exponential curve fitting is shown in Figure 8. Processing continues in the same way for other resonance frequencies, and the results are shown in Figure 9. The estimated damping ratios are shown in Table 3. We can see that the damping ratio of the second mode is the lowest, which agrees well with the tested harmonic response results in which the second resonance peak is the largest.
Identified damping ratios and natural frequencies.


The free delay response at 523 Hz: (a) whole time histories and (b) part time histories.

The damping ratio estimation at 523 Hz.

The damping ratio estimation: (a) 1113 Hz, (b) 2646 Hz, and (c) 3752 Hz.
To remain intact, the original signals are not processed by filters. Figures 9(b) and 9(c) show that the free delay response at a higher frequency includes a low frequency trend. The exponential curve fitting without filtering will somehow influence the estimation of the damping ratio, although the contribution of the low frequency trend to the free delay response is small.
6. Model Validation and Discussion
Based on the mathematical models for the vibration characteristics, the harmonic responses of the armature assembly are analyzed using the finite element method. Sinusoidally varying forces with different frequencies and same amplitude are applied to the ends of the armature. The frequency varies from 0 to 4500 Hz, and the amplitude is calculated by the formula F = K t Δi/2a. With the tested damping ratios, the steady-state response of key points in the whole frequency range can be obtained and the results are shown in Figure 10. The harmonic responses obtained from experiments and simulations show good agreement. There are four resonance frequencies within the range of 0∼4500 Hz, and the vibration energy is mainly concentrated within 2000 Hz. In addition, the maximum resonance amplitude both appears on the second mode. The maximum predicted resonance amplitude is 952.5 μm at 1111 Hz, whereas the tested one is 917 μm at 1113 Hz. Both of them appear at the end of the feedback rod. It can also be observed that the fourth mode can hardly be identified from the harmonic responses in the x direction in both the simulation and the experiment. That is, because the vibration of the fourth mode mainly focuses on the flapping of the armature in the z direction, the movement in the x direction is weak. This demonstrates that it is difficult to identify all the natural frequencies by using the measurement in a single direction with only one laser displacement sensor. The method is only eligible for the vibration prediction and measurement in the working plane (xoz plane).
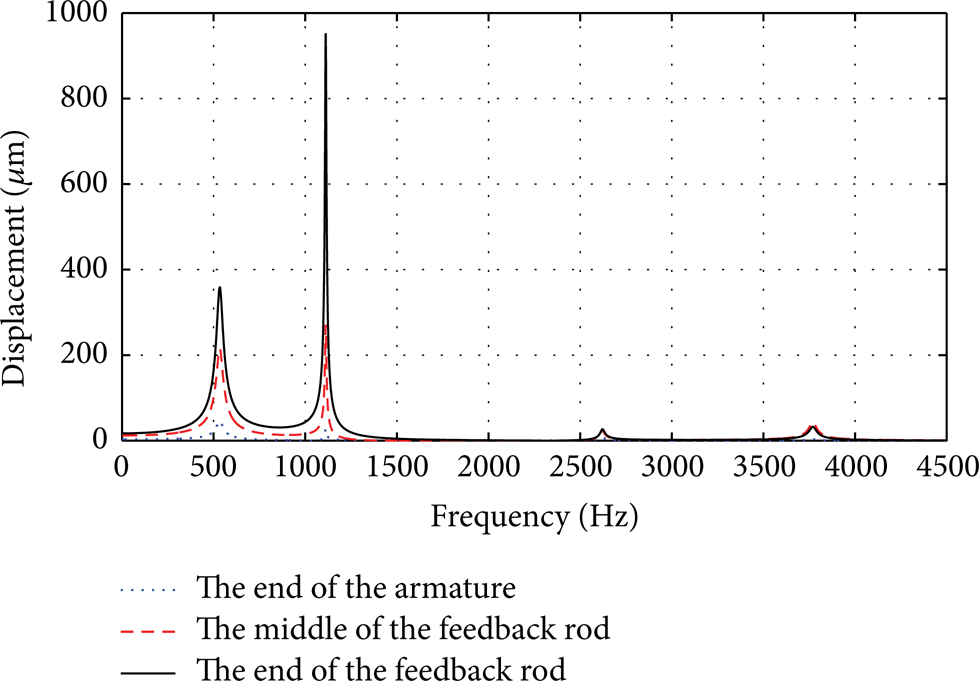
The harmonic responses of key points in the x direction (numerical results).
A detailed comparison between the tested and predicted responses for each key point is shown in Figure 11. The figure shows that the predicted responses agree well with the tested results at the amplitudes and the resonance frequencies. Little differences can be seen between the simulation and experimental results at higher natural frequencies. Table 3 lists the experimental and numerical natural frequencies and the errors between them. The agreement between the experimental and numerical natural frequencies is acceptable with the largest error being less than 3%. The difference between the simulation and experimental results is most likely caused by simulation and experimental errors.

The comparison of harmonic responses in the x direction between the simulation and the measurement: (a) the end of the armature, (b) the middle of the feedback rod, and (c) the end of the feedback rod.
7. Conclusions
The mathematical model for the vibration characteristics of the armature assembly in the torque motor of a hydraulic servo valve has been studied. The harmonic response of the armature assembly is investigated through numerical simulations and experimental measurements. The results show that five vibration modes appear within the frequency range of 0∼4500 Hz in the working plane (xoz plane) and that the resonance peak of the second mode is the largest because of the lowest damping ratio at that frequency. The simulation results agree well with the experimental results, showing that the electromagnetic excitation method and damping ratio identification method based on the resonance free delay response are reasonable and applicable.
The pressure pulsation excitation signals in the flow field will be a critical source to induce the resonance. In addition, the vibration characteristics (e.g., damping ratios) of the armature assembly are also influenced by the working fluid. Thus, observations of dynamic fluid-structure interactions between the armature assembly and working fluid are also recommended for further investigations. The validated model developed in this paper can provide a foundation for further research when the armature assembly works in the flow field inside the servo valves.
Conflict of Interests
The authors declare that there is no conflict of interests regarding the publication of this paper.
Footnotes
Acknowledgment
This paper is financially supported by the National Natural Science Foundation of China (Project no. 50875055).