
Abstract
In order to analyze the steering dynamic characteristic of the skid steer loader, a cosimulation model of steering system based on theoretical analysis of skid steer loader steering process was established by using AMESim software platform and Motion software platform. The dynamic characteristics of unilateral, bilateral steering conditions and the load characteristics of steering process were analyzed through simulation and verified by experiment. The comparison of dynamic model and experimental results shows that the error between simulation data and experimental data is within 10%, and the model can be used in system matching and performance prediction.
1. Introduction
Skid steer loader adopts hydrostatic driving technology and the traveling system adopts double closed-loop systems and the variable pump drive traveling motor which transmit power to the wheel via chains to rotate the tires. Since there is no differential device, when the vehicle is steering, it relies on the speed difference of both sides of the tire. Due to the current published relevant results which research the skid steering, load characteristics of skid steer loader are rare and the research results in other fields can be used. Therefore, this paper conducts the research from two aspects. The first one is skid theory of tracked vehicle and the main research results in this area include that Bruce Maclaurin and others who use magic formula to study skid characteristics of tracked vehicles get good results, which proves that the magic formula for rubber tires can also apply to the vehicle skid theory [1, 2]. This can help establish the skid steering theory of wheeled skid steer loader. The other one is the load characteristics theory of the tire and the ground. Clarke and others who have researched on control method of wheeled skid robot steering process developed a corresponding control system which achieved good control accuracy [3–5]. Morales and others have researched the energy loss of tracked vehicle skid process [6]. Yi and others have analyzed the kinematics and dynamics characteristics of wheeled skid robot and designed the control system by using the Kalman filter [7]. Yang and others have simulated and analyzed the armored tracked vehicle steering characteristics by using MatLab/Simulink and analyzed the influence in the hydraulic system pressure of the vehicle speed change [8]. Wong and Chiang have analyzed the effect of relationship between tire and the ground by using test and analysis methods [9–12]. Mohammadpour et al. have analyzed the characteristics of the tire steering and skidding in soft ground [13]. This can help establish the kinetic model of the tire and the ground. In addition, there are many related researches for matching the engine and hydraulic system that have accumulated a large number of research results which provides a reference for establishing the hydraulic system model in this paper.
The load characteristic of skid steer loader is very complex, especially the load characteristic of tire and the ground in steering process which directly affect the dynamics and stability of the machine [14–16]. So it is very important to research the load characteristic of tire and the ground in steering process. Traditional research methods are mainly based on simple theoretical calculation or using dynamics software to do simulation analysis. This method does not combine the transmission system analysis and dynamic analysis of the vehicle and ignores a number of key parameters so that it cannot accurately analyze the real steering characteristics of vehicle and the overall performance. The innovation of this paper is using multibody dynamics software Motion and hydraulic system simulation software AMESim to do cosimulation analysis. By this way, the analysis of vehicle steering characteristics can be more realistic and it is of great significance on the whole vehicle system matching and performance prediction.
2. Theoretical Analysis of Skid Steering
Different tire speed produces different steering, as shown in Figure 1. As the speed of the tire on the right side is greater than the left side, the vehicle steers to the left. The tire on the right side needs traction in the driving direction during steering process, and the tires on the left side have a braking effect in the steering range. Thereby it forms a steering torque which balances the resistance torque generated between the tire and the ground in constant speed motion state. In order to analyze the speed, force, and torque of the driving wheel in the steering process, do the following simplified [1, 2, 11, 12] steps:
the vehicle is traveling on a uniform flat ground;
the steering process is at constant speed;
ignore the centrifugal force;
the load of the tires on both sides of the vehicle is the same;
ground pressure evenly distributes in the length of the drive tires touching the ground;
the driving resistance of both sides of the driving wheel is the same;
center of gravity of the vehicle is located at the intersection of the symmetrical axis.
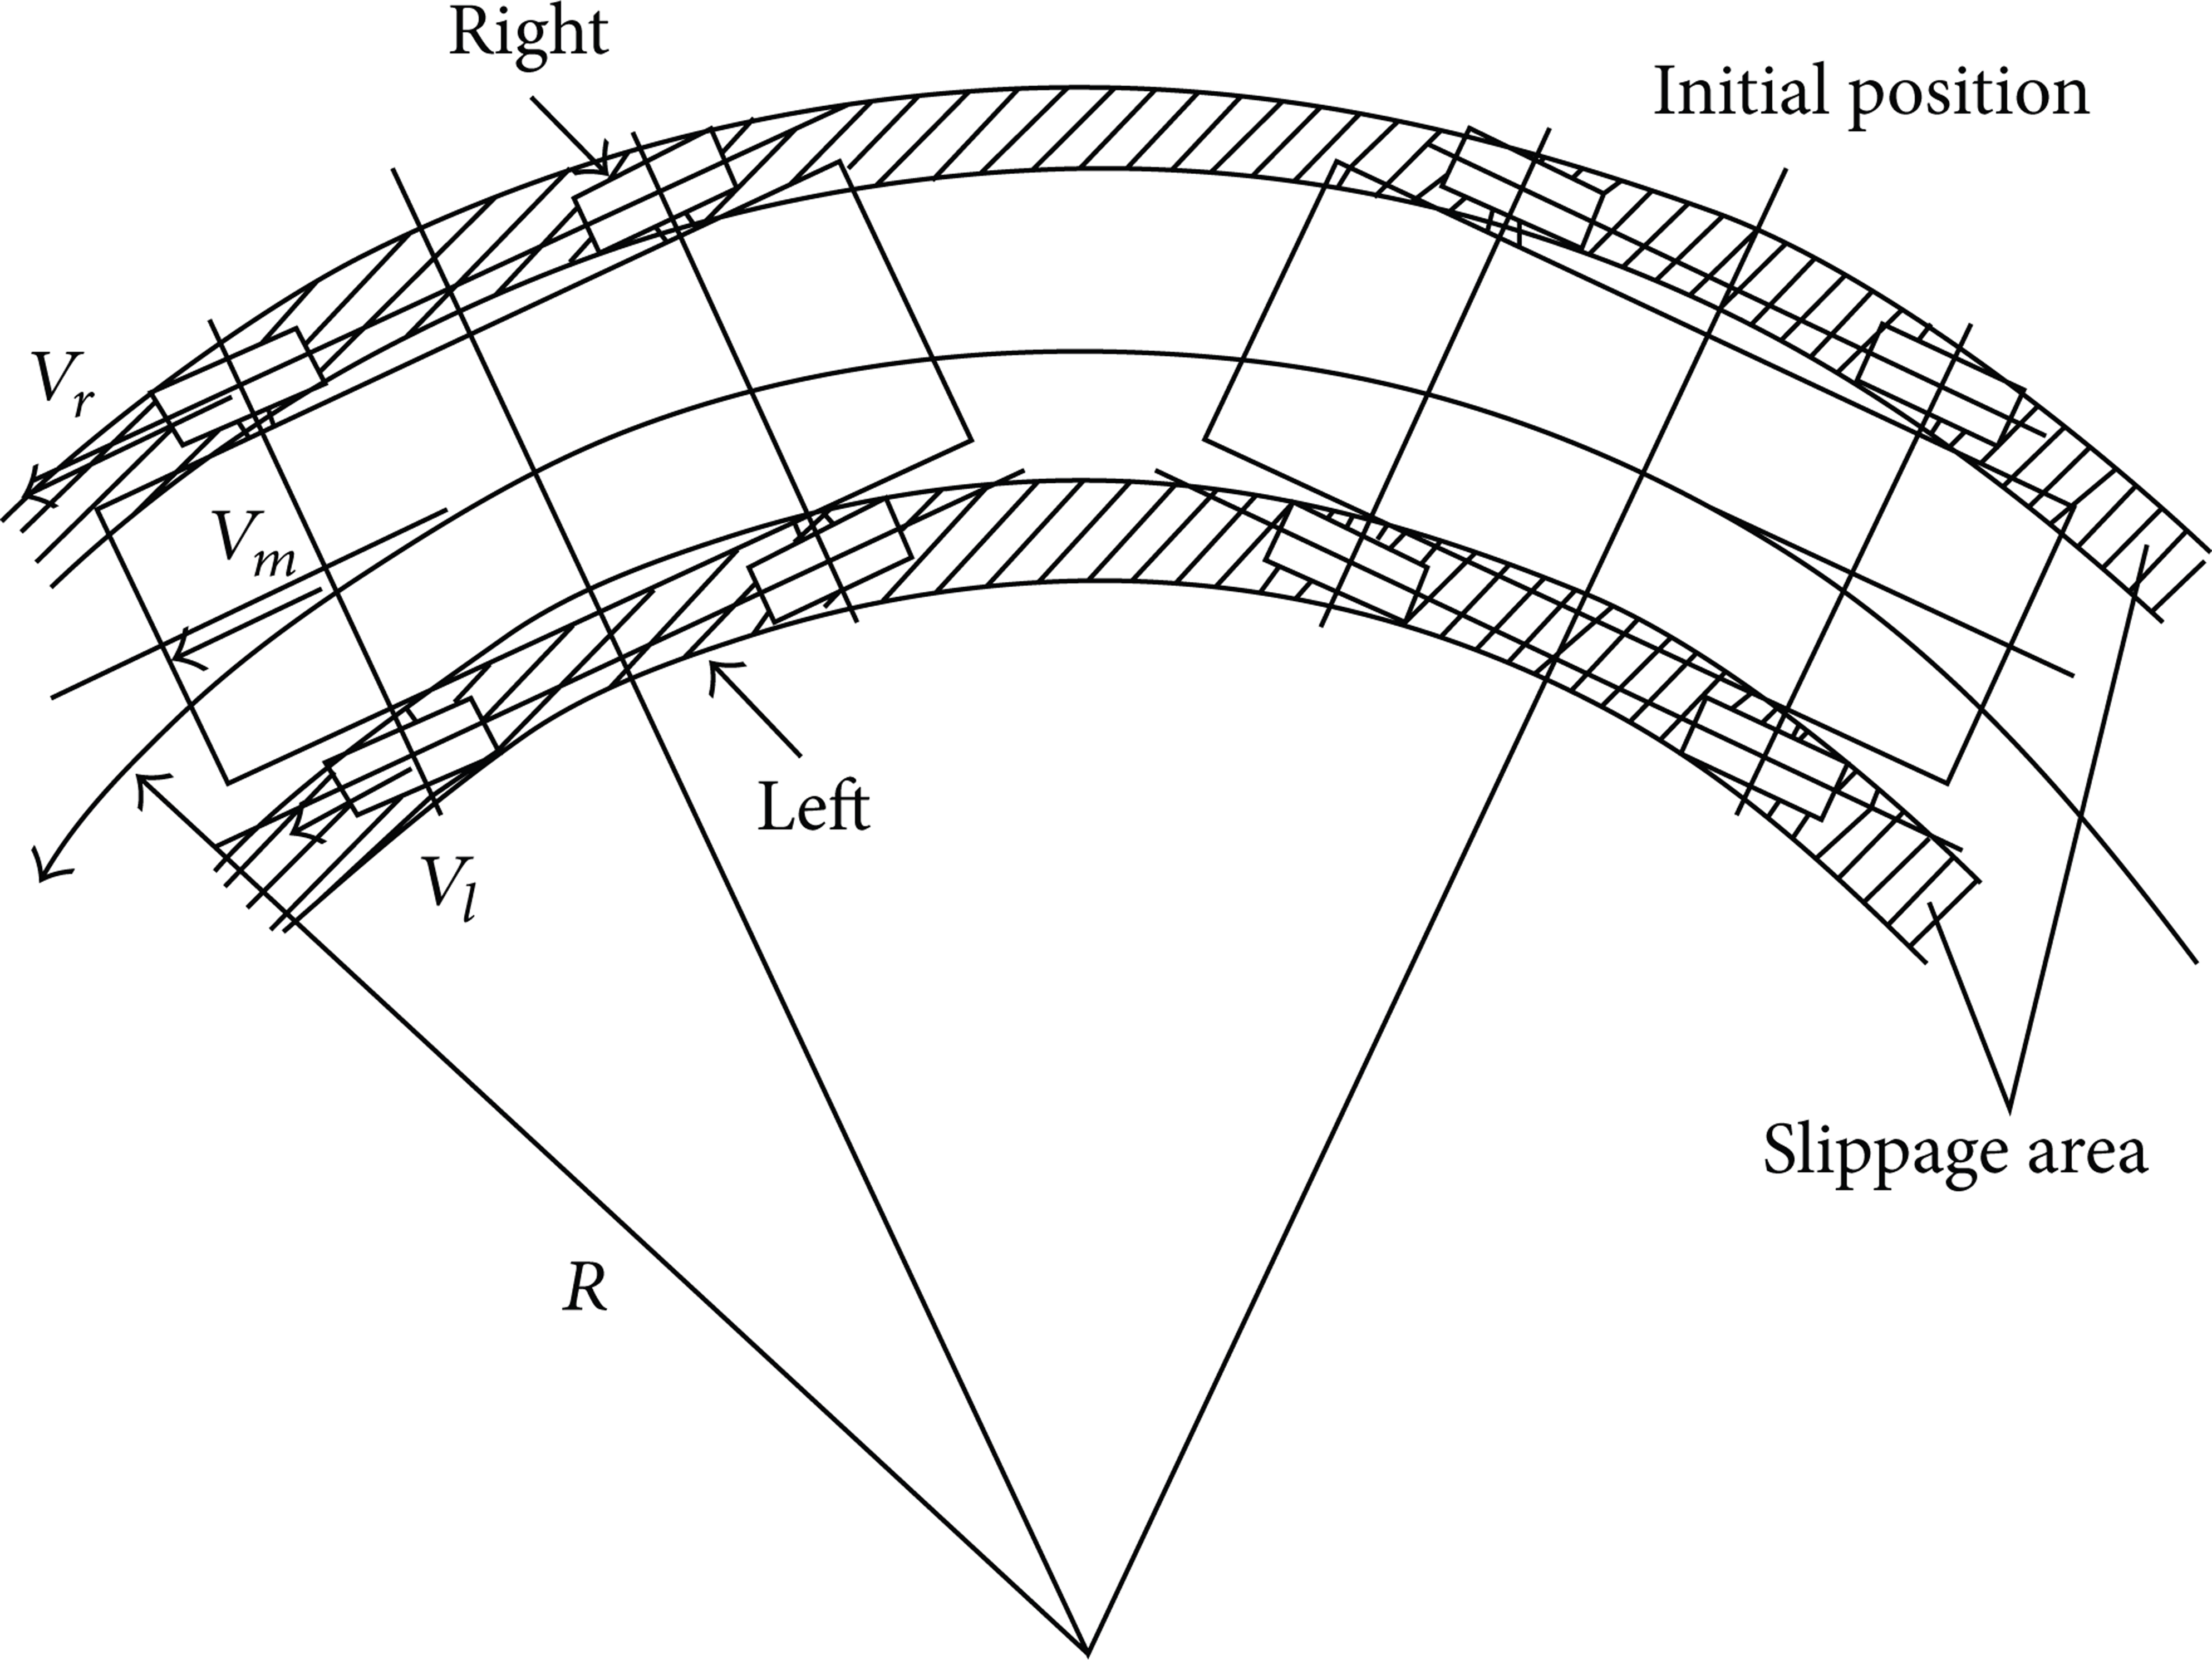
Schematic diagram of the steering of vehicles.
Figure 1 is a schematic view of vehicle steering, the traveling speed of the left is V l , the traveling speed of the right is V r , and the vehicle will do the rotary movement around the steering center M.
The parameters in Figure 1 are as follows: S is for the wheel tread; R is for the turning radius; M is for the instantaneous turning centers of the vehicle. In order to illustrate the relationship between speed, force, and power at the different turning radius, here the steering ratio i is introduced as follows:
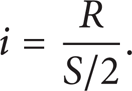
Depending on the relative turning radius, vehicle steering process can be divided into two cases. One case is large steering radius that means when R ≥ S/2, i = (V r + V l )/(V r − V l ) = R/(S/2). The other case is small steering radius that means when 0 ≤ R ≤ S/2, i = (V r + V l )/(V r − V l ) = R/(S/2) and V l < 0 at this case.
The kinematics equation in the process of steering is

where
When the vehicle turns in a small steering radius, the left side tires slip in the opposite direction and the right side tires slip in the same direction. The measure is slip rate.
Slip rate can be expressed as

where ρ is slip rate, v t is theoretical speed of the vehicle, and v is actual speed of the vehicle.
Considering the vehicle will slip during the steering process, the relations between slip rate and vehicle steering speed can be deduced. Consider
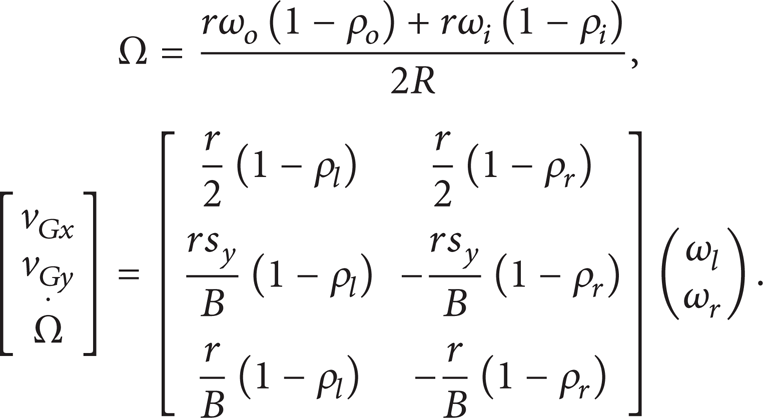
The change of vehicle tire slip rate can be qualitatively analyzed by (4) when the vehicle speed is changing.
v Gx is the longitudinal velocity of vehicle gravity center, v Gy is the lateral velocity of vehicle gravity center, ρ l is the slip rate of left side tires, ρ r is the slip rate of right side tires, r is tire radius, s y is offset of vehicle gravity center, ω l is rotational speed of left side tires, and ω r is rotational speed of right side tires.
The kinetic equations in stable steering process are as follows.
The mechanical characteristics of the vehicle in stable steering process are shown in Figure 2. During the steering process the tires and ground have shearing action. To analyze the dynamics of the vehicle in steering process, the relationship between shear stress and shear deformation should be known as shown in

Take an infinitesimal element of tire grounding area for analysis; the traction suffered by an infinitesimal element of the left and right sides of the tire is shown in

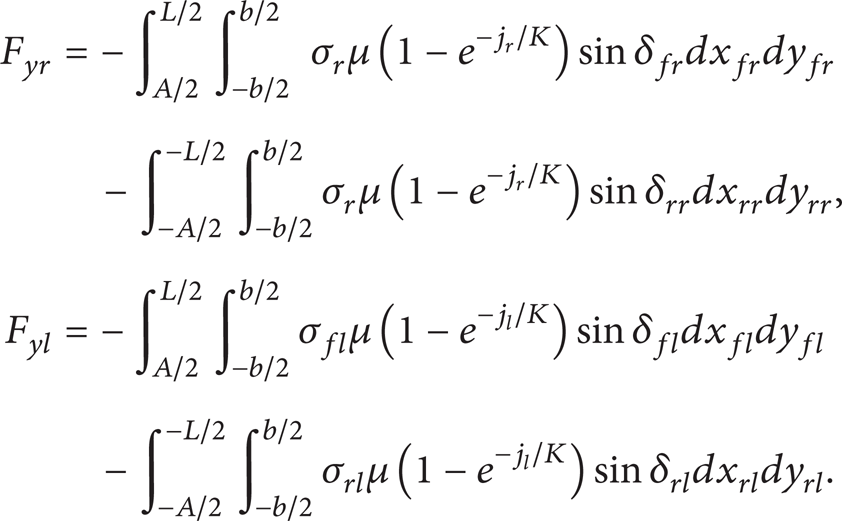
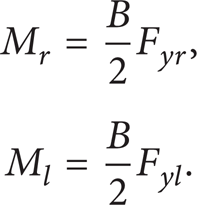
The longitudinal force of left and right tires shown in (7) can be obtained by integrating the tire grounding area:
The steering torque in steering process shown in (8) can be obtained by the left and right sides of the resistance taking the vehicle center for moment:
The physical meaning of main parameters is as follows:
CG: vehicle gravity center;
s x , s y : the position coordinates of the vehicle gravity center;
ω r : rotational speed of right side tires;
ω l : rotational speed of left side tires;
k s : rotational speed ratio;
τ: shear stress;
j: shear displacement;
v l : longitudinal velocity of left side tires;
v r : longitudinal velocity of right side tires;
μ: the coefficient of friction between the tires and ground;
K: shearing modulus of elasticity;
σ: normal pressure stress;
F yr , F yl : longitudinal force of left and right sides tire;
Ω, Ω′: rotary angular velocity of the vehicle;
B: tread;
R, R′: turning radius.

Kinetics of the vehicle during a steady-state turn.
All kinematic parameters and kinetic parameters can be determined by the force balance equation and the torque balance equation when the vehicle steers steadily.
3. Dynamics Model of Vehicle with the Ground
The main research of vehicle with the ground dynamics is the interaction between the track or tires and the ground [11, 12]. As the skid steer loader is equipped with rubber tires, this paper uses magic formula to establish the dynamics model of the vehicle with the ground [1]. Magic formula is a semiempirical formula. It deduces from the physical prototypes of the tire and can accurately describe the mechanical characteristics of the tire. It has been adopted by the majority of scholars who studied the tire and the ground, and the model has been applied to the multibody dynamics simulation software.
The basic expression forms of magic formula are as follows:

where y is either side force, longitudinal force, or self-aligning and x is either slip angle or longitudinal slip. For a specific tire, the curve generates horizontal offset S h and vertical offset S v relative to the origin. D is the peak value, C is termed the shape factor, BCD is the longitudinal or lateral slip stiffness, x m is the value of x at the peak value of y, and E is termed the curvature factor.
4. Dynamic Characteristics Simulation Analysis of Skid Steering
In order to establish a more accurate dynamics model of vehicle steering process, this paper uses multibody dynamics software Motion to establish a model of the vehicle and the ground, as shown in Figure 3. This paper also uses AMESim software platform to establish a model of closed vehicle traveling hydraulic system, as shown in Figure 4, and conduct the cosimulation analysis.

Multibody dynamics model of vehicle.

Traveling hydraulic system simulation model.
Simulation Parameters. Steering resistance coefficient is 0.68, rated engine speed is 2400 r/min, vehicle weight is 3600 kg, variable pump is Rexroth A20VG and the maximum displacement is 45 mL/r, walking motor is POCLAIN two-speed motor, and the displacement is 350/560 mL/r. The main simulation parameters are shown in Table 1.
Main cosimulation model parameters settings.

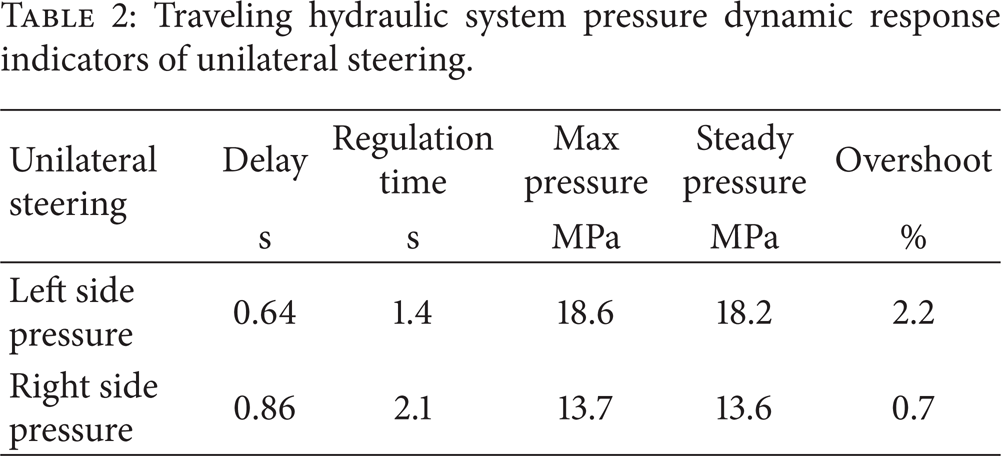
(1) Unilateral Steering. Take unilateral right steering with rated speed and fully load as an example, left traveling pump is main working pump which drives left traveling motor to output torque for driving the left side tires to overcome friction to move. The right traveling pump is in the neutral position and the right traveling motor is in braking condition, so there is speed difference between left side and right side and the vehicle steers around the slow side. Figure 5 is traveling hydraulic system pressure simulation curve of unilateral right steering, Figure 6 is right wheel torque simulation curve of unilateral right steering, and Figure 7 is left wheel torque simulation curve of unilateral right steering. Table 2 shows the traveling hydraulic system pressure dynamic response indicators of unilateral steering.
Traveling hydraulic system pressure dynamic response indicators of unilateral steering.
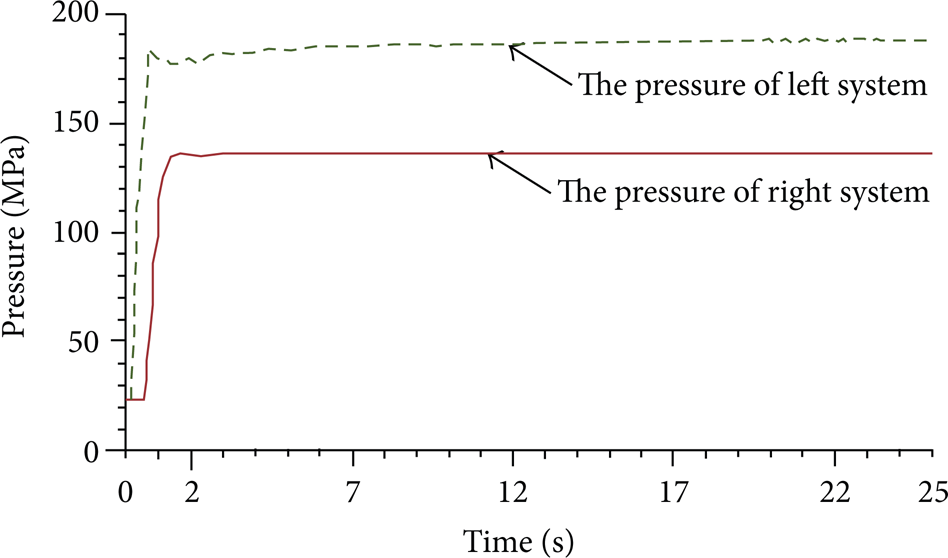
Traveling hydraulic system pressure of unilateral right steering.
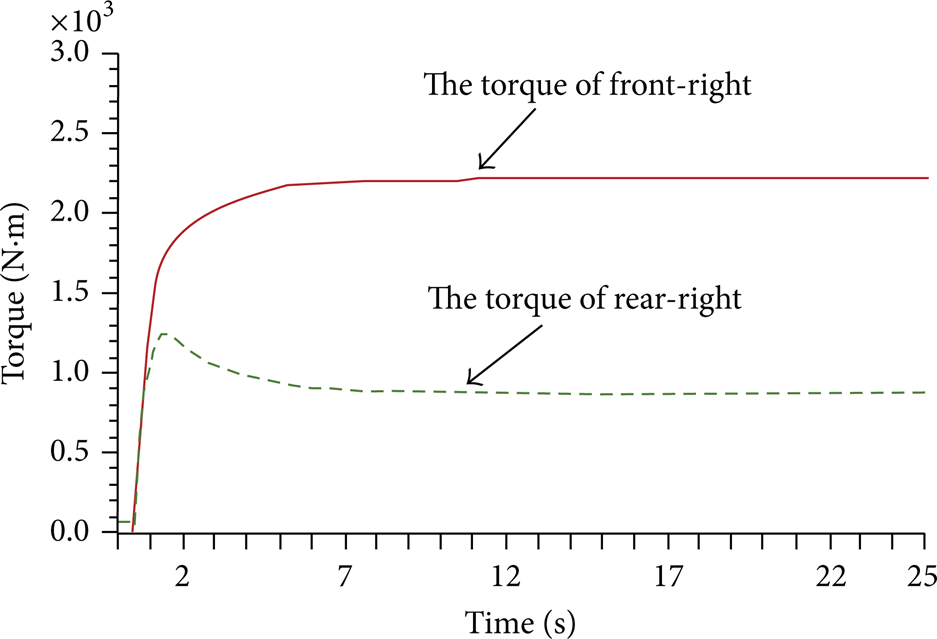
Right wheel torque of unilateral right steering.

Left wheel torque of unilateral right steering.
By Figures 5 and 6 and Table 2, the motor pressure of high pressure side can reach 18.6 MPa at the beginning of steering. In the unilateral steering stabilization phase, the mean value of left motor pressure is 18.2 MPa and the mean value of right motor pressure is 13.6 MPa. In this condition, vehicle steering radius is larger than bilateral steering. That means the left motor equivalent moment of inertia is less and so is the system overshoot. Therefore, the pressure of the steering system is relatively stable.
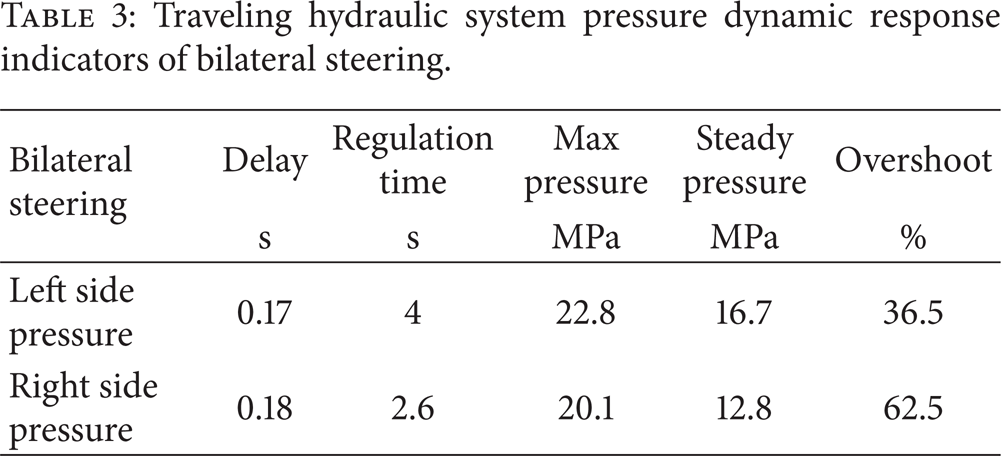
(2) Bilateral Steering. Take bilateral right steering with rated speed and empty load as an example; the left traveling pump controls the left motor turning forward and the right traveling pump controls the right motor turning reverse. Therefore, the left and right side wheels of the vehicle travel in opposite direction and at the same speed which makes the vehicle pivot steering. Figure 8 is traveling hydraulic system pressure simulation curve of bilateral right steering. Figure 9 is right wheel torque simulation curve of bilateral right steering, and Figure 10 is left wheel torque simulation curve of bilateral right steering. Table 3 shows the traveling hydraulic system pressure dynamic response indicators of bilateral steering.
Traveling hydraulic system pressure dynamic response indicators of bilateral steering.

Traveling hydraulic system pressure of bilateral right steering.

Right wheel torque of bilateral right steering.

Left wheel torque of bilateral right steering.
By Table 3, the motor pressure of high pressure side can reach 22.8 MPa at the beginning of steering. In the bilateral steering stabilization phase, the mean value of left motor pressure is 16.7 MPa and the mean value of right motor pressure is 12.8 MPa and the left wheels pressure shocks obviously. In this condition, the torque and the slip rate of each driving wheel are not the same and the torque direction of left and right sides is opposite. The left torque is in positive direction and the right torque is in reverse direction.
Through the above analysis, the system pressure fluctuations and overshoot are larger in the course of bilateral steering. At this time, the interaction between tire and ground is complex and the steering resistance is maximal, which causes the hydraulic driving system being under tremendous alternating load.
5. Test
For traveling hydraulic system test, install pressure sensors in the variable pump, inlet and outlet oil port of traveling motor, outlet port of charge pump, both sides of variable cylinder, and so forth. Sensors arrangement is shown in Figure 11 and the detail of the sensor channel settings is shown in Table 4.
Details of the sensor channel settings.


Sensors arrangement.
Unilateral Steering. The unilateral steering results of the vehicle are shown in Figure 12. At the beginning of steering, the peak pressure of the left traveling motor can be up to 21.2 MPa and the peak pressure of the right traveling motor can be up to 15.6 MPa. The left traveling motor reached the peak pressure after 1.5 s and the right traveling motor reached the peak pressure after 2.5 s. At the stable stage of steering, the high side pressure of left traveling motor is 19.3 MPa and the high side pressure of right traveling motor is 13.4 MPa. At this time the charge pressure is 1.1 MPa. Known by comparing the simulation and the test, the difference of left traveling motor steady pressure is 0.7 MPa and the difference of right traveling motor steady pressure is 0.2 MPa. The comparison of simulation and test in unilateral steering condition shows that these two are relatively close either from the values or from trend.
Experimental results for traveling hydraulic system of unilateral steering.
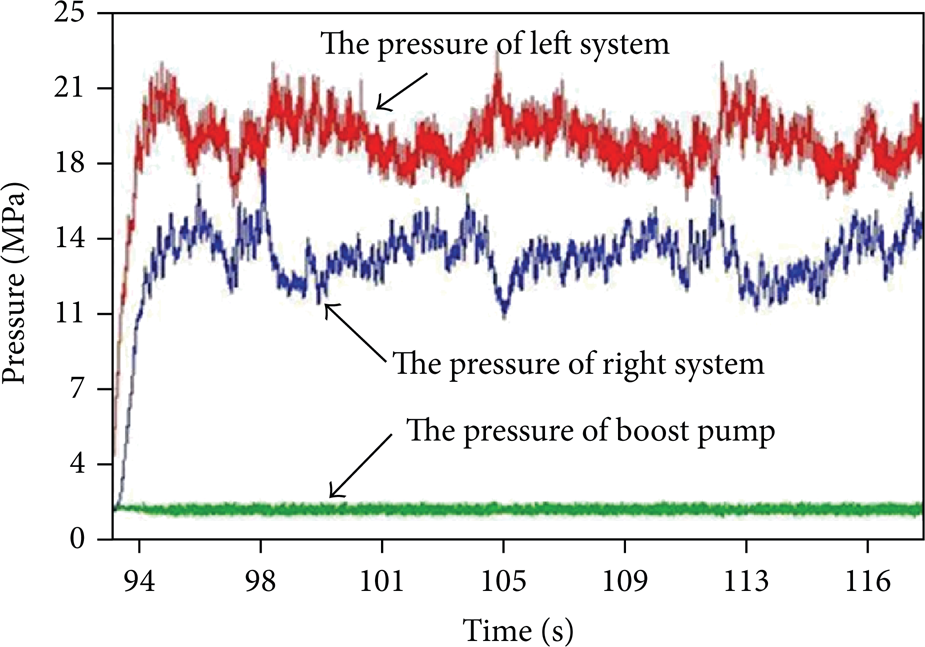
Bilateral Steering. The bilateral steering results of the vehicle are shown in Figure 13. At the beginning of steering, both left and right traveling motor pressures can reach 21.7 MPa. The left traveling motor reached the peak pressure after 0.67 s and the right traveling motor reached the peak pressure after 0.70 s. At the stable stage of steering, the high side pressure of left traveling motor is 15.9 MPa and the high side pressure of right traveling motor is 12.2 MPa. At this time the charge pressure is 1.3 MPa. Known by comparing the simulation and the test, the difference of the max pressure is 1.1 MPa, the difference of left traveling motor steady pressure is 0.8 MPa, and the difference of right traveling motor steady pressure is 0.6 MPa. The comparison of simulation and test in unilateral steering condition shows that these two are relatively close either from the values or from the trend in the matter of the duration of the steering initial phase and the system pressure of both sides.

Experimental results for traveling hydraulic system of bilateral steering.
It can be seen that the simulated pressure and time of the system have even smaller variations than the measured result, while the behavior is the same.
6. Cross-Validation and Results Discussion
In order to verify the error between the dynamic model and test results, the cross-validation between dynamic model data and test results is done. Figure 14 is the comparative results of the unilateral steering process.

Comparative results of the unilateral steering process.
Figure 14 shows that the average value of the left system pressure of dynamic model is 18.2 MPa and the average value of the left system pressure of test result is 19.3 MPa, and the error is 5.6%. The average value of the right system pressure of dynamic model is 13.6 MPa and the average value of the right system pressure of test result is 13.4 MPa, and the error is 1.5%.
Figure 15 is the comparative results of the bilateral steering process.
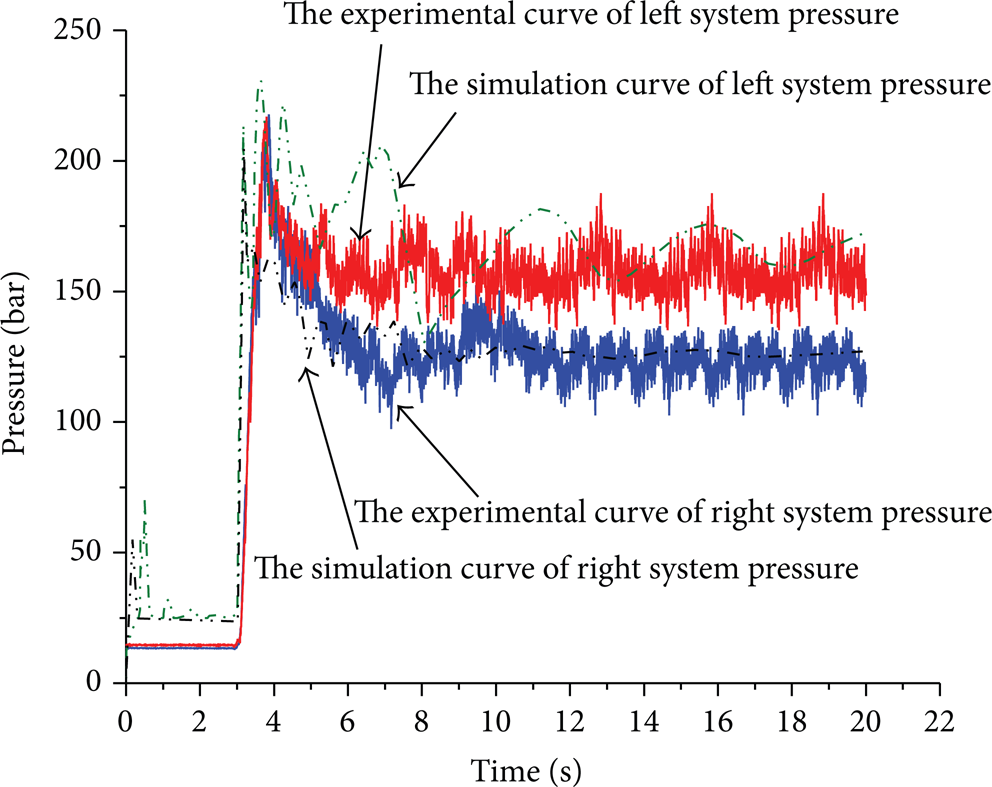
Comparative results of the bilateral steering process.
Figure 15 shows that the average value of the left system pressure of dynamic model is 16.7 MPa and the average value of the left system pressure of test result is 15.9 MPa, and the error is 5%. The average value of the right system pressure of dynamic model is 12.8 MPa and the average value of the right system pressure of test result is 12.2 MPa, and the error is 4.9%.
7. Conclusion
Analyze the steering characteristics of skid steer loader; establish the kinematics and dynamics model of the vehicle by using the slip theory of tracked vehicle and magic formulas, which provides a theoretical guidance to establish the simulation model.
Use AMESim software platform and Motion software platform to establish a cosimulation model of the vehicle steering system and conduct the cosimulation analysis. The simulation results show that this model can accurately accomplish the dynamic analysis of the vehicle steering characteristics.
The test results indicate that the cosimulation model and test results are relatively close either from the values or from the trend, which verifies that the method is feasible and the model is accurate.
Cross-validation between dynamic model and test results shows that the error between dynamic model and test results is within 10%. The model can predict and evaluate the steering performance of the vehicle.
Conflict of Interests
The authors declare that there is no conflict of interests regarding the publication of this paper.