
Abstract
Central heating is a sophisticated process, and many factors influence the heating loading for boilers; without comprehensively monitoring and analysis, it is difficult to find out potential hazards of substation heating supplying electrical equipment. This paper presents a wireless machine to machine based district heating monitoring solution that uses smart mobile devices in a global network. In particular, focusing on the design and implementation for GPRS-based multiserial data transmission terminals to collect the PLC/OPC data in the substation, machine to machine communication network is used to handle the transmission monitoring data from boiler room to master station via GPRS devices and data center that uses different smart mobile devices in a global network, and we also illustrated the mobile substation monitoring scenarios for district heating system. Finally, we give the conclusions and future works.
1. Introduction
The classic way is to divide district heating system into three parts: heating source, heating network, and heat consumers. Heat from heat sources—for example, heat plants like boilers, industrial excess heat, and geothermal or solar heat—is distributed in the heating network and transferred to the heat consumers. The substations where heat meters are situated are distributed in the heating network as a link between hot-water network and internal heating installations in buildings. Adequate control of all relevant parameters of heat meter in the heating process is one of the most significant means of power consumption optimization. District heating substations are used to adapt high pressure hot water to fit the temperature and pressure conditions required by heat consumer buildings as well as by the systems for the preparation of hot service water in buildings. To control the energy transfer in the district heating substation, some kind of control system is needed. The overall efficiency of district heating could be improved by using new strategies for measurement and control.
District heating is a sophisticated process, and heating supplying should vary as outside temperature and time periods change. If heat output of boiler is not timely adjusted, some heating will be wasted. Central heating electrical equipment requires the continuous monitoring at frequent intervals. There are possibilities of errors at measuring and various stages involved with human workers, and high accident risks are increasingly serious. Without comprehensive monitoring, it is difficult to find out potential hazards of heating supplying electrical equipment [1–8]. Figure 1 shows the central heating electrical boilers and heating exchange station equipments.

Central heating boilers and heating exchange station equipments.
With the rapid development of network technology and the promotion of industrial information technology, continuous improvement of industrial information technology and the expanding of its application field, the integration and networking of monitoring system have become an important direction of the central heating industrial areas. In heating substations, there is a need for measurement and supervision of different sizes and parameters, such as temperature of the water in the primary and secondary circle, the amount of heat submitted to heating substations, the amount of heat consumed by individual users, status of pumps, status of electric motor valves and electromagnetic valves, and distribution of the temperature of initial and recurrent lines of the heating grid, as well as monitoring other parameters and their transmission to the supervisory and management system at the dispatcher center.
There are many applications of different strategies for monitoring and control of district heating system. The Global Positioning System/General Packet Radio Service (GPS/GPRS) system for low power data acquisition using MSP430 Texas Instruments microcontroller for monitoring of the heating substation parameters is proposed [9]. The system is implemented in heating stations for a temperature and pressure monitoring. The distributed district heating substation monitoring system is proposed [10] for supervising the consumption of the customers and the parameters in every substation belonging to a district heating system as well as weather parameters that influence the whole thermal power demand. In every substation from district heating system, data acquisition centers are used for acquiring data from temperature, pressure, and flow sensors and also wireless sensor networks were developed for transferring the information from consumers, weather parameters sensors, and some particular technical measurement points. The upgrading of the district heating system through the wireless sensor networks is proposed [11], which will lead to more effective use of thermal energy, enabling also the provision of quality customer services, as the data concerning the status of the existing networks is available in a timely manner, and in the stated amounts. A pilot project conducted by Riga Heat (the main heating supplier in Riga, Latvia) has allowed gaining a real life experience as to the use of the wireless sensor network system in district in-house heating substations. Also, for the purpose, a control and communication architecture based on wireless sensor/actuator network is proposed [12], and the architecture is implemented through a wireless network of sensors and actuators to control the energy transfer from a district heating distribution network to a building while promoting the potential of Service Oriented Architecture (SOA) towards an easy integration and expansion of the pervasive technology. The intellectualized distributed data acquisition system based on the CAN bus with multichannel and multifunction is proposed [13], The high accuracy embedded controller with HMI (Human Machine Interface) which supported by the high resolution LCD and the long-distance communication ability. Fuzzy logic control is implemented and the good performance of the fuzzy control proves that this can be an alternative to the classic control, which can enhance the advantage of the central heating supply system and has a very high practicality value. Also, an alternative approach to the problem of district heating monitoring parameters selection is proposed [14–17]. The wireless technology compared with nonwireless technology has some important benefits, for example the reduced system cost and the easier installation and maintenance.
The communication network is the contact hub of the whole heating monitoring control system, through which heating transfer station, heat source, and monitoring nodes form a unified whole. To achieve centralized monitoring and control of the operating data, communication network must be established which can connect all monitoring nodes. With advances in mobile communication, new opportunities have opened up for the development of district heating systems that remotely monitor signals from the boiler and heating substations. The availability of a new generation of mobile phones has had an important impact on the development of such district heating systems, as they seamlessly integrate with a wide variety of networks (such as 3G, Bluetooth, wireless LAN, WCDMA, and GSM) and thus enable the transmission of recorded signals to staff from a central server located in a safety monitoring center.
The monitoring of heating network parameters may be accomplished with the use of equipment installed in heating substations or network chambers. If measuring points are scattered, the efficient communication between them is critical. The distance between the transmitter and the receiver may vary considerably and may reach even tens of kilometers. Currently, central heating system generally uses the following kinds of centralized communication mode: wired communication and wireless communication. Wired communication mainly contains dial-up communications, fiber optic communication, industrial fieldbus, and so forth. Wireless communication mainly contains satellite communication, wireless Bluetooth communication, microwave communication, and so forth. Because both modes have their advantages and disadvantages, it should be chosen by actual situation and requirements. The main communication modes are 485 bus, Public Switched Telephone Network (PSTN), wireless data radio, and GPRS network. Their advantages and disadvantages are shown in Table 1.
Comparison of communication modes.
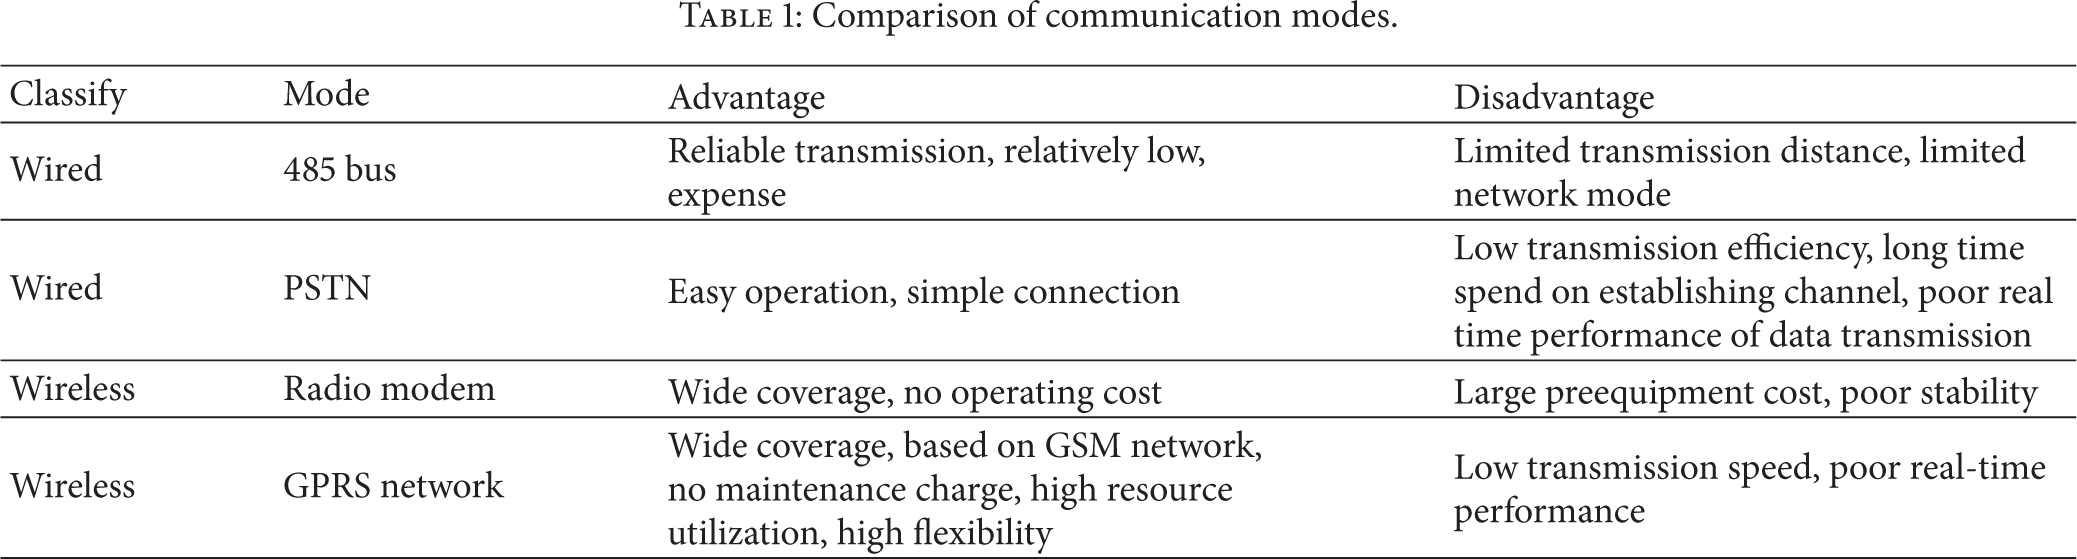
By comparing several means of communication modes, we chose the GPRS network to transmit between from heart transfer station and the master station considering the real situation. GPRS is a technology added to the GSM architecture to allow transmission of packet switched data (PSD). A packet-switched network makes it possible to transmit data as packets where each packet contains a destination address. This mean that all packets do not need to travel the same path and can be routed via different paths as traffic conditions change. The packets can even arrive out of order as each packet has a sequence number. By using the packet switched technology, it is possible to be online virtually all the time without having to pay large amount of money for merely being online.
Machine to machine (M2M) was originally proposed by Sony Ericsson Mobile Communication several years ago. It represents a new concept necessary for proposing effective solutions to the problem of the communication between people and mobile equipment or machine to machine to achieve the purpose of remote monitoring. For example, the data transmission between machines could be solved by distributed data collection terminals. The collected data from the terminals will be transmitted by wireless transmission and then received by the specialized unified collection modules at the data control center which is responsible for processing the received data and sending control commands to the data terminals. The advantages of M2M technology are as follows: automatically data uploading without manual operation which could improve the efficiency of information processing; centralized data processing and preservation which could realize centralized information management; long retention time of data and high storage security; real-time monitoring and control; wireless transmission avoiding wiring; terminal operating status monitoring which insure the stable operation, and so forth.
This paper describes a wireless M2M district heating monitoring solution that uses mobile devices in a global network. We give below a summary of scientific and innovation aspects.
The GPS/GPRS is used to develop a wireless data acquisition system. The multiserial data terminal is used to collect the PLC/OPC data from the central heating substations, which includes the different condition parameters measurement for central heating substation via GPRS wireless communications.
The GPRS based M2M network is implemented in central heating monitoring applications, which provides reliable communication to transmit the data from the substations to the master station server. The user terminals can directly communicate with the M2M nodes.
The mobile central heating substation monitoring system is developed for a novel M2M solution based on Android mobile devices. A smartphone is used as monitoring terminal, which has the capacity to provide central substation monitoring services anywhere.
The rest of the paper is organized as follows. In Section 2, a wireless M2M district heating system architecture is proposed. Section 3 describes the experiments and performance measurement. The conclusions and future work are given in Section 4.
2. Architecture
The overall architecture of a wireless M2M district heating system for the monitoring of a substation's environment and devices state according to the flexible and scalable data center and mobile communication is shown in Figure 2.

System structure.
This system has three components: GPRS-based multiserial data transmission terminals, communication network, and data center solution that uses smart mobile devices in a global network. The specific functions are described as follows.
GPRS-based multiserial data transmission terminals and data acquisition: series information collection devices and on-site sensors realize the parameters collection (such as temperature, pressure, flow, circulation pump status, tank water level status, etc.) and actuator control at heat transfer station with PLC system as the core.
M2M communication network selects different communication networks for different acquisition targets. For example, since the wide spread of the urban thermal stations, the data collected by terminals needs to be sent to the heating network monitoring center through GSM/GPRS wireless network. So the communication between terminals and monitoring center uses DTU communication model, which is a wireless terminal device designed to exchange IP data and serial data through GPRS wireless communication network.
Data center and mobile applications: data center realizes data transmission, data display, storage, query, and statistical printing and uses Android mobile devices to access the data center for the substation monitoring in a global network.
2.1. M2M Devices and Local Sensor Data Acquisition
Concerning GPRS-based multiserial data transmission terminals and data acquisition layer, there are a lot of sensors connected to programmable logic controller (PLC) to obtain the terminal real time data. So in this part the data need to be read from PLC to PC via COM1 port and stored in the database of PC. Local data collection protocol is used for providing real and useful data such as DELTA DVP Series PLC Communication Protocol.
The task of this part is to read the data from PLC to PC via COM1 port and store the data in the database of PC. The data transmission model is shown in Figure 3.

Data transmission model.
First, the PC opens the serial port so that PC and PLC could transmit data with each other. Then the PC will send a request package to tell the PLC the address and length of the needed data according to the protocol. Next, the PLC will send a response package back carrying the needed data. The flow chart is shown in Figure 4.

General flow chart of local data collection.
In this part, first there is a need to obtain the serial port parameters: baud rate, flow control in, flow control out, data bits, stop bits, parity, from the database and set the parameter to serial port. Then, to open the serial port to send the request package to PLC. When receiving the request package, PLC will make a response. PLC will send the response package to PC through the serial port. PC will get the response package via reading the serial port. And then PC will interpret the useful data and process the data and then store data in the real time database. The program will perform the tasks in loops to send and receive package again and again. Here, MODBUS is an application layer messaging protocol, which provides client/server communication between devices connected on different types of buses or networks. The MODBUS protocol allows an easy communication within all types of network architectures. Every type of devices (PLC, HMI, Control Panel, Driver, Motion control, I/O Device, etc.) can use MODBUS protocol to initiate a remote operation. The same communication can be done as well on serial line as on an Ethernet TCP/IP networks. Gateways allow a communication between several types of buses or network using the MODBUS protocol. The MODBUS protocol is shown in Figure 5, which defines a simple protocol data unit (PDU) independent of the underlying communication layers. The mapping of MODBUS protocol on specific buses or network can introduce some additional fields on the application data unit (ADU).
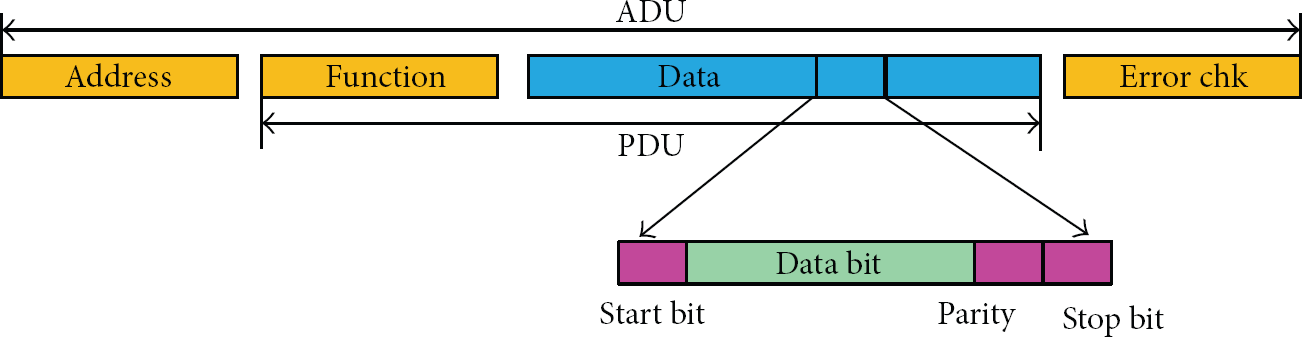
Modbus communication format.
The MODBUS application data unit is built by the client that initiates a MODBUS transact on. The function indicates to the server what kind of action to perform. The MODBUS application protocol establishes the format of a request initiated by a client. Two different serial transmission modes are defined: the RTU mode and the ASCII mode. It defines the bit contents of message fields transmitted serially on the line. It determines how information is packed into the message fields and decoded. When devices are setup to communicate on a MODBUS serial line using American Standard Code for Information Interchange (ASCII) mode, each 8-bit byte in a message is sent as two ASCII characters. This mode is used when the physical communication link or the capabilities of the device does not allow the conformance with RTU mode requirements regarding timers management. The request package format under ASCII mode is shown in Table 2.

The response package format under ASCII mode is shown in Table 3.

Under the ASCII mode, except for STX and END, other data must be in the format of ASCII. Each character should be separated into two characters. For example, “5A” must be separated into “5” and “A,” and turn them to ASCII code. The ASCII code for “5” is 53 and the ASCII code for “A” is 65. So, “5A” will be 53 and 65.
When devices communicate on a MODBUS serial line using the Remote Terminal Unit (RTU) mode, each 8-bit byte in a message contains two 4-bit hexadecimal characters. The main advantage of this mode is that its greater character density allows better data throughput than ASCII mode for the same baud rate. Each message must be transmitted in a continuous stream of characters. The request package format under RTU mode is shown in Table 4.
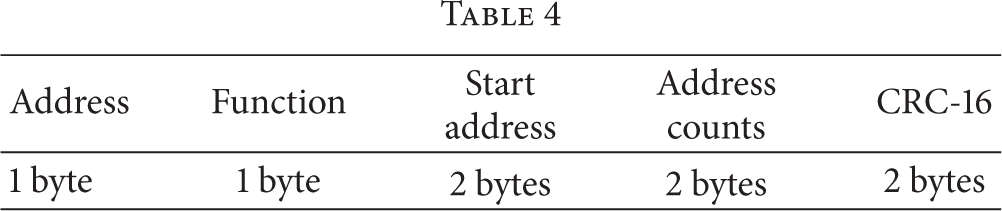
The response package format under RTU mode is shown in Table 5.

There is no start and end characters in RTU mode. Instead, it uses the time interval to determine the end of a package. If the time interval is bigger than 3.5 character time length, it means that the package has been transmitted as shown in Figure 6.

RTU mode.
In the RTU mode, it transmits data in character, and no need to transform them into ASCII code. The PLC reads data continuously in accordance with the register address. For example, if I want to collect the data in 0000, 0001, 0010, and 0011, it will collect all the data from 0000 to 0011. So in the response package, I need to pick out the data needed. Additionally, one register address (e.g., one hex form address 08AE) will get two bytes of data response. The user data length in the response package is the double of the address counts.
Here we used RTU mode, for example. After introducing the MODBUS protocol, I will explain how I form the request packet and process the response packet.
To create the request packet, it is needed to determine the table type. The request packet of analog table is different from digital table, and here we use the analog table shown in Table 6.

Here, sensor_id field means the address of register where the data is stored. Word_count field means the number of register unit that the data use. For example, sensor_id = D0 and word_count = 2 mean that the data whose Device_id = 9 and PLC_id = 1 is stored in D0 and D1.
In order to form the analog request packet, first there is a need to query the gl_analog_measure in database to find the sensor_ids and word_counts of the same device_id and sensor_id and then store them in an array. And change the address into DVP communication address in hexadecimal. Because the data is stored in PLC dispersedly, the data is split by comparing the high byte of the address. Start address will be the first address and data count will be the last address minus the first address. Now we can packet the package the request format. And the request packet will be sent in circulation.
When receives the response packet, the first thing to do is to check the packet to determine whether it is right or not. If it is not right, it will request this packet again. If it is right, it will parse the data and then update the database. When it parses the data, the first thing to do is to copy the data in start address from the package which contains the data in useless register address. And then query the table address division in database, to check whether it is the record we need. If it is the right one, update the database, add the address according to word count, and check it in database until the package end. If it is not the right one, check the next address. And the response packet will also be received in circulation.
First establish a connection to the H2 database and obtain serial port parameters from database. Get the comport identifier and open the serial port. Open the connection to the serial port so that you can read or write to it. The class diagram is shown in Figure 7.
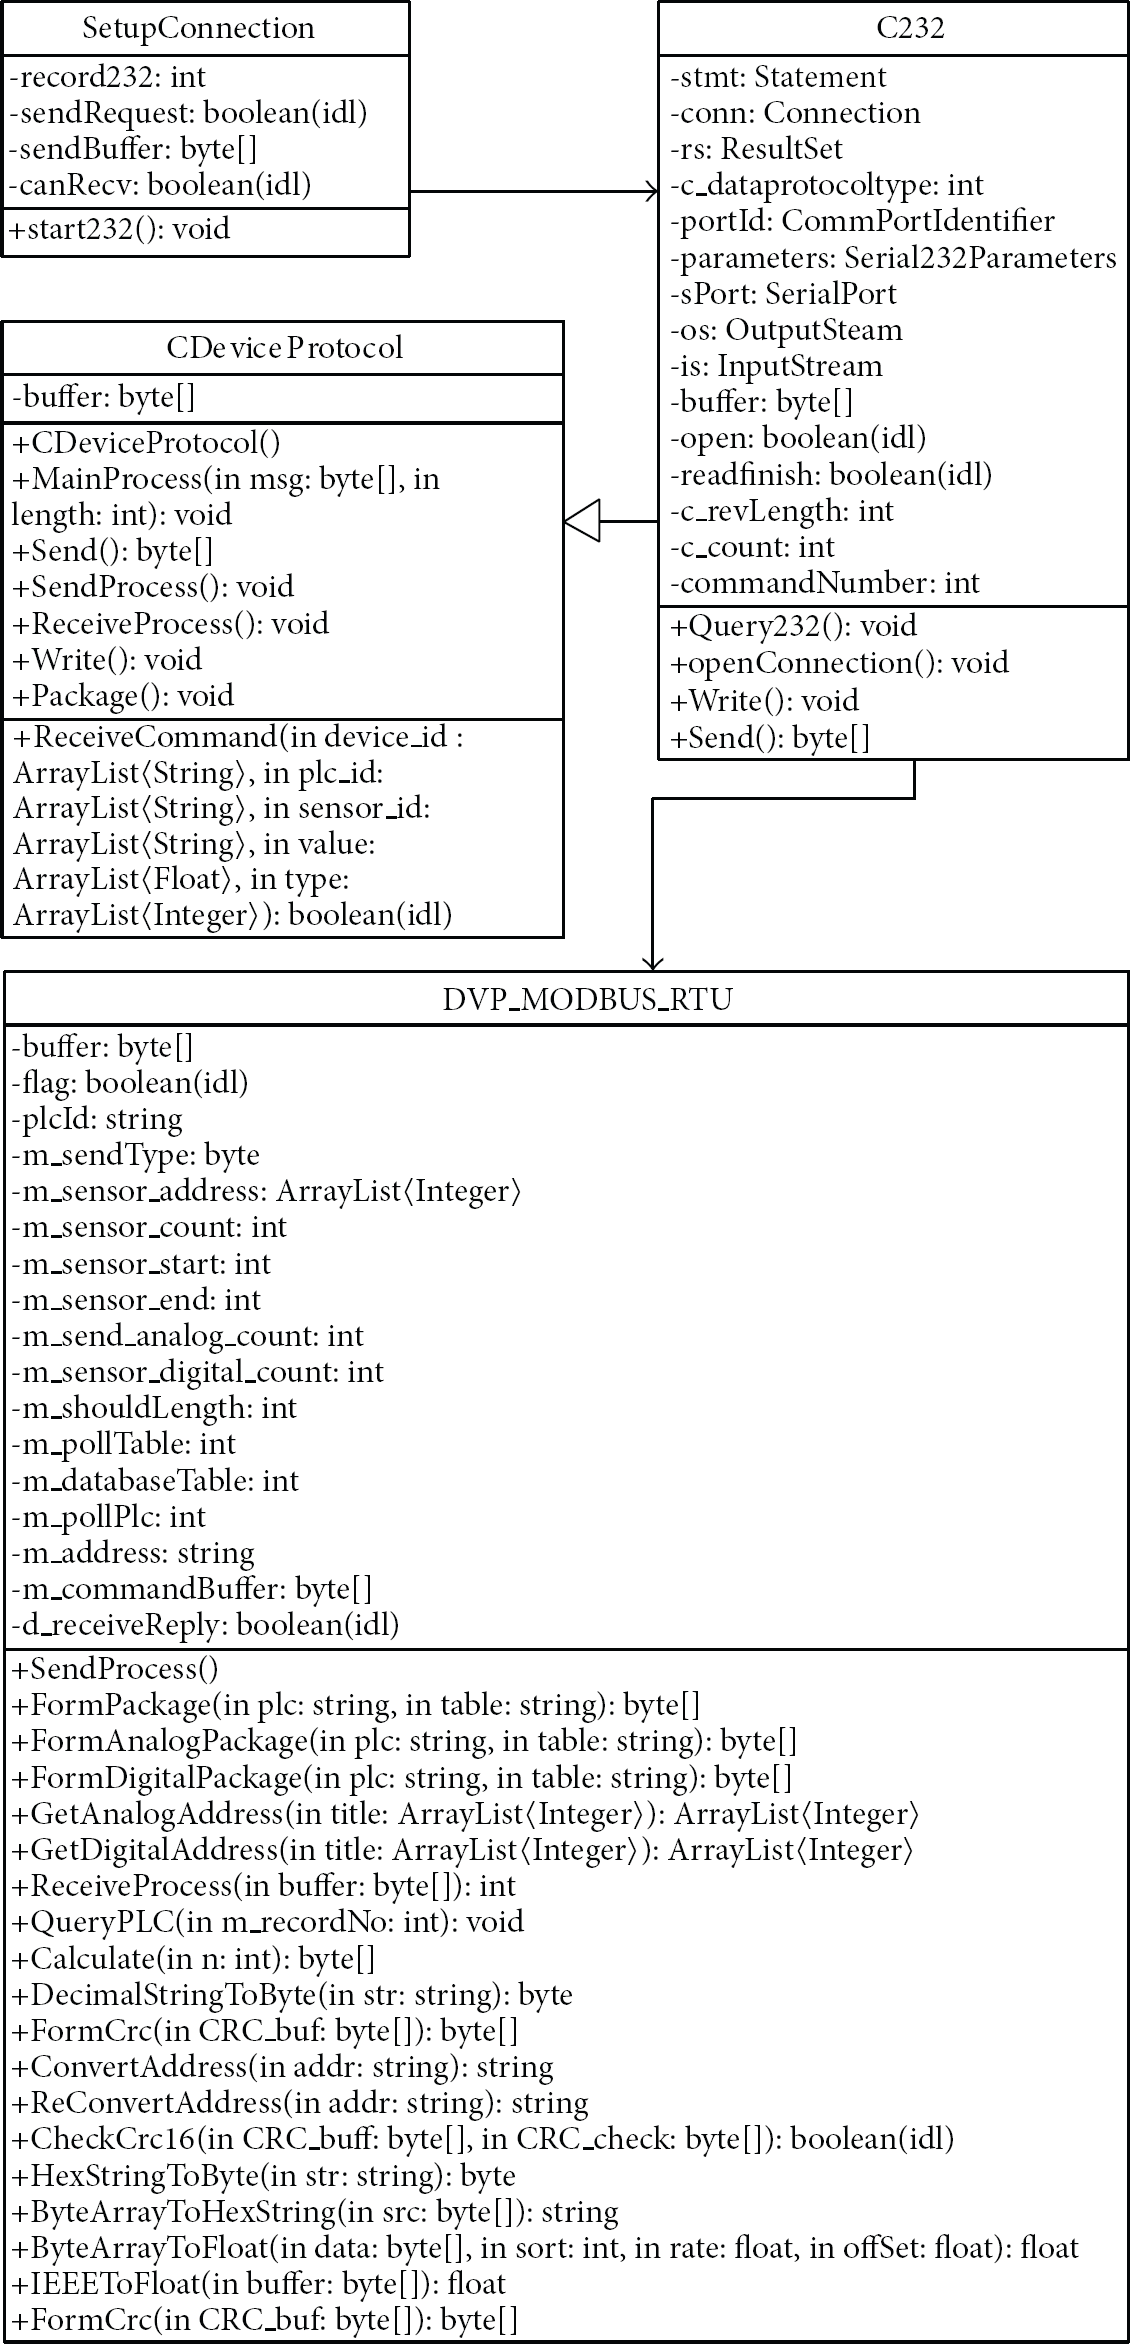
General class diagram.
The class DVP_MODBUS_RTU is about the protocol. The request package and response package are all formed in this class. The C232 class is about the serial port: open the serial port and read/write the serial port. So in this class, it calls the functions SendProcess( ) and ReceiveProcess( ) in DVP_MODBUS_RTU class to send request package or receive response package. SetupConnection class is the main class. It calls the functions Send ( ), Write ( ), Receive ( ), and SendBreak ( ) in C232 class.
2.2. M2M Communication Network and Data Transmission
Data transmission protocol is used for establishing data transmission channel. For example, the serial port protocol is used for providing serial port channel and HongDian H7000 protocol is used for providing socket channel. In the local data collection part, the terminal data has been stored in local database. So in the wireless transmitting part which handles processing and transparent transmission of data, I need to write the data to the GPRS device and make a socket connection between substation and master station. Then send data to master station via the connect connection. The flow chart of this part is shown in Figure 8.
General flow chart of wireless transmission.
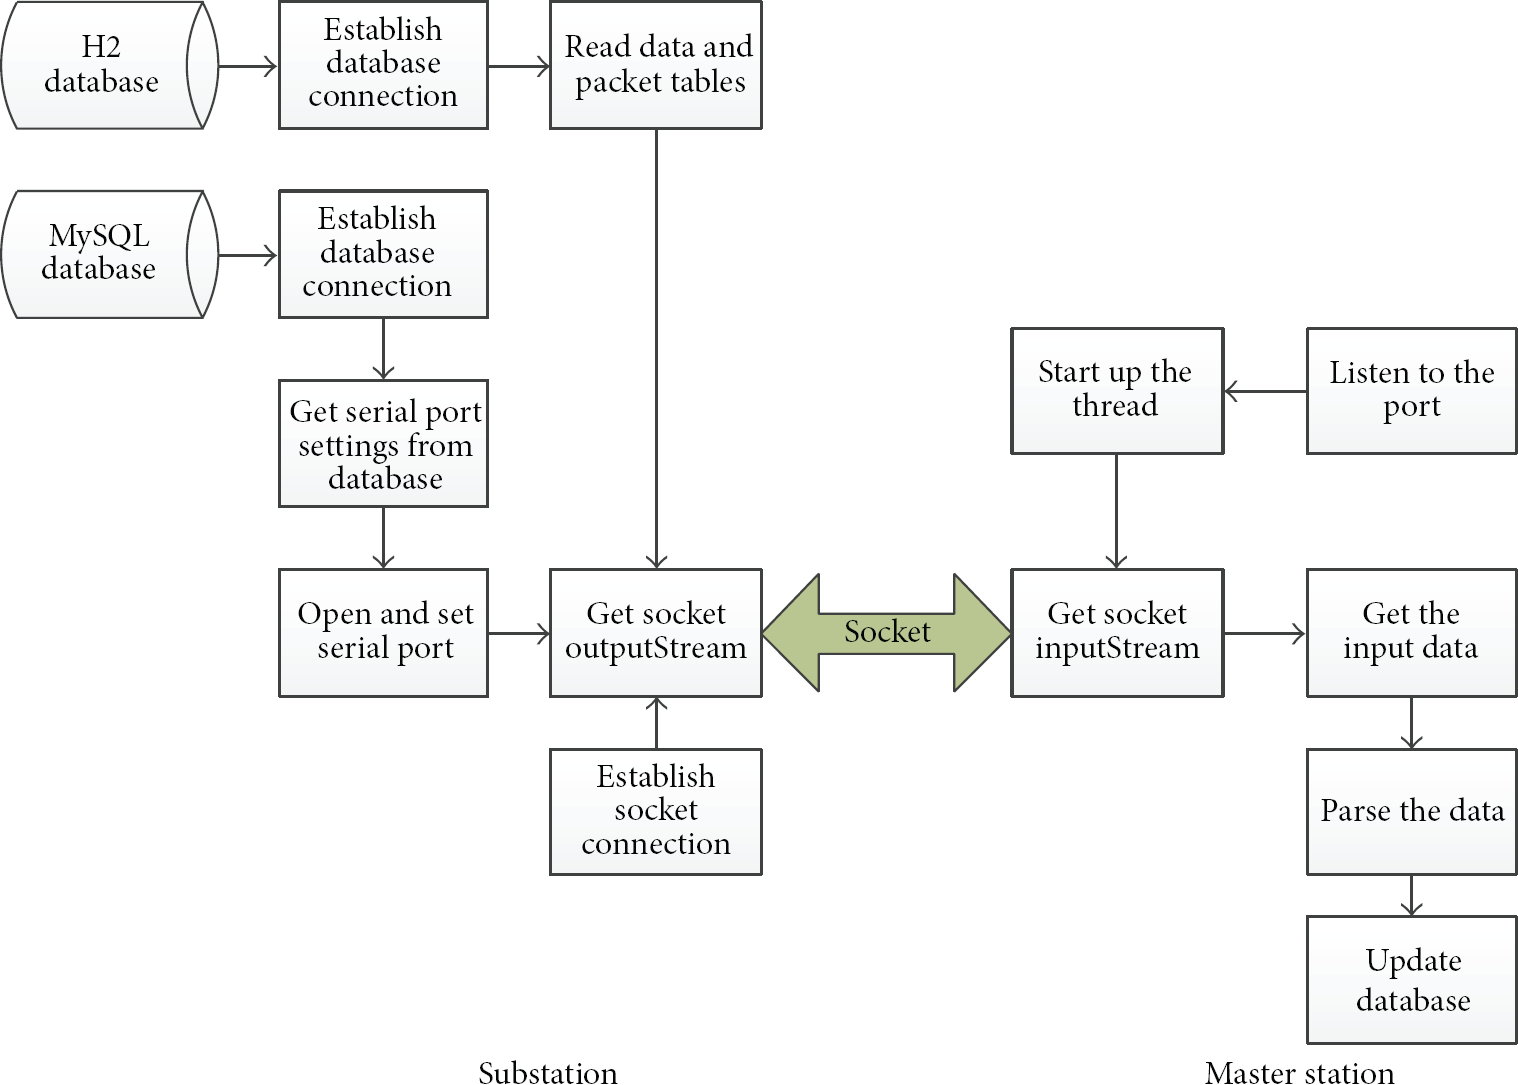
First, there is a need to obtain data from H2 database and set the serial port parameters. Connect the H2 database to obtain the real-time data and then write the data to COM2, so the data could be transmitted using GPRS device wirelessly. The GPRS device needs a SIM card to transmit data. The principle of wireless data transmission is similar to surfing the internet with cellphone. The GPRS device will first register to the base station and then establish a socket connection to the master station using the IP address set in the device. The substation is the socket client. It sends data to the server. The master station is the socket server; it will listen to a port to wait the client's data. Multiple threads are used here, so the master station can receive the data from multiple clients. Then the master station will update its database according to the data it received from the substation. The class diagram of this part is shown in Figure 9.
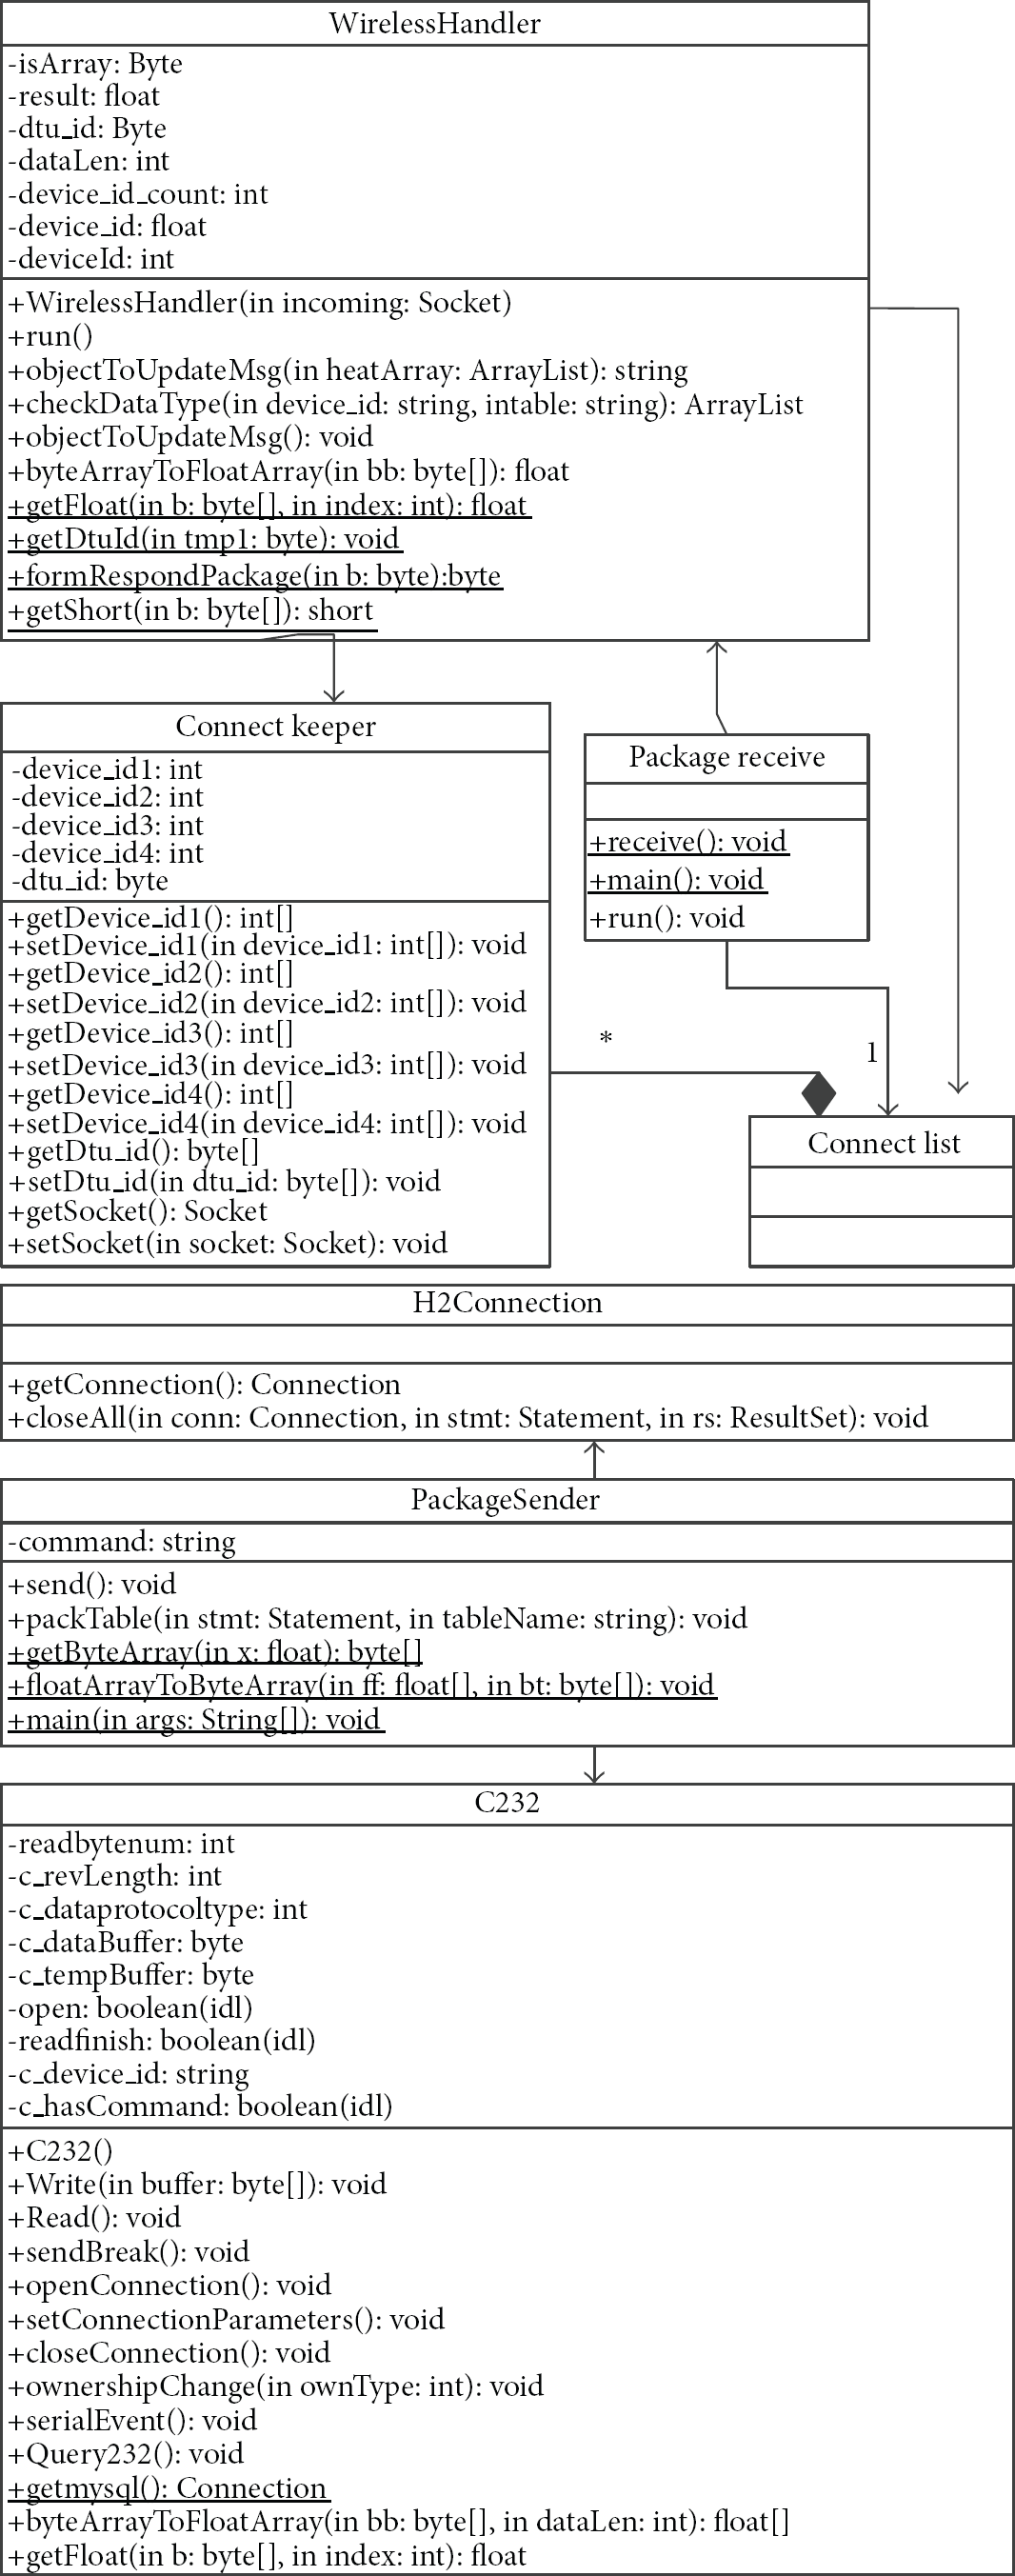
General class diagram.
The detailed explanation of each class in the class diagram for substation is introduced as follows. Here, the H2Connection Class is mainly responsible for open and close connection with the H2 database. When using java to connect the H2 database, you need to add the JAR file-h2.jar-into eclipse referenced library. Because of the H2 console, SQL language can be used in Java code to query the H2 database. To access an in-memory database from another process or from another computer, a TCP server needs to be started in the same process as the in-memory database was created. The other processes then need to access the database over TCP/IP or SSL/TLS, using a database URL such as jdbc:h2:tcp://localhost/mem: test. The C232 Class is about the serial port. It is similar to the C232 class in Object Sensing Layer. The PackageSender Class is the response for sending data package wirelessly in the substation. Due to the GPRS device, the maximum bytes in a package are 1024 Byte including 16 Byte headers; the user data can have 252 float (1008 Byte).
First, open the serial port and set its parameter. Then establish the connection with H2 database. Packet the table in H2 database and write them into serial port. The rules of pack table: GL_ANALOG_CONTROL table are used for example in order to explain it clearly. Some parts are shown in Table 7.
GL_ANALOG_CONTROL table.

Here, define some data structure as float

Flow chart of pack table.
The detailed explanation of each class in the class diagram for master station is introduced as follows. Here, the ConnectKeeper Class declares a constructor named ConnectKeeper used to keep socket connection and the operation of socket connection. It includes set and get method about device_id, dtu_id, and socket. The ConnetctList Class declares a constructor about socket connect keeper and thread list. The WirelessHandler Class is used to get the input stream, parse data according to the protocol of GPRS DTU, and the rule of pack table and then update the database. Data packet formats of GPRS DTU are described in Table 8.
(a) Register package: DTU → DSC. (b) ACK package: DSC → DTU. (c) Data packet: DTU → DSC.

According to the protocol, first the GPRS device sends a register package from substation to master station whose type flag is 1. Then the master station sends an ACK package back. The master station will check whether the socket is included in the threads pool of ConnectList. If not, the socket will be added to the ConnectList. Next, the GPRS device sends a data packet to master station whose type flag is 9. Then it will pick out the data from data packet. Then it will parse the data according to the rule that packed it. Because those four tables are similar, and explain only one table: GL_ANALOG_CONTROL. The steps are shown in Figure 11.

Flow chart of WirelessHandler.
The data
Finally, the PackageReceiver Class is used to receive data at the middleware platform. It is a socket server using multiple threads. The server will listen to the port. So that it can receive data package from different substations. It keeps on running.
2.3. Data Center and Mobile Application Services
In the data exchange part, the data has been already transmitted into master station and inserted into database. So in the Application Service part, this data needs to be displayed in a mobile application. Nowadays, there are many kinds of operation systems, such as Android, IOS, and Windows Phone. So it is eager to build the cross-platform application. A good solution to this problem is PhoneGap—a platform could build cross-platform application using standardized web APIs-JavaScript, CSS, and html. An Android application will be used as an example. First data need to be extracted from the database, converted into an XML files, and then displayed in a table of Android App. Because XML data is expressed in plain textual format, XML is a platform independent language to store data which provides an easier way that data can be shared by different applications. Dom4j is used to build the XML file. Since the real-time data in database is changing all the time, the XML file will be generated for every 10 seconds. The function of creatXmlFile is described in Algorithm 1.
XMLWriter xmlWriter = String elementValue = “”; Document doc = DocumentHelper.createDocument(); Element rootElement = doc.addElement(“ROWDATA”); Element rowElement = rootElement.addElement(“ROW”); Element elementName = rowElement.addElement(rsmd.getColumnName(i)); Object obj = rs.getObject(rsmd.getColumnName(i)); } elementName.setText(elementValue); xmlWriter =
Algorithm 1
The PhoneGap framework is used to create Android apps using standardized web APIs-JavaScript, CSS, and html. First, there is a need to parse data from the XML file. Here, Dom4j also used to parse the XML file and used one node for example. First, it is important to get the child node of the root node. Next get its child root. And then get the node value. Because the XML file is reloaded every 10 seconds, the HTML file will be refreshed every 10 seconds to show the real-time data as shown in Algorithm 2.
xmlhttp.open(“POST”, “table.xml”, xmlhttp.send(); document_xml = xmlhttp.responseXML; document.getElementById(“a1”).innerHTML = type1; document.getElementById(“b1”).innerHTML = value1; }
Algorithm 2
3. Experiments and Performance Measurement
Here, the HongDian H7000 GPRS DTU (Date Transfer Unit) is used for wireless transmission which is a terminal product based on GPRS data communication network. It embedded many protocols PPP, TCP/IP, and DDP into the GPRS module. The GPRS module needs a SIM card to transmit the data wirelessly. The principle of wireless data transmission is similar to surfing the internet with cellphone. The GPRS device registers to the base station and get an IP address. So, the GPRS module could connect with the server and establish a socket connection. Write the data to COM2 from COM1 of PC and transport the data using GPRS. At the substation, the GPRS M2M device is connected to the PC as shown in Figure 12.

GPRS based M2M devices.
The PLC has connected with PC via serial port. Transmit data from PLC to PC. The output information is shown in Algorithm 3.
Algorithm 3
Transmit data from substation to master station via GPRS device. The output at the master station is shown in Algorithm 4.
Input stream length: 22 The stream is [123, 1, 0, 22, 57, 56, 54, 35, 52, 51, 50, 49, 52, 51, −84, 25, −1, −119, 123] DTU id is 98765432143 This is Register Package DTU id is 98765432143 This is Data Package, please parse it. The package received is [4.0, 3.0, 4.0, 29.0, 0.0, 0.0, 0.0, 0.0, 0.0, 0.0, 0.0, 0.0, 0.0, 0.0, 0.0, 0.0, 0.0, 0.0, 0.0, 0.0, 0.0, 0.0, 0.0, 0.0, 0.0, 0.0, 1000.0, 0.0, 0.0, 0.0, 0.0, 0.0, 0.0, 0.0, 0.0, No. 1 device_id = 1.0, length: 13 [1.0, 1.0, 2.0, 2.0, 2.0, 22.0, 1.0, 2.0, 2.0, 2.0, 2.0, 23.0, 22.0]
Algorithm 4
Finally, a cross-platform application is built using standardized web APIs-JavaScript, CSS, and html to display the data in table. Figure 13 shows the value for mobile substation monitoring application scenario.

Mobile monitoring value application scenario.
Figure 14 shows the real-time curve for water temperature. In particular, the x-axis stands for time and the value is updated in every 5 s.

“Supply Water Temperature” in real-time curve scenario.
In particular, the industrial fields exchange data with the server using GPRS connection protocol which has the packet loss situation. So, the test for statistics and analysis of the packet loss between the field and server is needed. In addition, since the data access is real time, it is also needed to measure the delay.
The first experiment was to test the response time. The relationship between the sending rate and the response time is shown in Figure 15. The sending rate is represented by the package; the GPRS device sends in every 10 minutes. Record its response time. The abscissa represents the sending rate. The ordinate represents the response time.

Response time experiment.
It is observed from Figure 15 that the response time is decreased when the sending rate increases. When the package is sending faster, the master station will increase its response speed. But the response time has a limit.
The second experiment was to test the packet loss number due to the transmission of data packet using GPRS module. Since data packet transmitted by GPRS module has the serial number field, the loss ratio can be measured by the statistics the serial number of receiving packets. In the experiment, 10 GPRS modules were deployed for sending data at the cycle of 30 seconds and to conduct a loss statistics when the server received 2000 data packets. The statistical result is shown in Figure 16.

Packet loss statistics.
It is observed from Figure 16 that the value of the abscissa indicates the number of data in the 10 experiments receiving 2000 data each. Ordinate represents the number of loss. We can find that, when receiving the total 20,000 data, 15 loss events occurred. The average package loss rate of the experiment is only 0.75%. Packet loss is in a relatively low range which met the requirements.
The third experiment was to test the delay. Delay means the time interval between the user accesses the server resources and the server gives back the data to user though the interaction between the sensor and the data to acquire the data needed by the user. In fact, the delay is mainly generated by the communication delay between the server and sensor. In this experiment, 10 GPRS module is deployed to transmit underlying sensor data with a circle of every 30 seconds. We made 10 experiments in total and recorded every delay in a file. The server calculated a delay when it received 2000 data packets. Figure 17 shows the statistical result of the experiment.
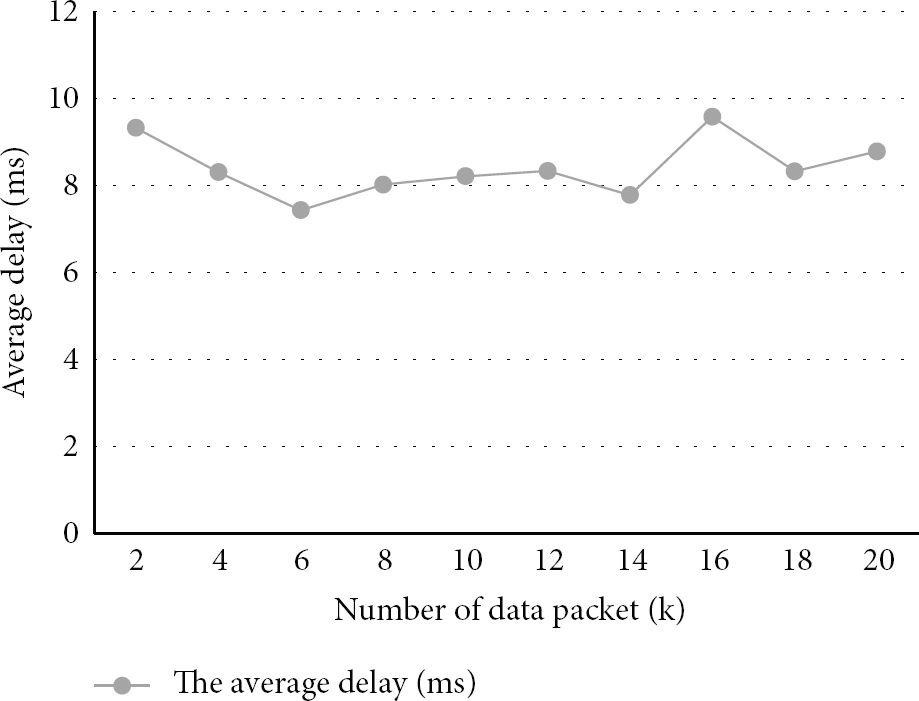
Statistical result of delay.
It is observed from Figure 17 that the value of the abscissa indicates the number of data in the 10 experiments receiving 2000 data each. Ordinate represents the number of delay with the unit of millisecond. We can find from the figure that the delays of 10 experiments are 9.324691, 8.304323, 7.43123, 8.021342, 8.211280, 8.33452, 7.78127, 9.58279, 8.32645, and 8.78372. The delays are mainly less than 10 millisecond which basically meets the requirements of real-time data transmission.
The fourth experiment was to test the CPU utilization for master station server. When multiple substations connect with master station, and the master station used multiple threads to communicate with those substations. This test shows the relationship between the number of substation and the CPU utilization. Figure 18 shows the result of CPU utilization.

The CPU utilization experiment.
It is observed from Figure 18 that, when the number of substation increases, the CPU utilization in master station is increasing because of the increasing number of the number of threads. So the number of substation cannot be too large.
4. Conclusion and Future Work
This paper constructs the GPRS based wireless machine to machine remote substation monitoring system for district heating. Focusing on the design and implementation for GPRS-based multiserial data transmission terminals to collect the PLC/OPC data in the substation, machine to machine communication network is used to handle the transmission monitoring data from boiler room to master station via GPRS devices and data center that uses different smart mobile devices in a global network, and we also illustrated the mobile substation monitoring scenarios for district heating system. In the future work, to realize the alarming function of the system. If there is data exceeding the threshold value, the system will warn the principal to ensure the safety of the boiler room. Since there are lots of types of protocols for electrical equipment, the system will be extended to suit more protocols, and the performance should be tested in larger scale deployment environment.
Footnotes
Conflict of Interests
The authors declare that there is no conflict of interests regarding the publication of this paper.