
Abstract
The carbon/carbon (C/C) composites are composed of carbon fibers, carbon matrix, and pores and cracks, which have been successfully used in various aerospace applications. In this paper, nanoscale submodel is proposed to describe the thermal conductivity of the matrix based on its microscopic structure, and then the submodel is incorporated into a microscale model to analytically predict the equivalent thermal conductivities of the composites by equivalent circuit approach. The results predicted by the present model agree well with those from the experimental measurements. Based on the model, the effects of the composite porosity as well as the thickness and porosity of the interface phase on the thermal performance of five composites are studied. It is found that the thermal conductivities show decreasing trends in responding to an increase in each of the three parameters. The composite porosity has a significant effect on the thermal conductivities both parallel and transverse to the fiber axis, while the thickness and the porosity of the interface phase remarkably affect the thermal conductivity only transverse to the fiber axis.
1. Introduction
Carbon/carbon (C/C) composites are composed of carbon fibers based on carbon precursors embedded in a carbon matrix; they have been successfully used in various aerospace applications such as aircraft disc brakes, rocket reentry nose tips, and rocket nozzles, due to their high thermal conductivity, shock resistance, specific strength, specific modulus, and fatigue strength, as well as low density and thermal expansion [1–3].
The fabrication of C/C composites mainly consists of producing the fiber precursor and then densifying this with the carbon matrix. A large variety of fiber and matrix materials as well as thermal processing schemes are used to fabricate C/C composites. The high modulus fibers are generally based on polyacrylonitrile (PAN) or pitch, while the matrices may be resin-based, pitch-based, or pyrolysis-based. When different combination of fiber and matrix is adopted, C/C composites have different microstructure [4–10]. For example, an interface generally forms between the fiber and matrix, and the fiber/matrix interface can be divided into four kinds: parallel plate structure, vertical plate structure, sheath-like structure, and isotropic structure [11].
The thermal conductivity is an important parameter for evaluating the thermal performance of C/C composites. Many studies have experimentally measured the thermal conductivity of C/C composites [5–8, 10, 12–22]. Whittaker et al. [18, 19] reported a comprehensive thermal diffusivity measurement of C/C composites with uniaxial and biaxial PAN fiber in the temperature range of 500–3000 K. Pilling et al. [20] measured the thermal conductivities of C/C composites with unidirectional and bidirectional resin fiber at temperature of 80–270 K. These studies confirmed that the thermal conductivity of C/C composites is closely dependent on the structure parameters, such as the volume fraction of fiber [5, 6], structure of fiber/matrix interface [12], pores and cracks [13], and graphitization degree of the matrix [14–17]. Because C/C composites have multiscale and multicomponent structure characteristics, the heat transfer mechanisms within the composites are very complicated; the experimental investigations cannot provide a quantitative relation between the structure parameters and thermal conductivities of the composites. Hence, theoretical modeling and numerical simulation have been used to predict the thermal conductivity of C/C composites [21, 23–34]. Table 1 summarizes the recent numerical investigations by LBM (lattice Boltzmann method), FEM (finite element method), and Mori-Tanaka method. The advantage of the numerical method is that it can simulate C/C composites with the complex microstructure. However, the numerical method cannot obtain the analytical solution of the thermal conductivity, it is not convenient to engineering calculations and cannot provide a rapid guide to material design.
Numerical simulations of thermal conductivity for C/C composites.

The purpose of this paper is to develop an analytical model to predict the thermal conductivities of C/C composites with pitch-based matrix. Firstly, a nanoscale submodel is proposed to describe the thermal conductivity of the matrix based on the concept of unit cell. The unit cell consists of several layers of graphene and their surrounding nanopore. Then the submodel is incorporated into a microscale model to predict the equivalent thermal conductivity of the composites by the so-called equivalent circuit approach. The present model considers the effects of fiber/matrix interface, heterogeneity of the matrix, and pores and cracks. Finally, the model is used to predict the thermal conductivities parallel and transverse to the fiber axis for five C/C composites, and the predictions are compared with experimental data. The present model is expected to provide a theoretical guideline for structure design of C/C composites.
2. Structure of C/C Composites with Pitch-Based Matrix
The thermal conductivities of the C/C composites are dependent on the microstructure of composites. This work focuses on the C/C composites with unidirectional fiber distribution. Their microstructure is shown in Figure 1, which is provided by the Aerospace Research Institute of Materials and Processing Technology. Carbon fibers arrange in parallel and the carbon matrix surrounds the fibers. Pitch-based matrix is highly anisotropic which orients in a sheath-like structure. Within the pitch-based matrix, unit cells tend to align themselves around the surface of the nearby fibers. The graphitization degree of the matrix is relatively higher near the fiber, and the graphitization degree decreases gradually. Since the matrix with high graphitization degree has a large thermal conductivity, the thermal conductivity of the matrix is relatively high near the fiber.

SEM images of C/C composite with pitch-based matrix.
The transverse sections of mesophase pitch-based carbon fibers can be divided into the following categories: fibers with the typical radial open wedge transverse texture, fibers with the typical random texture, fibers with quasi-onion texture, and fibers with transition texture of the above three typical textures [35]. Mesophase pitch-based carbon fibers have compact textures with few micropores and cracks. However, there are many micropores and cracks randomly distributed around the center of the transverse sections of PAN-based carbon fibers [24]. As a result, the thermal conductivity parallel to the fiber axis for mesophase pitch-based carbon fibers is larger than that for PAN-based carbon fibers.
The interface between the fiber and matrix for the pitch-based matrix C/C composite also orients in a sheath-like structure. The interface may be fully bonded, partially bonded, or fully debonded. Meanwhile, there are some microcracks on the fiber/matrix interface.
3. Model
Based on typical structure characteristics of C/C composites with unidirectional fiber distribution, a three-dimensional microstructure (Figure 2) is extracted to develop their thermal conductivity model. The model adopts the following assumptions: (a) the carbon fiber is assumed to be a cylinder with large aspect ratio; (b) the fibers arrange in parallel, and the matrix surrounds the fibers; (c) the matrix has nonuniform graphitization degree and hence has nonuniform thermal conductivity; (d) there exists an interface phase between the matrix and fiber, and the matrix/fiber interface can be well developed or poorly developed, which depends on whether there are micropores and cracks in the fiber/matrix interface.
Simplified structure of C/C composites with unidirectional fiber distribution.
Since the matrix is assumed to have nonuniform graphitization degree, a nanoscale model is developed to describe the relation between the thermal conductivity and graphitization degree of the matrix. Then, the equivalent circuit approach is used to construct the equivalent thermal conductivity model of the composites based on its microstructure as shown in Figure 2. The length and diameter of the fiber are L and D; fiber spacings are H1 and H2 in x- and y-direction, respectively.
3.1. Nanoscale Thermal Conductivity Model of Carbon Matrix
At nanoscale, the carbon matrix is regarded to be composed of many unit cells as shown in Figure 3(a), which is a partial section in the matrix. The unit cell is assumed to be the rectangular with side lengths of L a and L c in the present work. Although the unit cells are distributed nonuniformly within the whole matrix, it is reasonably assumed that the unit cells have the locally uniform distribution, where every unit cell has the same sizes of L a and L c and the same inclination angle θ (0 < θ < π/2) as shown in Figure 3(b). Thus, a high graphitization degree means a large size of L a and L c and a small inclination angle of the unit cell. Based on the symmetry of local distribution of the unit cells, a nanoscale microstructure, as shown in Figure 3(c), is extracted to analyze the effect of the unit cell size and inclination on the matrix thermal conductivity. The nanoscale microstructure includes only a single unit cell, and the rest of microstructure is nanopore. The porosity of the microstructure, Ψ, is defined as the volume ratio of the nanopore to the microstructure.
Matrix structure: (a) nonuniform distribution of unit cells within the matrix; (b) locally uniform distribution of unit cells; (c) nanoscale microstructure.
For a material composed of two components, such as the present nanoscale microstructure, the parallel arrangement of the two components gives the upper limit of thermal conductivity of the material, while the series arrangement gives the lower limit of thermal conductivity of the material. Thus, the thermal conductivity of material can be expressed between the upper and lower limits using an improved parallel-series model as follows:

where λ1 is the thermal conductivity of the unit cell, λ2 is the thermal conductivity of the pore, λ m is the thermal conductivity of the nanoscale microstructure, A is the fraction of heat transport in the parallel mode, and 1 − A is the fraction of heat transport in the series mode. The fraction A is related to the size and inclination of the unit cell. The fraction of heat transport in the parallel mode A in (1) expresses the ratio of active length of heat transfer to the side length of the unit cell. In detail, when the heat flux is parallel to the x axis, the active length of heat transfer is L a cos θ, and the side length is L a cos θ + L c sinθ. Likewise, when the heat flux is transverse to the x axis, the active length of heat transfer is L a sinθ, and the side length is L a sinθ + L c cos θ. Thus, the thermal conductivity of the nanoscale microstructure parallel and transverse to the heat flux can be expressed, respectively, as follows:


The unit cell is assumed to be ideal graphite structure, so λ1 = 1435 W·m−1 K−1 [36]. The thermal conductivity of nanopore can be expressed as follows [25]:

where C = 1.55, d g ≈ 0.353 nm is the air molecules diameter, d is the mean pore diameter, k B = 1.38 × 10⁻²³ J·K−1 is the Boltzmann constant, p and T are the pressure and temperature in the pore, and λg0 is the thermal conductivity of air in the infinite space, which can be fitted as a function of the temperature using experimental data and expressed as [37]

3.2. Thermal Conductivity Model of C/C Composites
3.2.1. Heat Flux Parallel to the Fiber Axis
A microscale microstructure, which includes only a quarter of fiber and matrix due to geometry symmetry, is used to model the thermal conductivity of the C/C composites as shown in Figure 4. Isothermal boundary conditions are applied to left-hand side and right-hand side surfaces of the microstructure, while adiabatic or symmetric boundary conditions are applied to the other surfaces; thus, a one-dimensional heat transfer will occur within the microstructure.
Microscale microstructure used to construct the thermal conductivity model of C/C composites.
The energy transferred by conduction in the microstructure consists of two parts: Q f transferred through the fiber and Q m transferred through the matrix, which can be expressed as

where λ f, p is the axial thermal conductivity of fiber and λ m, p is the effective thermal conductivity of the matrix. The equivalent thermal conductivity parallel to the fiber axis for the C/C composite can be expressed:

Due to fiber induction effect, the matrix adjacent to the fiber has high graphitization degree, and the graphitization degree gradually decreases as the matrix is away from the fiber. For the present sheath-like matrix structure, it can be assumed that the matrix with the same distance from the fiber center has the same graphitization degree. In other words, the contours of graphitization degree in the matrix are concentric circles. Based on the nanoscale microstructure of the matrix, the graphitization degree can be characterized by the inclination angle and size of the unit cell, and a large size and a small inclination angle denote high graphitization degree. Hence, two limits of inclination angle can be introduced: θdown at r = D/2 and θup at

For simplification of analysis, the matrix is only divided into three parts according to its graphitization degree as shown in Figure 5. Such simplification means that an average graphitization degree is adopted for each part of the matrix. Thus, the average thermal conductivities for three parts of the matrix are λm, p1, λm, p2, and λm, p3, respectively. According to (8), λm, p1 and λm, p2 can be expressed as

where the function f(θ) is calculated by (2) and θ1 and θ2 are the averaged-inclination angle for parts 1 and 2. Part 3 can be divided into two subparts A and B (Figure 5), and their averaged-inclination angles are θ3A and θ3B expressed as
Thus, we have

where S A and S B are the areas of subparts A and B. Thus, the effective thermal conductivity of the matrix can be expressed as follows:
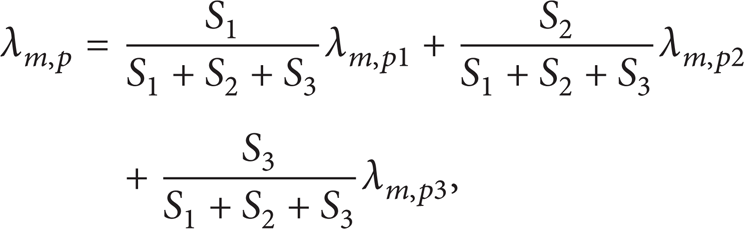
where S1, S2, and S3 are the areas of parts 1, 2, and 3.

Heat flux parallel to the fiber axis.
In the fabrication of C/C composites, if the fiber and matrix do not bond well, microcracks inevitably appear in the fiber/matrix interface phase. The interface phase can be regarded to be composed of the matrix and micropores and cracks, as shown in Figure 6, so that λ m, p in (12) needs to be modified. Generally, if the interface phase is very thick, the fabrication of C/C composites is unsuccessful; hence, the thickness of the interface phase, hinterface, is assumed to be smaller than (H2 − D)/2 here.

Fiber/matrix interface in the C/C composites.
Provided that air is filled to the microcracks, the thermal conductivity of the microcracks can be taken as the thermal conductivity of air. Using the improved parallel-series model of two-component material, the thermal conductivity of the interface phase can be expressed as

where λm, p, interface, λ m, p , and λair are the thermal conductivities of the interface phase, matrix, and air, ϕ is the porosity of the interface phase, B is the fraction of heat transport in the parallel mode, and 1 − B is the fraction of heat transport in the series mode. Thus, when the interface phase is taken into account, (12) can be modified as

where Sinterface is the area of the interface phase and S1* = S1 − Sinterface. As a result, the modified effective thermal conductivity of the matrix, λm, p, modified, can be substituted for λ m, p in (7), and the modified equivalent thermal conductivity parallel to the fiber axis for the C/C composites, λeff, 1, modified, can be obtained.
It is noted that both of the fiber and the matrix also contain some cracks and voids and the cracks and voids randomly distribute in the fibers and matrix. Therefore, the effective medium theory (EMT) model [38] can be used to modify the equivalent thermal conductivity of the C/C composites (7):

where φ is the porosity of C/C composites.
3.2.2. Heat Flux Transverse to the Fiber Axis
When heat flux is transverse to the fiber axis, equivalent thermal conductivities of C/C composites are the same in the x- and y-direction. As shown in Figure 7, two boundaries with x = 0 and H1/2 are both isothermal, and a temperature difference, ΔT, is applied to them. The other two boundaries with y = 0 and H2/2 are both adiabatic.
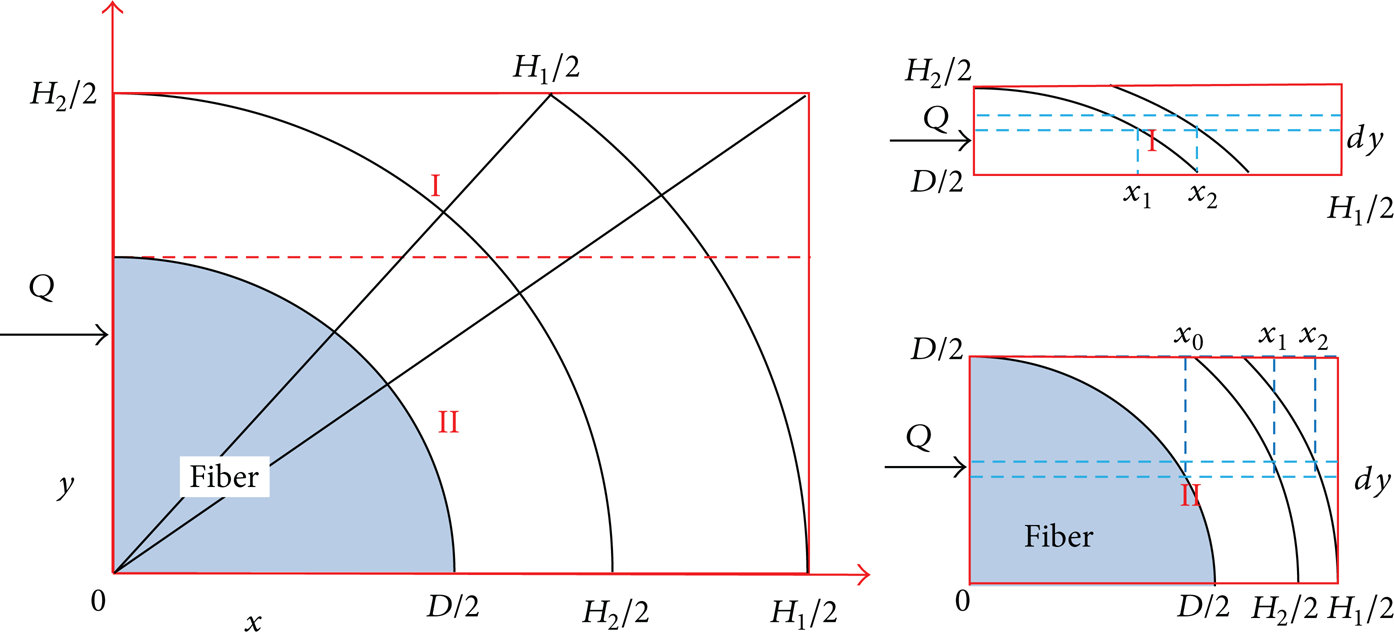
Heat flux transverse to the fiber axis.
The energy transferred by conduction in the microstructure consists of two regions: QI transferred through region I and QII transferred through region II, as shown in Figure 7, or

where λeff, 2 is the thermal conductivity of C/C composites transverse to the fiber axis.
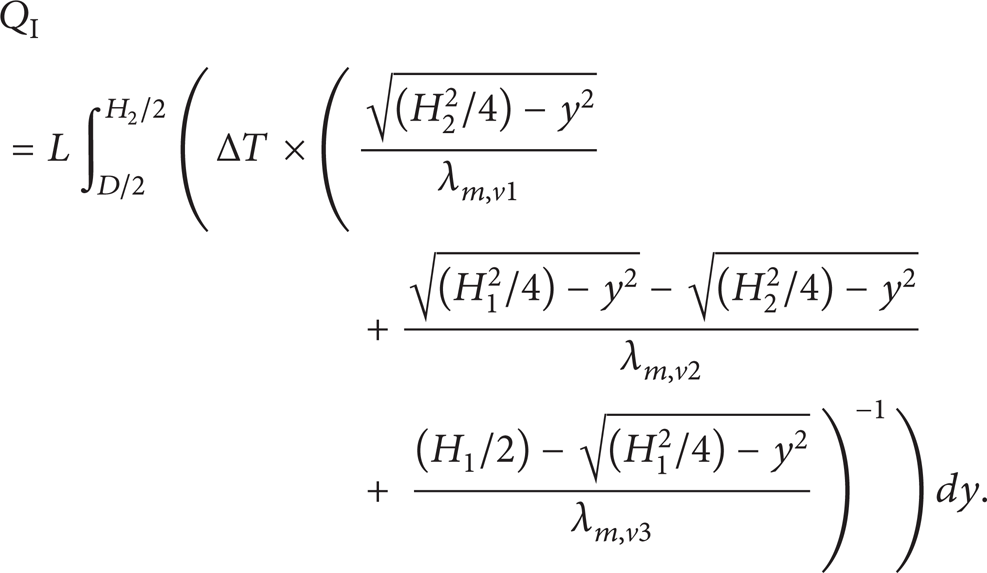
Region I contains only matrix and the matrix can be divided into three parts with different graphitization degrees. The total heat flow through region I can be calculated by integrating the heat flux in thin layer y ∼ y + dy with respect to y. Based on Fourier's law, heat flux in thin layer y ∼ y + dy can be expressed as

where λm, v1, λm, v2, and λm, v3 are average thermal conductivities for the three parts in region I and can be expressed as follows:

Thus, the total heat flow through in region I can be expressed as
Region II contains both fiber and matrix. Similarly, heat flux in the thin layer y ∼ y + dy is calculated firstly:

where λ f, v is the fiber thermal conductivity transverse to the fiber axis and λm, v11, λm, v2, and λm, v3 are the average thermal conductivities for the three corresponding parts of the matrix in region II.
The total heat flow through region II can be integrated by
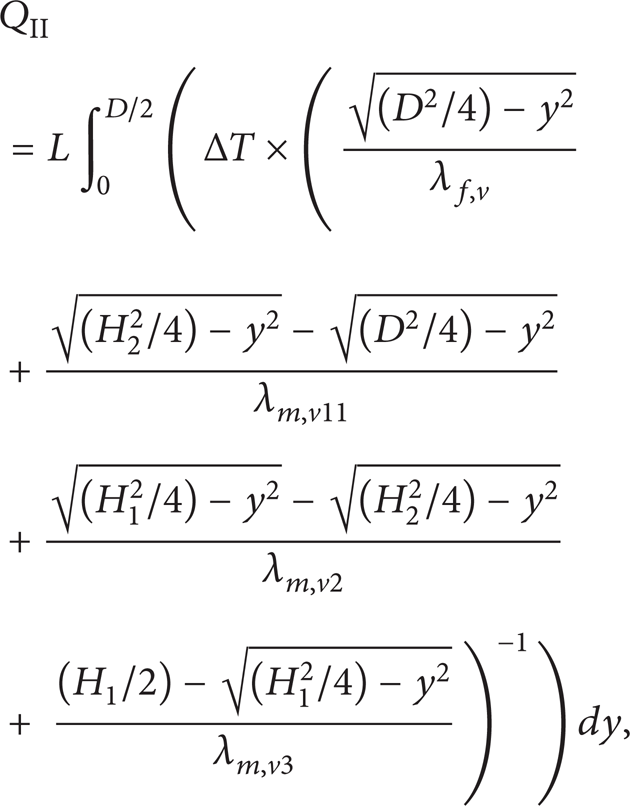
where λm, v11 can be expressed as

Finally, by substituting (19) and (21) into (16), the equivalent thermal conductivity of C/C composites transverse to the fiber axis is

Similar to modeling the thermal conductivity parallel to the fiber axis of the C/C composite in Section 3.2.1, when the interface phase is considered, the model should be modified. The modified thermal conductivity is
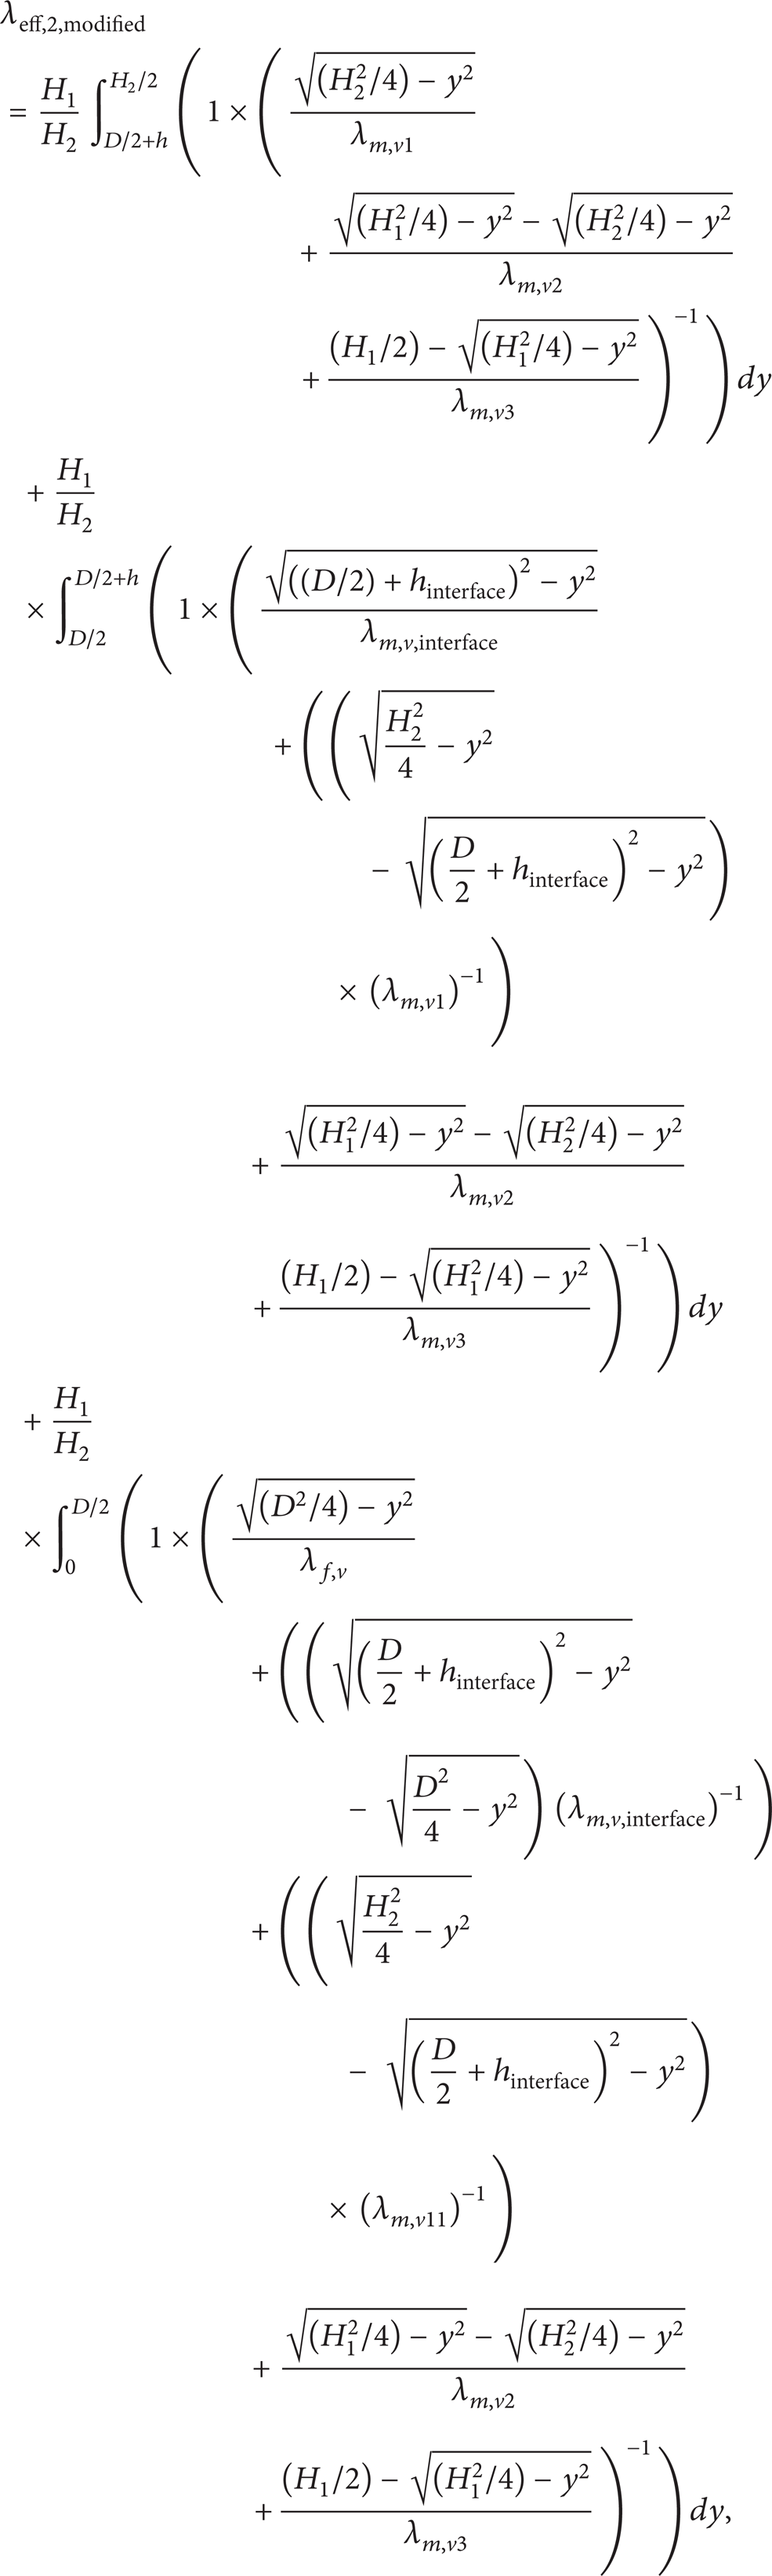
where the thermal conductivity of the interface phase, λm, v, interface, can be calculated by the thermal conductivity of matrix λ m, v and the thermal conductivity of air λair, using the improved parallel-series model of two-component material:

where B is the fraction of heat transport in the parallel mode, 1 − B is the fraction of heat transport in the series mode, and ϕ is the porosity of the interface phase.
When cracks and voids in the fiber and matrix are considered, the equivalent thermal conductivity of C/C composites transverse to the fiber axis needs to be further modified as

4. Results and Discussion
Experimental data of thermal conductivities for five C/C composites listed in Table 2 provided by the Aerospace Research Institute of Materials and Processing Technology and [6] are used to validate the present model. All the data are measured at room temperature. The Matlab 7.5 R2007b code is used to perform the calculation. In the five composites, T300 fiber is PAN-based, P25, XN60, and P100 fibers are mesophase pitch-based, AR matrix is mesophase pitch-based, and PitchA matrix is pitch-based.
Experimentally measured parameters of C/C composites.

Experimentally measured parameters of C/C composites are listed in Table 2, where
Table 3 lists the parameters of C/C composites, which cannot be measured experimentally. These parameters are determined by either calculation from the parameters in Table 2 or fitting through comparison of the predicted and measured thermal conductivities of C/C composites. The fiber spacings H1 and H2 can be calculated by the volume fraction and diameter of fibers which meet D < H2 < H1. Because of the lack of measured H2 of T300/AR, P25/AR, and XN60/AR, based on the volume fraction of the fiber, it is assumed that H2 = 7.00 μm for T300/AR, P25/AR, and XN60/AR. The porosity of the nanoscale microstructure, ψ, can be calculated by L a , L c , and θ of the unit cell as shown in Figure 3(c). Based on the results in [25], the thickness of the interface phase, hinterface, should be in the range from 0.1 to 1.0 μm. Moreover, the interface phase is assumed to be only located in part 1 of the matrix in the present model; hence, 0.1 μm < hinterface < (H2 − D)/2. There are few studies on the measurements of the porosity of the interface phase. However, the porosity of the interface phase,ϕ, is always larger than that of the composite, φ, because the interface phase is composed of smaller size of micropores and cracks. For the five composites, 0.023 < φ < 0.16, and the matrix and fiber are assumed to be only partially debonded; hence, the fitting value of ϕ is limited between 0.4 and 0.6. The fraction of heat transport in the parallel mode, B, in (13) and (25), is also set as an adjustable parameter with its fitting value depending on the distribution of microcracks in the interface phase.
Calculated or fitted parameters of C/C composites.

Based on the parameters in Tables 2 and 3, the thermal conductivities parallel (λeff, 1′) and transverse (λeff, 2′) to the fiber axis are calculated and the results are listed in Table 4, where the measured thermal conductivities are also provided by the Aerospace Research Institute of Materials and Technology. To calculate the maximum relative deviation of λeff, 1′ is only 0.78% for all the five composites. For λeff, 2′, though the relative deviation increases to 7.16% for T300/AR composite, the relative deviation keeps a small value lower than 3.03% for the remaining four composites. The comparison above confirms that the present model can accurately predict the thermal conductivities of C/C composites.
Comparisons of predicted thermal conductivities with experimentally-measured ones for C/C composites.

Note: the relative deviation is defined as |λ′exp − λ′pre|/λ′exp , where λ′exp is the measured value and λ′pre is the predicted value.
The structure parameters of C/C composites, such as the porosity of the composites (φ) as well as the thickness (hinterface) and porosity (ϕ) of the interface phase, affect the thermal performance of the composites significantly. In the following discussion, the parameters in Tables 2 and 3 are defined as baseline parameters of the five composites. To evaluate the effects of the structure parameters φ, hinterface, and ϕ, only one structure parameter is changed for each case with all the other parameters as the same as the baseline parameters. The evaluation is expected to provide guidance for the material design of C/C composites.
As shown in Table 5, thermal conductivities parallel and transverse to the fiber axis for the five C/C composites are evaluated at different composite porosities. The values of thermal conductivities for all the C/C composites decrease with the increase of φ, and the value parallel to the fiber axis decreases more significantly. Taking T300/AR composite as an example, the value is 352.90 W·m−1 K−1 for λeff, 1′ and 55.60 W·m−1 K−1 for λeff, 2′ at φ = 0.04; when φ is increased to 0.48, the value is reduced by 247.77 W·m−1 K−1 for λeff, 1′ and by 39.03 W·m−1 K−1 for λeff, 2′.
Thermal conductivities of C/C composites at different composite porosities.

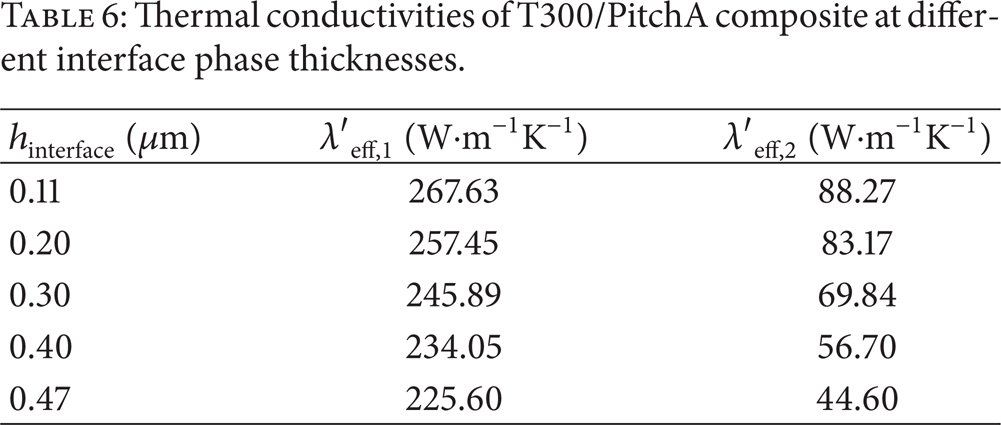
As mentioned above, the interface phase thickness meets 0.1 μm < hinterface < (H2 − D)/2. The five composites have different H2 and D leading to the different upper limit of hinterface, and hence only T300/PitchA composite is discussed here as an example. The thermal conductivities parallel and transverse to the fiber axis at different interface phase thicknesses are listed in Table 6. It is found that λeff, 1′ and λeff, 2′ show a decreasing trend in responding to an increase in the hinterface. Furthermore, Table 6 also shows that the thermal conductivity value decreases by only 15.70% for λeff, 1′ when hinterface is increased from 0.11 to 0.47. However, a more significant reduction of 49.47% is observed for λeff, 2′.
Thermal conductivities of T300/PitchA composite at different interface phase thicknesses.
The interface phase porosity, ϕ, also affects the thermal conductivities of C/C composites, as shown in Table 7. Similar to φ and hinterface, the increase in ϕ causes the reduction in both λeff, 1′ and λeff, 2′. However, ϕ has a smaller effect on λeff, 1′ than on λeff, 2′. It is especially true for P100/PitchA composite: λeff, 1′ only decreases by 5.15 (=325.15 − 320.00) W·m−1 K−1, while λeff, 2′ decreases by 67.70 (=111.55 − 43.85) W·m−1 K−1.
Thermal conductivities of C/C composites at different interface phase porosities.

5. Conclusions
This paper develops an analytical model to predict the thermal conductivities parallel and transverse to the fiber axis for the C/C composites with pitch-based matrix. The model considers the effects of the fiber/matrix interface, nonuniform graphitization degree in the matrix, and pores/cracks. The predictions of five C/C composites are compared with the experimentally data. The comparisons show that the maximum relative deviation of the thermal conductivity parallel to the fiber axis is only 0.78% for all the five composites. For the thermal conductivity transverse to the fiber axis, the relative deviation remains a small value except a larger deviation of 7.16% for T300/AR composite. Generally, the developed model can analytically predict the equivalent thermal conductivities of the composites by equivalent circuit approach. However, because of the lack of experimental data in micro- and nanoscale, we obtained several parameters of C/C composites in Table 3 by calculation or fitting from experimental data in macroscale. The prediction would be more accurate when the parameter can be obtained experimentally. Furthermore, the effects of the composite porosity (φ) as well as the thickness (hinterface) and porosity (ϕ) of the interface phase on the thermal performance of the five composites are studied. The results show that the thermal conductivities decrease as the three parameters increase. In particular, φ has a significant effect on the thermal conductivities both parallel and transverse to the fiber axis. For hinterface and ϕ, however, they remarkably influence the thermal conductivity only transverse to the fiber axis.
Conflict of Interests
The authors declare that there is no conflict of interests regarding the publication of this paper.
Footnotes
Acknowledgments
This study was partially supported by National Basic Research Program of China (no. 2011CB605802), the 111 Project (no. B12034), Program for New Century Excellent Talents in University (no. NCET-11-0635), and the Fundamental Research Funds for the Central Universities (nos. 12ZX12 and 13ZX13).