
Abstract
A huge and a complex internal computation is required to visualize the underwater geometry of a fishing gear, because each particle of the gear should be calculated with consideration of several force vectors, such as the movements of the fishing vessel, the buoyancy of the gear, and the tension of pulling or pursing acting on the net panels. The internal computation is the main drawback for providing a real-time visualization that takes into account the force vectors and the changes of underwater environments which can be obtained from the multiple sonar sensors. This paper presents a three-dimensional (3D) visualization tool that offers real-time simulations of the trawl fishing gear using parallel processing for the particles applying the force vectors. This tool also offers different underwater geometries for each fishing gear through a multiview display. The tool employs OpenMP APIs and OpenGL libraries to calculate in parallel the particles and to draw the underwater shapes of fishing gears, respectively. This work can be applied to other simulation systems for analyzing the precise model of graphical geometries as well as modeling the underwater shapes of fishing gears.
1. Introduction
Prior work has been introduced to improve simulation methods with precise modeling of the underwater geometry of the fishing gears, because underwater actions on the shapes of the fishing gears are important to obtain successful fish capture. Prior visualization tools [1–3] have been developed through the modeling of purse fisheries rather than the 3D modeling of the trawl fishing gears. However, these tools also present only the interpretation of figures for a shaping model of fisheries without variant force vectors [4] although it is a research related to shaping models for trawl fishing gears. Moreover, it requires a huge and a complex internal computation to visualize the underwater shapes of the fishing gear, because each particle of a fishing gear should be calculated considering several force vectors, such as the movements of the fishing vessel, the buoyancy of the gear and the tension of pulling or pursing acting on the net panels (i.e., 3,000 to 5,000 particles are usually connected for the geometry of a fishing gear).
This paper presents a 3D visualization tool that offers run-time simulations of the trawl fishing gear considering fixed towing points and the codend drags as well as the force vectors. The tool provides an optimal operation time for drawing the fishing gear including the shape of codends, because it employs a parallel model of netting particles which uses OpenMP APIs [5, 6] to calculate each particle and net point. Our tool guarantees that the simulations are realistic visualization for the trawl fishing gear including the physical parameters of the gear itself as well as the force vectors. In our tool, we used the NETSIM [7] simulator to model the underwater geometry of the trawl fishing gear and added subroutines which offer the best approximation of the points of otter boards and the codend drags considering the prototypes of the codends and the status of fishing operation. In addition, the tool was improved to display the 3D shapes of codends and record the summary of variable parameters with simplified out data.
The NETSIM simulator assumes that the opening of a fishing gear by the flow resistance is suspended by a balance of dynamical power and derives the geometric coordinates of 3D model for the finite elements. For modeling the opening of the fishing gear, the front-end of pendant wire rope and a towing point should be provided as the initial inputs for the simulation. Moreover, the simulator needs to insert the initial flow resistance value of the fishing gear and the flow resistance of codend for opening the fishing gear with dragging back. Therefore, we also present estimations to deduce the distance among otter boards and the flow resistance of codend and apply it to our visualization tool.
2. Materials and Methods
2.1. Estimation of Fixed Point as Towing Point
There are several results from the measurement of field operation and the approximation based on the balance of dynamical power to properly estimate the distance of otter boards. To estimate the distances, this paper employs Friedman's study [8] and Dickson's study [9] and uses the following vectors:
D: towing depth; L: towing cable length; S: area of otter boards; V: towing speed; W: underwater weight of otter boards; ρ: ocean density.
Figure 1 depicts the vectors during trawling a fishing gear and how the vectors are related to each other. The descent force


The vectors of the fishing gear in a typical mid-water trawl.
The opening ratio

The length


2.2. Estimation of the Codend Drag
The NETSIM for the trawling shapes simulation by Ferro [7] needs to insert codend drags as the input data for the initial work force of opening a fishing gear. It is well known that the flow resistance of a codend is only about 10% of the overall flow resistance of a trawl gear, and the measured results of the codend drags which are constructed with Nylon show that the major force vectors for the resistances consist of towing speed, the perimeter of entrance, the width and the length of entrance, the direction of entrance, and the number of mesh points. In a previous work, Ferro and Stewart [11] presented an empirical expression which only considers a few kinds of Nylon codends for measuring its resistances and towing speed for a force vector, but they do not present any estimation associated to the construction elements of codends that are required to design a fishing gear. Therefore, this paper presents an estimated expression for the flow resistances of codend which applies totally 12 different results of measured resistances that refer to prior theories for the flow resistance of bag nets and the Ferro and Stewart's report.
The flow resistance R at the codend can be represented as

The exponent n for V considers only an average value (=1.71) which was obtained empirically from the towing speed of a fishing gear, because the towing speed does not consist of any correlation with the elements of codends. An average value of the acceleration a which considers both the tied and the closed state of codend can be applied to deduce the resistance R with trawling speed (V: knot). Then the flow resistance R at the codend can be expressed as follows:
2.3. OpenMP for Parallel Processing
Generally, several applications employ OpenMP [5] or MPI [12, 13] to archive improved performance with parallel processing. OpenMP is a de-facto standard of industry for shared memory model of parallel programs written in C/C++ and Fortran 77/99. Sequential programs can be transformed easily into parallel programs with rich set of compiler directives, run-time libraries, and environment variables for the OpenMP. The directives extend the sequential programs and provide sharing of important data for supporting the parallel execution model of SPMD (single program, multiple data).
Algorithm 1 shows an example of OpenMP program to provide parallel processing of drawing each particle on a net. With the parallel directive #pragma omp parallel for shared (g_part), in Algorithm 1, each particle is concurrently initialized and calculated with a shared structure g_part which includes top and bottom points, the activities, and applied angles. In this paper, we also consider the force vectors and changes of underwater geometry, which are recorded in a database system that the environment vectors can be obtained from multiple sonar sensors to provide real-time simulations as well as drawing the particles.
⋯ (1) void SetupRC (){ (2) int i; (3) glEnable (GL_DEPTH_TEST); (4) (5) for (i=0; i<MAX_PARTICLES; i++) { (6) g_part[i].top.x = 0.0f; (7) g_part[i].top.y = 0.0f; (8) g_part[i].top.z = 0.0f; (9) g_part[i].bottom.x = 0.0f; (10) g_part[i].bottom.y = 0.0f; (11) g_part[i].bottom.z = 0.0f; (12) g_part[i].active = false; (13) g_part[i].start_y = −100.0f; (14) g_part[i].angle = 0.0f; (15) } ⋯
2.4. The Geometry of Codend
Since the underwater shapes of codend come into different aspects according to the elements for constructing the codend and how many fishes are captured in the net, the previous work excludes the geometry of codend [7] or provides modeled experiments and numerical analysis for the geometry of mesh at codend [14]. This paper properly estimates and simulates the underwater shapes of a codend by referring to recorded data which was collected by the investigation of a movie of a real fishing gear.
The cross-section of a codend is an oval shape extending from the end of net bag. The cross-section shape was changed from an oval shape to a circular shape that properly increases the diameter of the circle as much as the number of captured fishes existing in from the center to the end of net bag. If given two distances, a horizontal diameter a, and a vertical diameter b, the opening direction point X related to the trawling direction vertically is correlated with a depth point Y as follows:


The geometry of a typical codend.
2.5. Modeling for Detecting a School of Fish
In this paper, we estimated the heliogram signals for a school of fish and the height and the width of the fishing gear for our modeling of fish detection with an assumption that these signals are obtained from a multiple sonar sensors.
If a frequency f (KHz) and a sonic speed
Given the sonic output p of a transmitter, each of the source level SL (in dB re 1 μpa at 1 m) and SL1 that is a SL for 1 volt input can be expressed by the following equations:

Given the conversion efficiency η of a transmitter, the sonic receiving sensitivity
The reflection intensity


The strength

After detection, we added the heliogram which uses only the positive voltages with the reflected signal from each target fish at the same time and obtained the final signal strength
3. The 3D Visualization of Underwater Geometry for Trawling Gears
3.1. Design of the 3D Visualization Tool
The NETSIM simulator for modeling the geometry of the trawl fishing gear assumes that the opening of a fishing gear with the flow resistance is suspended by a balance of dynamical power, and it derives the geometric coordinates of 3D model for the finite elements. For modeling the opening of the fishing gear, the front-end of pendant wire rope and a towing point should be provided as initial inputs for the simulation. Moreover, the simulator needs to insert initial flow resistance value of the fishing gear and the codend drags as the input data for initialization of opening the fishing gear. Therefore, we extend the NETSIM simulator with additional computation routines to provide the distances among the otter boards and the flow resistance of the codend based on the deduction estimations in Section 2. Additionally, we also efficiently improve the simulator using parallel processing with OpenMP APIs.
Figure 3 shows the overall architecture of our 3D visualization tool considering the extension of the NETSIM simulator and its parallel processing. The 3D visualization tool uses the regularization schemes of the fishing gear, such as the types, sizes, and materials, as the inputs for the simulator, and it runs parallel computation to generate the 3D coordinates for visualizing the underwater geometry of the fishing gear over improved NETSIM. For extending NETSIM simulator, we add three routines to offer the best approximation of the points of otter board and codend drags considering the prototypes of the codends and the status of fishing operation. Finally, our 3D visualization tool offers real-time simulations of the trawl fishing gear, including multiview display and animation.
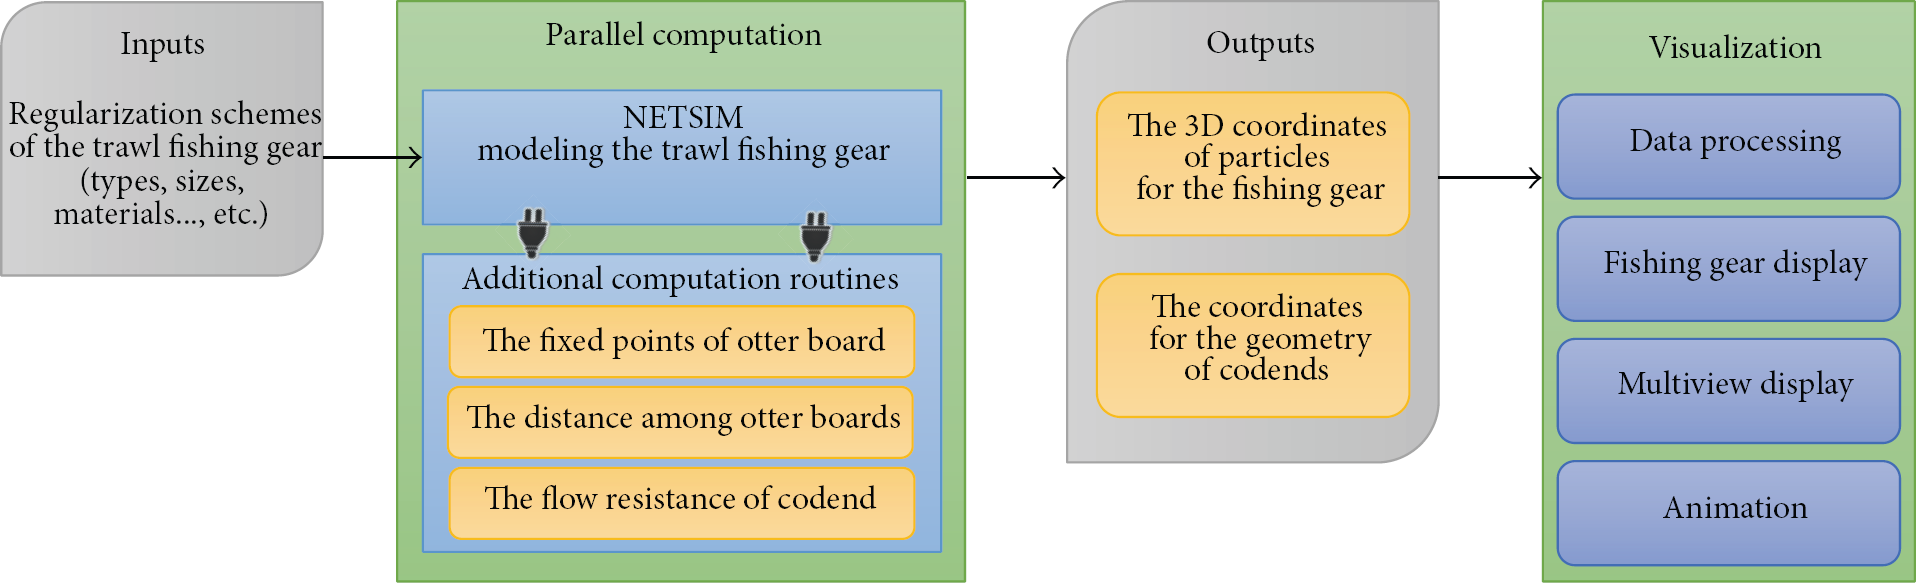
Overall architecture of the 3D visualization tool.
3.2. Input Data for Designing the Trawl Fishing Gear
We consider the number of net knots, the mesh diameters, the forming rates of a net, the edge connection information for a net board, the buoyancy and the sedimentation rate, and the constructions of a codend as input data for simulating the underwater geometry of a trawl fishing gear. To construct an input file, we use a GUI dialog which provides the initial data for each selected fishing gear and can resave the input data with modification, insertion, and deletion. Figure 4 shows the GUI dialog and an input file for our simulation of the trawl fishing gear.

Input data dialog and input data file for simulation of underwater geometry.
3.3. 3D Visualization for Underwater Geometry of the Fishing Gear
The prior work [15] which presents a 3D geometry of the fishing gear supports implementation for a shape of the fishing gear without considering the underwater environment surrounding the net. The third dimension coordinates are needed to represent the geometry of the fishing gear considering the underwater environment and to animate the dynamic actions of the underwater variation. This paper applies 3D location information for each node of the trawl fishing gear to the simulation results of the gear shape and provides an additional user interface to directly control the fishing gear in our simulation. Figure 5 shows important information about 3D coordinates, such as the nodes of the fishing gear, in our simulation.
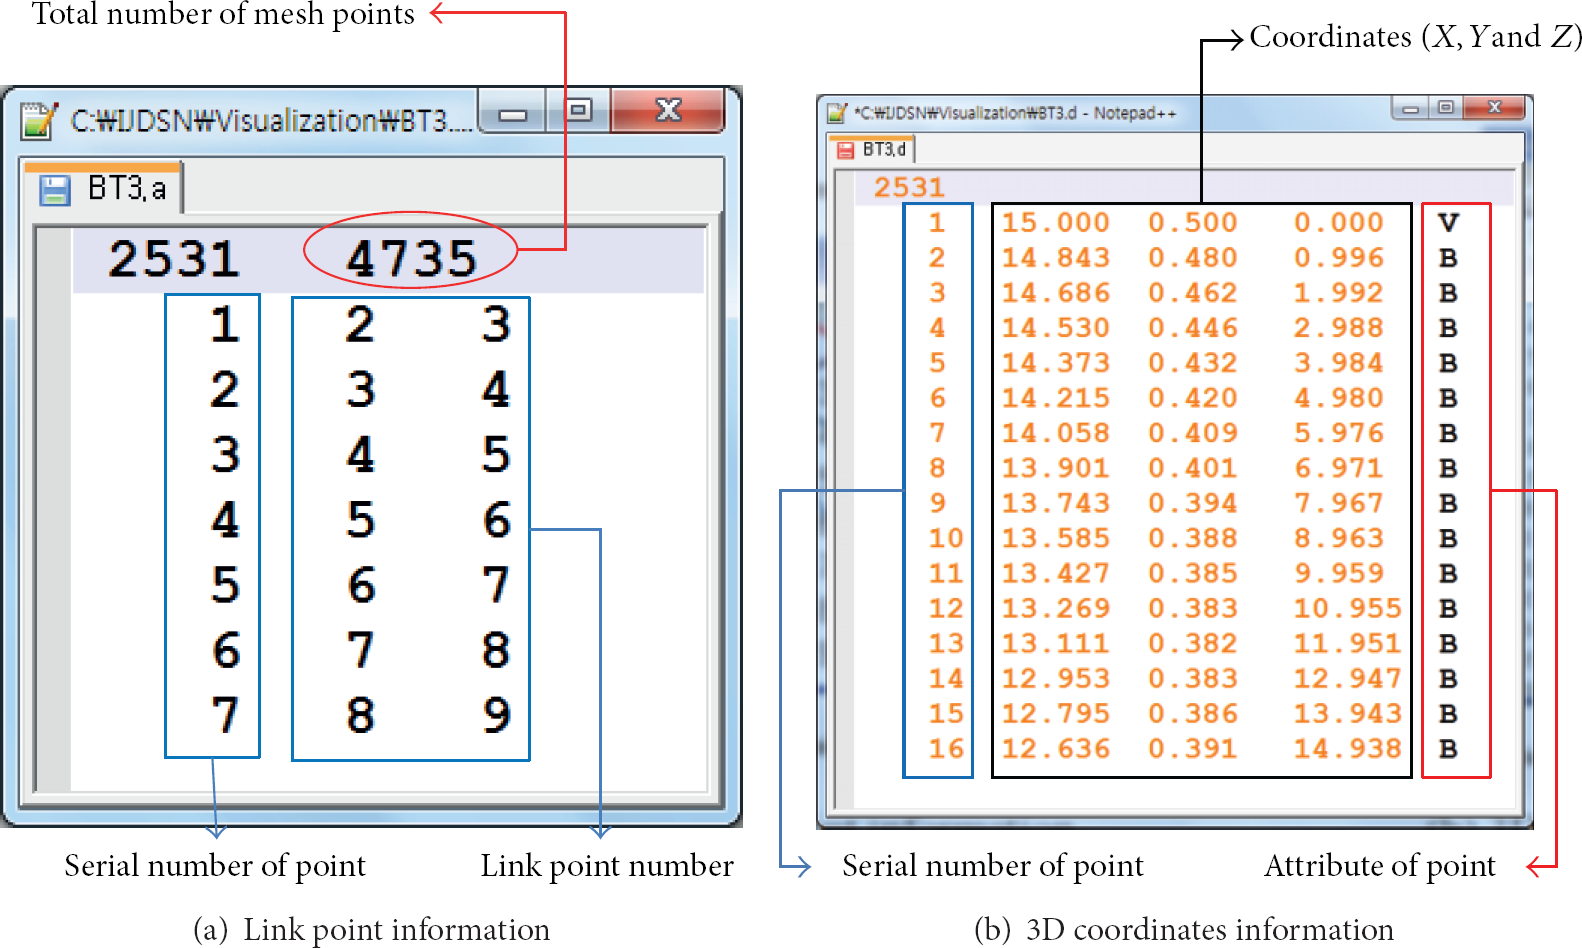
The 3D coordinates information for the simulation of fishing gear.
Our simulator was implemented with OpenGL libraries to draw the geometry of the fishing gear and with C/C++ routines which use OpenMP directives to calculate the characteristic functions, including particles, moving net, changing locations and size, and rotating view-point. To draw a fishing gear, our simulator connects each of the link points by using the information of the 3D node coordinates which has been recorded in two array variables. One variable is a structured area to provide the connection information of each link point (see Figure 5(a)) and the other is also a structured area to record the coordinates for the three axes (see Figure 5(b)).
4. Evaluation and Analysis
To evaluate the 3D visualization tool, we focus on the accuracy of simulation and the efficiency of parallel processing, because the model of the fishing gear, such as underwater geometries and the flow of codend, is based on the accuracy of the original NETSIM simulator. Therefore, we evaluated the usefulness of parallel processing for our 3D visualization with four simulation models of the trawl fishing gear, which are presented in Table 1, and measured simulation time to compare the parallel version with sequential version over each model. We implemented our 3D visualization tool on a system with Intel Pentium 2.53 GHz CPU and 4 GB main memory under the Windows XP operating system. For parallel processing with OpenMP APIs, it is important to debug the concurrency bugs, such as data races and deadlocks, because they may lead to unintended results by the nondeterministic interleaving of parallel execution threads. We fixed concurrency bugs using a detection framework [16] for extended NETSIM simulator.
Four net models for simulation.

Figure 6 shows the geometries of the fishing gear illustrated with the shapes of mesh using the connections of the nodes. Our visualization tool provides a set of control panels to select the kind of fishing gear, zoom-in and zoom-out on the selected fishing gear, or the rotation angle and the distance of the display (see the left-side panel in Figure 6). For independent rotation, it provides each direction with the possibility to rotate until ±90° vertically or horizontally. The simulator also provides the maximal zoom-in rate by 300% and the minimal zoom-out rate by 50%. The set view control panel is to display selected fishing gear that can be illustrated with only 3D node coordinates before connecting them.

(a) Simulation of two-boat trawl (BS2 model). (b) Simulation of mid-water trawl (NOR8 model). (c) Simulation of anchovy boat seine (AS1 model). (d) Simulation of bottom trawl (BT3 model).
Figure 7 depicts a multiview display which offers the geometry of the fishing gears simultaneously to compare different underwater shapes of each gear based on different types and trawling methods. The multiview display provides maximally three kinds of gear geometry at a screen, and distinguishes each fishing gear with different color. Since this multiview display indicates the digitalized information of important elements for simulation, such as the net height, the net width, and resistances, the comparison is more practical.

Simulation of three trawl fishing gears at the same time.
The compared results appear in Table 2. We use four kinds of particle density, 10, 25, 50, and 100, for the towed fishing gear which has long body, because the time complexity of simulation is proportional to both the net point and the point particle's density that mainly increases the computational complexity. We consider both the net point and the point particle's density as the target elements for parallel processing. Moreover, the speed of fishing boat and the tension of towing fishing gear are factors to reduce the computational complexity. Thus, we use the same values of measuring models for our analysis by simulation. During the simulation of the geometry of the fishing gear, measuring the execution time is mostly affected by the particle's density. Table 2 shows the empirical results that compare the sequential process model of simulation with the parallel model to verify the effectiveness of parallel processing for our simulation. As on results, the parallel model increases the processing performance by over 40% in average. Moreover, the simulations using parallel processing supported the real-time display for corresponding user's input data. Finally, Table 2 shows that parallel processing provides the efficiency and the reduced time overhead for 3D visualization of the trawl fishing gear. Our visualization tool satisfies both the physical realism and visual realism due to the fact that the 3D underwater geometry of towed fishing gear provides the actualities with several force vectors.
Analysis of performance comparison (time).

5. Related Work
Ferro [7] developed a dynamical approach to simulate trawl geometry by the finite element analysis method, called NETSIM. The prior work designed to estimate the relative positions, the shape and the loading of the trawl fishing gear, and NETSIM was used to predict visual geometry of the four-panel bottom trawl fishing gear. The trawl geometry simulation can be carried out with various towing speeds and otter board spread. The positions of the net nodes are represented using a three-coordinate system. However, the model of NETSIM cannot yet deal with asymmetry of the trawl gear for example, when in strong lateral current or during turning of the towing direction.
Park et al. [2] presented a practical visualization tool to predict fish behavior of underwater in the towed fisheries based on chaos theory. The study precisely analyzes nonlinear phenomena of response patterns in complex fish behavior, and it provides the simulation of the underwater fish detection and distribution in fishing ground. The simulation results of the visualization tool are very similar to the information of the fish movement in the field observation. However, the tool does not provide the shaping model of fisheries with variant force vectors.
6. Conclusion
This paper presented a 3D visualization tool that uses parallel processing for the particles applying several force vectors which can be obtained by multisonar data and satisfies both the realism and the efficiency of real-time simulation for the variant geometries of the trawl fishing gear. We implemented the parallel model of netting particles using OpenMP APIs to calculate each particle and net point and additional subprograms which offer the best approximation of the points of otter boards and the codend drags with consideration of the prototypes of the codends and the status of the fishing operation. The empirical results using four net models showed that our tool provides the efficiency and the reduced time overhead for the 3D visualization of the trawl fishing gear and satisfies both the physical and visual realism. This work can be applied to particular simulation systems for analyzing the precise model of graphical geometries as well as modeling the underwater shapes of fishing gears. The future work includes additional improvement of the 3D visualization tool for supporting more variants of fishing gears.
Footnotes
Conflict of Interests
The authors declare that there is no conflict of interests regarding the publication of this paper.
Acknowledgment
This research was supported by the Basic Science Research Program through the National Research Foundation of Korea (NRF) funded by the Ministry of Education (NRF-2013R1A1A2011389).