
Abstract
IEEE 802.15.4 PHY has been widely used in wireless sensor networks. In-depth investigations on the link layer characteristics are important for WSN protocol design. In industrial environments, link reliability is vulnerable to various interferences; therefore, many schemes have been employed for reliability improvements such as multichannel access, frequency hopping, and multipath routing, which put forward the demand on link reliability models. Previous researches mainly focus on distance fading and irregularity of link reliability; however, little work analyses the temporal and frequency variations of the link reliability. The paper proposed a link layer statistical model (LTM) for time-varying of 16 channels based on packet drop rate (PDR) data collected from typical industrial environments. LTM descript packet drop intervals, PDR variation over times, PDR variation between different channels, link level switching probability and interference distribution. And also, a discussion of the influence of IEEE 802.15.4e MAC protocol simulation showed that LTM is closer to the realistic result. This paper provides a new method to model link reliability in industrial environment and is useful to the design of frequency diversity and upper layer protocols.
1. Introduction
Industrial wireless sensor networks have developed rapidly during recent years [1–4]. The designers are facing new challenges in those applications of industrial wireless sensor networks. On one hand, the radio environment in the factories is very harsh, because of the complicated factory layout and plentiful stationary/moving obstacles which result in strong multipath channel and time-varying interference; on the other hand, the requirement for reliability of data communication is much higher in industrial applications than that in the civilian applications, because the wireless sensor networks in the industry fields are usually mission-critical. So the standards such as ISA SP100 [5], WirelessHART [5], WIA-PA [6], Zigbee-Pro [7], and IEE802.15.4e [8] mainly focus on the reliable and secure industry solutions.
In order to increase the reliability of data communication in wireless sensor networks, there are briefly three categories of techniques and policies [9]. The first is time diversity, for example, TDMA and retransmitting. This scheme can be used to handle fast fading and very short burst interference. The second is path diversity, for example, mesh network topology and mesh protocol which can cope with geographic-varying channel condition. The last is frequency diversity, for example, multichannel MAC and frequency hopping. This approach is suitable for dealing with time-varying and frequency-varying channel conditions.
All of these methods are highly dependent on characteristics such as the channel condition, the modulation/demodulation scheme, and the implementation of transceivers, which make the impact on the link reliability together. Therefore, to evaluate various schemes of link layer, it is necessary to establish a link reliability model, which takes the wireless channel, the lower layer design, and implementation into consideration. In addition, as credibility of high level protocols simulation results depend on physical layer assumptions [10, 11], unrealistic link models can lead to mistaken results [12]; a typical example is the results of considering link asymmetry or not [13]. So a realistic link reliability model is the base of the protocol design and simulation.
Link reliability is extremely related to the time-varying and frequency-varying, which cannot be ignored in the protocol design, especially in industrial environment [14, 15]. This paper is going to study time-varying characteristics of the link layer and research the relationship of the link reliability with time and frequency using statistic method for evaluating the reliability aware protocols and algorithms. We take experiments in different factories to reveal the link characteristics of IEEE802.15.4 radio transceiver on all 16 channels firstly and then analyse the measurement data to reveal the quantitative relationship among link reliability, time, and frequency.
The paper contributes in (1) proposing an experimental procedure to measure multichannel link quality and qualitatively analyze the link reliability in industrial environment, (2) proposing a method to quantitatively analyze the temporal and frequency variations of link reliability using statistical method and figure out that link reliability variation over time and frequency is not random but follows statistical regulations, and (3) discussing the influence on MAC protocol simulation when considering the time-varying link characteristics. Although the analysis is based on two different factories and lacks measurements in many other factories, the experimental results in the two typical factories are useful for the protocol design employed in similar environments, and the method of statistical analysis is also useful for link reliability research in other industrial environments.
The remaining part of this paper is organized as follows. Section 2 is related to works. In Section 3, we describe the experimental design, including measurement apparatus, testing field and settings, and experimental procedure. In Section 4, measurement data is shown and a qualitative analysis is made to reveal the link characteristics in testing factory. We show the statistical inference of link characteristics and their statistical features; we also present the link layer statistical model and its algorithm; we discuss the protocol simulation using LTM in the last of Section 5. Section 6 concludes the work.
2. Related Work
Wireless network reliability related models include channel model, radio model, and link layer model [16]. There is lot of work on channel model and radio model for the wireless networks [17–19]. The emphasis has been on the channel distance fading, multipath fading effects, and others like shadow, scattering, and so forth, in factory environments. In protocol simulation, researchers often use UDG model, distance model to simulate high layer protocol such as MAC and routing. UDG model can only be used in high level network design, which will make a big error when deploying the network in real industrial environment. Distance model is related to PHY devices; traditional wireless distance model is often based on WIFI, which cannot be directly used in lossy and low power IEEE 802.15.4 network. There are also many experiments studies on link layer characteristics in wireless sensor networks [14–16, 20–26]; most of the experiments use device at 800–900 MHz and 2.4 GHz. We can divide the current link model of wireless sensor networks into tree kinds.
(1) Study on Relationship Spatial Characteristics. Molina-Garcia-Pardo et al. [10] performed several measurement campaigns in three different scenarios and proposed a low cost two-slope lognormal path-loss near ground outdoor channel model at 868 MHz. Cerpa et al. [20] developed a set of nonparametric statistical models for characterizing links in wireless sensor networks, which extracted relationships of the packet loss rate and the distance. The paper also revealed that the distribution of lossy links can greatly affect routing algorithms based on geometric concepts. Zamalloa and Krishnamachari [27] provided link layer models, namely, the packet reception rate as a function of distance. Researches on spatial characteristics [28, 29] showed that link quality is not correlated with distance, especially in transitional region, and also link quality is anisotropic. The transitional region is always determined by environment and radio hardware.
(2) Study on Link Asymmetry. The authors of papers [11, 30–32] showed that link has high irregularity in wireless sensor networks and the reason is complex. Liu et al. [15] indicated that frequency mismatch is one of the reasons and proposed two new energy efficient reliable transport protocols to overcome the asymmetry. Zhou et al. [33] proposed a RIM model to estimate the link irregularity; and based on the model, the author investigated the impact of radio irregularity on MAC, routing, and topology control; it indicated that irregularity has larger impact on the routing layer and topology control compared with the MAC layer. Reijers et al. [22] found that links within grey area are symmetric; that is, links with good reliability or bad reliability are symmetric and links with a middle reliability are asymmetric.
(3) Research on Link Temporal and Frequency Variations. Previous researches, such as Zigbee [34], IEEE802.15.4 [35], presume that radio connectivity is reasonably consistent over time. Tang et al. [21] studied the IEEE802.15.4 radio for factory environments in both spatial and temporal characteristics. The author found that the single strength depended on surrounding structures and link is stable outside of the grey zone. Lai et al. [25] explored an energy-efficient measure method using SNR as the cost metric to estimate the instantaneous link conditions in the 900 MHz band. The author found that few channel measurements are sufficient to obtain a good estimate of the link which is useful for forming topology. Sexton et al. [23] used a real-world factory experiment to understand the root cause of the link failure and study the temporal and frequency variations in link quality. The author also discussed the implications for reliability and protocol design that can adaptively detect and use workable radio channels. Researches on temporal characteristics [28, 36, 37] showed that links with low or high PDR are stable and temporal variation of link quality is related with the environment. Also PDR correlation exists in temporal varying.
Although above researches reveal the link characteristics of the time-varying and frequency-varying, they have not given the quantity relationship among link reliability, time, and frequency. Doherty et al. [26] tested 44-nodes 2.4 GHz wireless sensor network deployed in an industrial environment, revealing the scale of time-variation of stability and the frequency dependence; the authors also proposed a simple time-varying model for simulation and point out that channel hopping and path diversity are helpful for maintaining network reliability.
Some researches [20, 25] assume link reliability with little variation over time; some [26] assume that link reliability is completely random. In our work, we measured link reliability in two typical factories and focused on the temporal and frequency variations of link reliability. Moreover, we analyzed the quantity statistical characteristics of the variations of the link reliability over time and frequency and introduced these features into simulations.
3. Experimental Design
3.1. Measurement Apparatus
Micaz motes [38] are employed in the measurement. A typical measurement employs two Micaz motes, as shown in Figure 1(a); one is sender and another is receiver. In a given time window, the sender transmits data packets to receiver and then waits for ACK packets from the receiver periodically. If the ACK is not received, then record the packet loss into external flash. When finishing the communication in the given time window, the sender reports the measurement result to the laptop via interface board MIB520.

Experiment system and software state machine.
TinyOS1.x is used as the software platform, where the CC2420 CSMA/CA driver is modified for the measurement. The sender sends data packets without CSMA/CA mechanism, that is, the sensing CCA and backing off. In addition, the hardware generated auto-ACK provided by the CC2420 is not used, ACK packet is generated on the link layer and sent in the same process as that sender sends data packet in. FEC is forbidden and CRC is required. Therefore, for both data packet and ACK packet, wrong CRC indicates that the packet should be dropped.
The state machines of sender and receiver are shown in Figures 1(b) and 1(c), respectively. The receiver synchronizes with sender with the 32 bit timestamp in the data packet. The sender and receiver are driven by timer, denoted by T. In the experiment, the timer T is set as different values. A timer interruption leads a transaction, including a data packet transmission-receive, an ACK packet transmission-receive, and a packet drop record process. The measurement is divided into rounds of transactions. A round of transactions consist of 16 transactions on the 16 channels, respectively. At each transaction, the sender will refresh timestamp and packet sequence number and record ACK of the transmitted packet whether received or not. Besides packet drop records, RSSI and LQI are recorded as well.
In the experiments, 3 nodes were used, that is, nodes A, B, and C as shown in Figure 2(b), where node A is the sender and node B and node C are the receiver. In a round, node A communicates with node B on the 16 channels sequentially and then communicates with C on the 16 channels sequentially. Node A will record whether received the ACK in each channel. The experiment parameters are shown in Table 1.
Experiment parameters.


School experimental factory of USTB.
3.2. Description of Factory Environment
The link reliability measurements were conducted in two typical factory environments; one is the school experimental factory in University of Science and Technology Beijing and the other is the cold rolling factory of Anshan Iron and Steel Corporation.
The factory in school is used for experimental production of thick plate and castings. There are about 1000 square meters on a single floor. The wall is made of reinforced concrete, and one side has large windows and two steel doors. The roof of the factory is broad except for a mobile overhead crane. The site has one production line with typical equipment, shown in Figure 2(a).
Another complex environment is the cold rolling factory of Anshan Iron and Steel Company. The factory is built for the production of high quality strip steels and equipped with state-of-the-art manufacturing equipment, which is placed in multifloor structure, shown in Figure 3(a). The walls are as high as 50 meters. One side is made of thick steel plate; another side is made of reinforced concrete. The test nodes are attached to the bearing pedestal, shown in Figure 3(c). Our testing field is about

Cold rolling factory.
In the environment mentioned above, we test link reliability in different sites. The nodes are placed on the locations where the real sensor nodes will be fixed. One assumption is that we will not put the nodes on the place where the communication of the two nodes is in the grey area. Thus, according to paper [17], we test in the following situations.
(1) Line of sight links: such links are almost in open areas and have higher position than the surrounding obstacles, as shown in Figure 3(b).
(2) Out of sight links with little obstacles: in this situation, nodes are close to the obstacles and out of sight, but the other side of the obstacles is open, as shown in Figure 3(c).
(3) Out of sight links with heavy obstacles: such links are as the same as the previous one, but with more surrounding obstacles around, as shown in Figure 3(e). In particular in Figure 3(f), link is completely separated by the big stove.
(4) Links on the big blower: environment of the blower is more complex because of its large variation of temperature, humidity, and airflow, as shown in Figure 3(e).
(5) Links on the human activity place: such links are close to the work area and more likely influenced by the moving of workers.
All of the above links are measured in the experiments to achieve the IEEE802.15.4 link characteristics in the industrial environment and each link transmits about 10000 packets on each channel.
4. Experimental Results
The experiment results are denoted as packet drop sequence (PDS) traces. For the protocol design and evaluation, we often use packet drop rate (PDR) or packet receive rate (PRR) to define the link reliability.
In order to improve reliability, the data packet transition needs acknowledgement; that is, the data packet communication contains two actions: data packet transmission from the sending node and ACK from the receiving node. There are two possibilities that ACK is not received, either data is lost or ACK is lost. For the sender, if the ACK is lost, this communication fails, record 1; otherwise record 0.
4.1. Measurement Results
The measurement results are serials 0 or 1 traces. For a given window, packet drop sequence, denoted by
Assume T is the observation window, and then the packet drop rate can be defined as follows:

where NumPacket is the total number of data packet transmitted by the sending node and NumACK indicates the total number of ACK successfully received by the sending node, both of which are during the period T.
Figure 4 shows two typical measurement results in two different places. The y-axis represents the packet drop rate on 16 channels, and x-axis represents time. Figure 4(a) is a 9-hour short time test and packet transmitting interval T is set to 200 ms. Figure 4(b) is a 20-day measurement and packet transmitting interval T is set to 2 s; the test is started at 5 pm of the first day. Figure 4(c) is the measurement data of channel 12 and channel 13 (denoted by ch2 and ch3) in Figure 4(b) of the 10th day.

PDRs measurements in industrial environments.
4.2. Qualitative Analysis
For each measurement result, we consider two parameters: average PDR, denoted by E, and variation of PDR at a given channel, denoted by D. Low average packet loss rate means more reliable and low variation of packet loss rate means more stable in the channel. E and D are calculated as follows:
Taking Figure 4(a) as an example, we calculate E and D on the whole test time, the first 3 hours and the second 3 hours of the test time; the results are shown in Table 2.
E and D of measurement data in Figure 4(a).

It shows that the channels with low average packet loss rate E (ch1, ch2, ch6, ch7, ch8, ch9, ch10, and ch15) and high E (ch12) have relative low variation D on the whole test time (9 hours). But there are different changes of packet loss rate on one channel between the first 3 hours and the second 3 hours; channels which have high variation D in the whole test time, for example, ch4, ch5, and ch16, may have low variation on a relative short (3 hours) time; that is, for a long time, for example, 9 hours, channel demonstrates high variations but if we decrease the analysis window, there are more stable parts of the channel over the time.
Figure 5 is the comparison of packet loss rate, average packet loss rate, and variation on channel ch4 in Figure 4(a). We use sliding window to calculate average packet loss rate E and related variation D; window size is 20 (i.e., 128 seconds). It is shown that the lower the average packet drop rate E, the lower the variation D, and the more stable the channel. The result of channel ch12 shows that the higher the average packet drop rate E, the lower the variation D. Other channels have similar results.
PDR, E, and D relationship at sliding window size of 20.
4.3. Conclusion
From the measurement data and qualitative analysis we can draw conclusions as follows.
(1) For a pair of communication nodes with fixed placement, the packet drop rates on different channels are possibly and dramatically different with each other. For example, in Figure 4(a), the PDR is below 5% on channel ch1, while the PDR is above 90% on channel ch12. So that frequency diversity is necessary for industrial wireless sensor networks.
(2) Throughout the measurement, the PDRs are relatively stable on the channels in either excellent or extremely bad channel reliability. However, on the channels in medium reliability, the variation of PDR is obvious and considerable. This means not all channels are changed randomly.
(3) On the curves of stable channels, there are some abrupt changes of the PDRs. For example, in Figure 4(c), PDR changes from below 5% to above 90% and then from above 90% to about 50% on channel ch3. That is to say, no channel will keep a high or low reliability forever and link reliability variations must be monitored for the high reliable design.
(4) Coordination exists among channels. Channel variations are not separated from each other, for example, ch4 and ch5 in Figure 4(a) and ch2 and ch3 in Figure 4(c).
(5) Link reliability is time sensitivity. According to Figure 4(c), link is stable at night but volatile in the daytime because of the human activities.
(6) Link reliability looks random in a large time window but stable in a small window. As shown in Figure 4(b), the 20-day PDR variations on channels ch2 and ch3 have large variations, but the local area of the whole time (in days) is stable on a relative short time (in hours), as shown in Figure 4(c).
5. Statistical Analysis
Conclusions in Section 4 show that there are regulations on link reliability variation over time and frequency; in this section, the corresponding statistical variables and statistical approach will be introduced firstly and then the statistical inference based on the experiment results and its physical implications will be put forward.
Dfittool of the Matlab is used in statistical inference and parameter estimation. Each possible distribution has been used and the one which has minimum parameter estimation error is taken as the statistical inference results.
5.1. PDS Distribution
We use a Bernoulli random variable X to represent whether the transmission succeeded or not. If the transmission succeeded, X takes the value of 0; otherwise X takes the value of 1. Let
Define Y as the packet drop interval, that is, the length of interval separating the nth transmission which failed from the previous one. Thus, we can describe X through the distribution of Y. Define Z as the ratio of the total number of value 1 and N, namely, packet drop rate (PDR).
Through the experiments, it is found that, at different time region
In this paper, we divided PDR into 25 ranges, that is,
(1) Scan the samples of X, calculate packet loss rate Z at (2) Add PDS trace into (3) Let the length of interval separating the nth failed transmission from the previous one as a statistic samples, use the dfittool in Matlab to make statistical inference and parameter estimation.
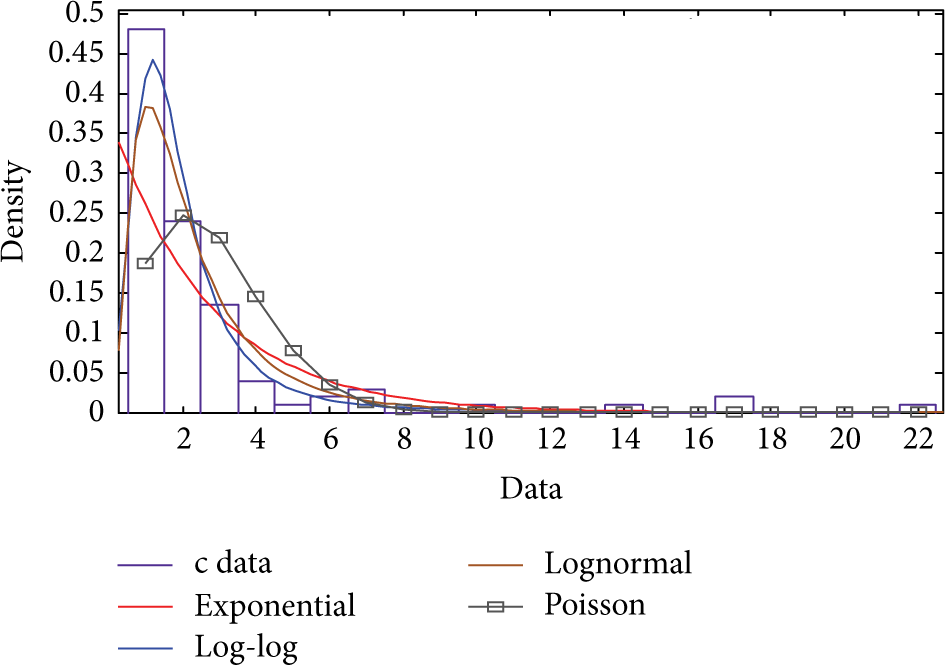
According to the method in Algorithm 1, statistical inference results showed that a quantized lognormal distribution does in fact provide a reasonably good fit in 25 different regions

where parameters μ and σ corresponding to different PDR regions are shown in Figure 6 and the p.d.f. of 7 regions is shown in Figure 7.

Distribution parameters of

p.d.f. of 7 regions
Figure 7 shows the p.d.f. of 7 regions; it is found that packet drop interval of PDS is relatively long when PDR is small, for example, region 1; with the increase of PDR, the packet drop intervals become shorter and shorter and have high probability on 1 to 10; that is to say, the higher the PDR is, the higher the probability of consecutive packet drop will be.
5.2. The Variations of PDR
From the analysis above, it is found that PDR and corresponding PDS have a fixed relationship. However, the variation of PDR over temporal and frequency is unknown, which is important for revealing characteristics of the link reliability. We use four processes to describe the variations of PDR: the variation of PDRs at a specific level
5.2.1. Channel Reliability Level (CL)
Given the features of communication channels in terms of PDR above, we classify link reliability into m levels, denoted by

where
In this paper, we divided the channel conditions into five levels according to PDR,
5.2.2. PDR Distribution on Level
Define
(1) Sort the samples of Z by the range ( (2) Use dfittool in Matlab to make statistical inference and parameter estimation on the distribution of
Figure 8 shows the statistical inference results of the PDR distribution under each reliability level

where

Fitting results of PDR on 5 reliability levels.
For the other four reliability levels
The estimated parameters and their standard errors of log-logistic distribution on each reliability level are shown in Table 3.
The parameters and errors of PDR distribution.

From the data of Figure 8 and Table 3, we can find that, on level
5.2.3. Transition Probability Q among Reliability Levels
PDR follows statistical distribution on a fixed reliability level. However, the features of the transition among the five reliability levels are unknown. Suppose that the transition among the reliability levels is a Markov process; that is, the transition of link reliability from one level to another level is only related to transition probability rather than previous level status.
Define
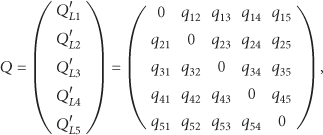
where
(1) Set initial value of array A[m][m] to zero. Analyzing the samples of Z, if a transfer of link reliability on channel k from (2) Calculate the transition probability
Transition probability matrix Q in USTB experimental factory measurements according to Algorithm 3 is as follows:

Comparing with the definition of Q, there is a relatively high probability of the transition from
5.2.4. PDR Variations over Time
The analysis above shows that link reliability is determined by the CL, that is, link reliability level, on a stable environment, and the transition among the reliability levels has no relationship with previous level but is determined by the probability matrix Q. However, the features of link reliability vary over time; that is, when the reliability transition will happen, should make a further research. In this section, we firstly analyze the reasons that may influence the link reliability and then give the statistic method and draw conclusions on temporal variation of link reliability from the analysis.
Many factors can influence the link reliability [15], such as multipath, activities of individuals, RF feature of transmitting and receiving, node direction, interaction disturbing among nodes, background noise, environmental humidity, and temperature and other devices on the same frequency. Sensor nodes in the industry environment are almost at fixed place or move in a very small range, the path-loss from node's mobility could be ignored. And the interference from other wireless networks like WLAN is not taken into consideration, because the coexistence of different wireless is beyond this study. In addition, interference of adjacent channels is not considered although it will have a serious effect on link reliability [39–41], because interference adjacent channels are related to channel allocation algorithm and topology of the network, which is out of the control of link layer reliability experiments. The interference of signal in the factory mainly comes from two kinds of sources: one is the multipath from the factory layout like equipment and materials on the production line, wall, and ceiling and so forth and the other is the occasional events like a mobile asset coming in, human moving in, and a spark of engine, which result in the time-varying environment.
We describe the environmental changes using “event.” Define E as the event which influences at least one of the channels and transfers the channel reliability from one level to another level. Link reliability level transition is caused by the event which happened in the wireless environment, so that the temporal variations of link reliability can be described by the happening of events over time; that is, we can analyze the feature of the temporal vibrations through the statistical analysis of events.
Both of the arriving and leaving of the event can lead to variation of reliability. We take the leaving of a previous event as the arriving of a new event and define random variable I as the time interval between two sequential arriving events. Define
(1) initialize (2) Analyze the PDR values in 16 channels sequentially, add the arriving time of event in each channel to (3) Use dfittool in Matlab to analysis the time interval of two sequent arriving events, inference distribution and estimate parameters.
According to Algorithm 4, we analyze the 20-day data from USTB experimental factory measurement, where PDR calculation window size is set to 50. As shown in Figure 9, the time interval of two events in experimental factory follows log-logistic distribution at the confidence level of 0.95, with two parameters
Fitting results of 20-day events arriving intervals.
The same analysis result on the data of Anshan factory shows that the interval of two sequent events also follows the log-logistic distribution, but with different parameters of u and λ. In other worlds, a log-logistic distribution provides a reasonably good fit in event arriving intervals. For some special environments, even if the interval of two sequent events does not follow the log-logistic distribution, we can also get the interval characteristics through Algorithm 4 and establish a distribution accordingly.
The events happening over time are equal to the link reliability time-vary. But as shown in Figure 4, it is obvious that, at the same time, the influence on the link reliability caused by an event is different on different channels. For a given channel i, the occurrence of an event does not mean that the link reliability of this channel will change. Therefore, we need to analyze the frequency-varying on channels when event happens and combine the event models together to determine the temporal variation of link reliability on each channel.
5.2.5. PDR Frequency Variation
Frequency variation describes whether the link reliability on the ith channel will be influenced when an event happens. Define S as a set of all the channels,
Denote by
(1) Scan set (2) Calculate the length of continuous channels and the total number of affected channels at (3) Use dfittool in Matlab to analyse CHC and CHL, and inference distribution of total channel numbers and continuous channel length.
Figure 10 shows the distribution fitting results of the total number of affected channels and the length of continuous channels derived from experimental data in the school factory.
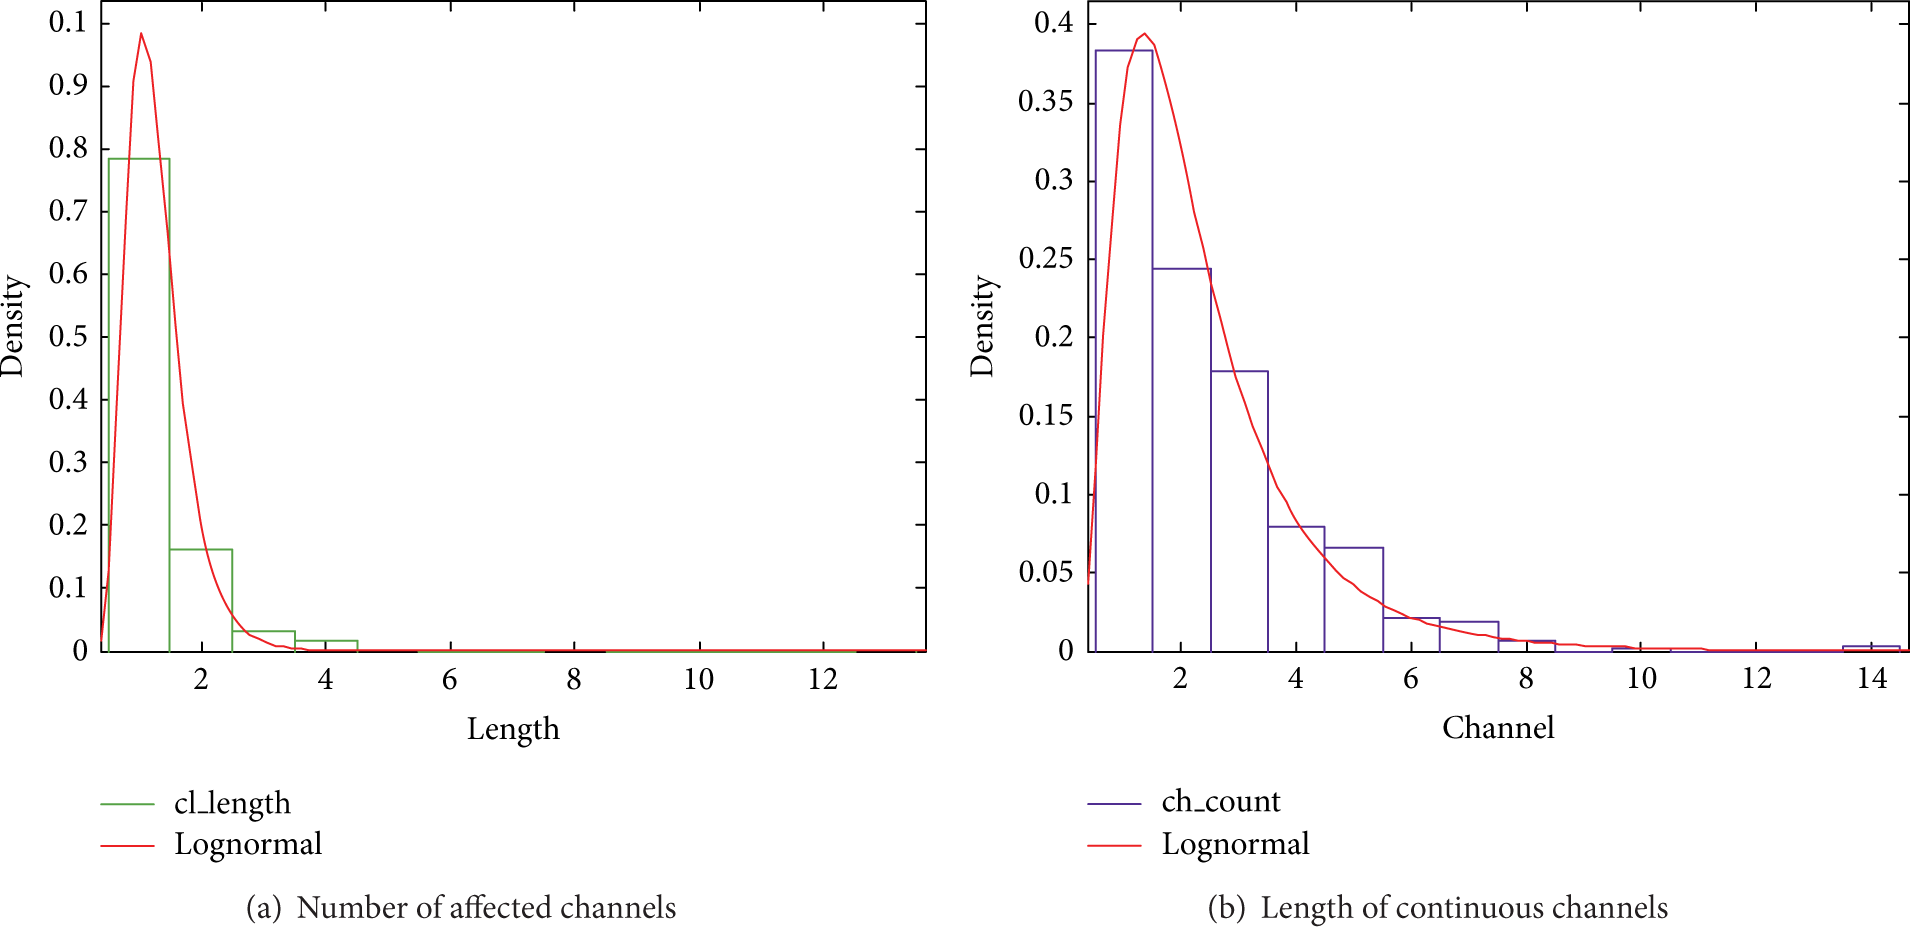
Statistical inference of the channel numbers
According to the statistical results of
(1) When event E happens, generate the number of affected channels according to the distribution of EC, denote as C, let (2) Generate continuous channel length L according to the distribution of ER. (3) If (4) If (5) CH is the final channels that are affected by E, i.e. P.
5.3. Link Layer Statistic Model
Based on the statistical analysis of packet drop interval Y, PDR distribution under given reliability level

Link layer statistic model architecture.
According to the regression analysis results of each part of LTM shown in Figure 11, a LTM generator algorithm is shown in Algorithm 7, where the
INITIAL: for all channel W ← OUTPUT: PDS[ch[i]][j] WHILE WHILE ( IF CH = for all channels, if ch[i] ∈ CH END IF ELSE For all channels, PDR[i] = Fail[i] ← Window = END ELSE WHILE T < Window T++, for all channels, PDS[ch[i]][Fail[i]] ← 1, Others <- 0 END WHILE END WHILE END WHILE
5.4. Evaluation
5.4.1. Time-Vary Evaluation
A LTM generator result example is shown in Figure 12. We use LTM and NS2 channel model to simulate IEEE 802.15.4 MAC. The simulation uses the example code of the 802.15.4 [42]; we just use one coordinator and one device and use CBR traffic model, device receive beacon, and transmit data to coordinator if there are packets in FIFO. The NS2 simulation parameters are shown in Table 4.
The parameters of NS2 simulation.


16-channel example of LTM generator.
Figure 13 shows the result of NS2 simulation, LTM simulation, and one of the single channel experimental data. It is found that, on a single channel, the packet drop rate of NS2 simulation is stable over the time but the LTM simulation result has variations over time. Compared with the experimental result, LTM is more similar to the real situation.
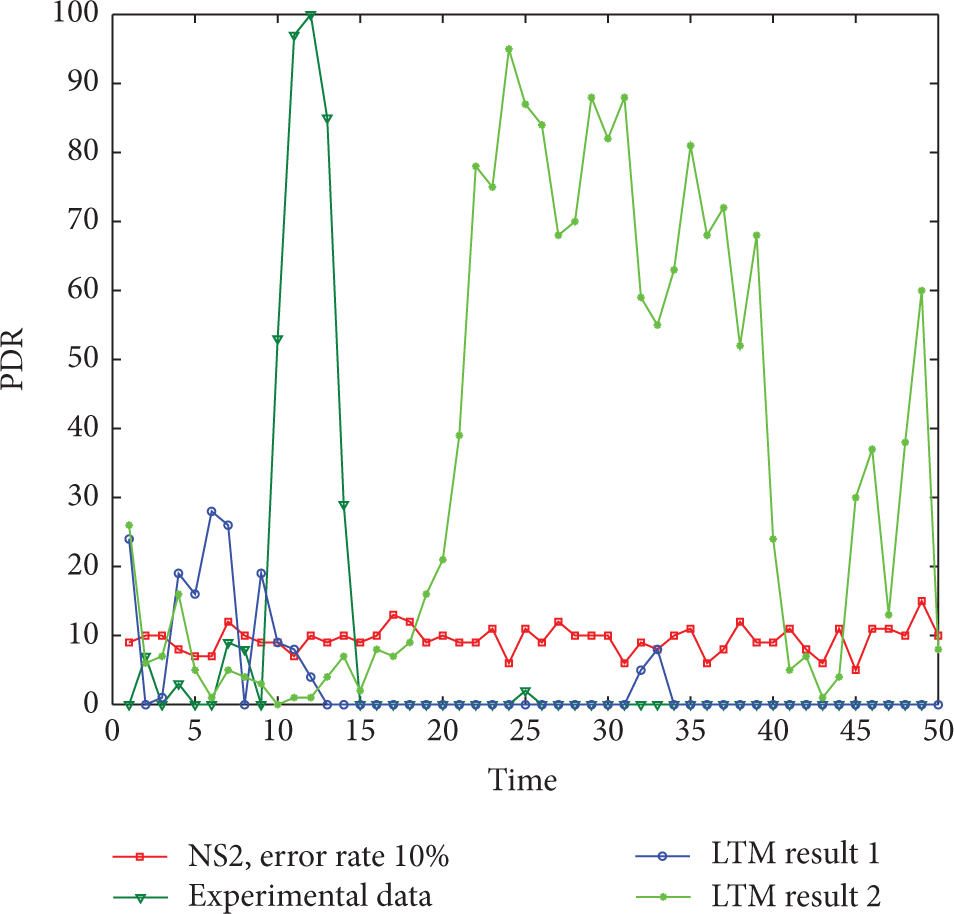
Link reliability of NS2, LTM simulation, and measurement data.
Little modeling work has been done on industrial WSN links. Doherty et al. [26] proposed the first simple time-varying model of industrial WSN. To show the accuracy of LTM, we implemented model of literature [26] and make a comparison of two models.
Figure 14 shows the difference of literature [26] and LTM in average PDR 67%. Literature [26] uses a 24-hour periodic model, which divided the link reliability into four parts, two equal periods in random link reliability, one disconnection period, and one connection period. The time of these four periods depends on average link reliability of the path. LTM shows that, in 24 hours, there may have been more than one connection or disconnection period. In random connection period, literature [26] uses a uniform distribution in

Model outputs of one channel by LTM and Doherty et al. in 24 hours on a path.
5.4.2. Frequency Difference Evaluation
Multichannel simulation in NS2 and other tools often use separate channel settings, and it is difficult to decide the relationship of the channels. LTM considers correlations of the channels in the statistical process and uses Algorithm 7 to generate frequency difference, which is approximated to the facts.
We evaluate two frequency hopping methods in TDMA protocol proposed for IEEE802.15.4e based on LTM model. Simulation example uses star topology with one cluster head and eight sensor nodes. Method A [43] that was used in literature [26] adopted a slotted frequency-hopping method where the nodes successively switch their channels among the 16 IEEE802.15.4 PHY channels on each timeslot. Method B [44] adopted an adaptive frequency hopping method where nodes change to a new channel only when the PDR of current channel is bigger than the predefined threshold value.
The simulation results show that the communication reliabilities between cluster-head and sensor nodes of method B have been improved by 10% to 15% compared to those of method A. As shown in Figure 15, the reliabilities of method A are more uniform, but none of them is higher than anyone of method B.

Simulation results based on LTM model.
Therefore, the temporal and frequency variations of link reliability should be taken into consideration at the design of reliable protocols. According to frequency-varying of the link reliability, frequency diversity is a good way to improve network reliability, while the time-varying characteristics suggest the adaptive frequency hopping to achieve better reliability other than slotted frequency hopping.
6. Conclusion
Link reliability model will dramatically affect the protocol simulation results. Traditional protocol simulation often uses random deployment and disk model or irregularity disk model. But in industrial environment, most of the links are distance fixed, and link reliability is varying over time and frequency. Therefore LTM is more realistic for the link reliability simulation of a protocol. For example, for the link in Figure 4(b), if the time-varying characteristics are not considered and channel ch9 is used as the communication channel, even though the protocol can work well during the initial stage, the longtime link failure will happen after a period of time.
This paper used PDR to describe the link reliability and measured PDR at two typical industry factory environments. It has been found that the link reliability varies over time and frequency when the changes of the environment happened. We can classify link reliability into several levels. The regression analysis on each level shows that PDR follows logistic or log-logistic distribution under a certain level, and the interval between two packet drops of PDS follows lognormal distribution, which is a piecewise function of PDR. The variation of the reliability levels also has statistical regulations. Through the statistical analysis on the link characteristics under industry environments, a link layer time-varying model LTM has been proposed for the up-layer protocol's reliability design and simulation. By the simulation on the two proposals of IEEE802.15.4e, we found that, even though the link reliability varies with the time and frequency, the reliability of the link or even overall network can be improved if the statistical regulations of link reliability can be used to design high-reliable protocols, especially for adaptive frequency diversity design.
In future work therefore, we would like to focus on MAC protocol design based on the link reliability characteristics in this paper and analyze the interference from the device on the same frequency and also combine distance/reliability model to complete the LTM model.
Footnotes
Conflict of Interests
The authors declare that there is no conflict of interests regarding the publication of this paper.
Acknowledgment
This work is supported by the National High Technology Research and Development Program of China (no. 2011AA040101) and the National Natural Science Foundation of China (nos. 61304257 and 61003251).