
Abstract
An optimal line pressure control algorithm was proposed for the fuel economy improvement of an AT-based parallel hybrid electric vehicle (HEV). By performing lever analysis at each gear step, the required line pressure was obtained considering the torque ratio of the friction elements. In addition, the required line pressure of the mode clutch was calculated. Based on these results, the optimal line pressure map at each gear step of the EV and HEV modes was presented. Using the line pressure map, an optimal line pressure was performed for the AT input torque and mode. To investigate the proposed line pressure control algorithm, a HEV performance simulator was developed based on the powertrain model of the target HEV, and fuel economy improvement was evaluated. Simulation results showed that as the gear step became higher, the optimal line pressure control could reduce the hydraulic power loss, which gave a 2.2% fuel economy improvement compared to the existing line pressure control for the FTP-72 mode.
1. Introduction
For the 2-shaft parallel hybrid electric vehicle (HEV), the development and control of a transmission that combines and separates the power of the engine and motor are the core technology. The transmissions that have been used in HEV include the continuously variable transmission (CVT), automatic transmission (AT), dual-clutch transmission, (DCT), and automated manual transmission (AMT). Among these, AT has high applicability to the parallel HEV because it has the advantages of using the existing manufacturing line [1–3].
For AT, hydraulic pressure, which is necessary for the friction elements (e.g., the clutch and the brake), should be continuously supplied to transmit the torque, and the required power causes to deteriorate the transmission system efficiency. Therefore, reducing the power loss of the hydraulic control system in the AT-based HEV is important for the vehicle's fuel economy improvement.
In the target AT for HEV, a mechanical oil pump (MOP) and an electric oil pump (EOP) are used to generate hydraulic pressure. As MOP is connected to the AT input shaft and rotates at the same speed as the motor (engine), the speed cannot be controlled independently. Therefore, the only way to reduce the power loss of MOP is to decrease the line pressure of the AT hydraulic control system.
If the line pressure is too low, however, the torque transmission capacity of the clutch and brake, which is required for the torque transmission from the engine or motor, decreases, and a slip may occur in the friction elements. The power, then, cannot be transmitted [4]. On the other hand, if excessive line pressure is supplied, the MOP/EOP will require more power to supply the corresponding line pressure. Therefore, to reduce the power loss of the hydraulic control system, the optimal AT line pressure necessary for the torque transmission of the friction elements needs to be supplied.
To reduce the power loss of a hydraulic control system, a study has performed a calculation of the lock up pressure using the static and dynamic feature of an AT power transmission system [5]. Theoretical model has been suggested for the clutch slip of the AT [6]. Park et al. proposed a method to lower the line pressure for two-stage CVT [7]. Also EOP controls algorithms that control the EOP according to the viscous factor, in other words, automatic transmission fluid (ATF) temperature has been proposed to reduce the power loss of a hydraulic control system [8–10], and its power-saving effect was verified by comparing it with other EOP control algorithms [9].
In the previous study, the optimal line pressure at each gear step of the AT was calculated using lever analysis [11]. The target HEV in this study, however, has a mode clutch for the mode change besides the friction elements for the gear shift, and the required line pressure of the mode clutch could be higher than that of the AT friction elements. Therefore, these need to be considered for the line pressure control.
In this study, using lever analysis, the line pressure of an AT hydraulic control system was obtained for the transmission torque of the friction elements and mode clutch, and the optimal line pressure was determined considering the marginal pressure due to the hysteresis characteristic of the hydraulic control valve. The performance of an optimal line pressure control algorithm was evaluated using the developed HEV performance bench tester. To investigate the proposed line pressure control algorithm, a HEV performance simulator was developed based on the powertrain model of the target HEV and fuel economy improvement was evaluated.
2. Structures of the HEV and the AT Hydraulic Control System
2.1. Structure of the Target HEV
Figure 1 shows the structure of the target HEV. In the target HEV, the torque converter was removed from the 6-speed AT, and a motor and a mode clutch were installed in its place. The mode clutch cuts off or connects the power. In the electric vehicle (EV) mode, the mode clutch is disengaged, and the vehicle is driven by the motor using the electric energy of the battery. In the HEV mode, the mode clutch is engaged, and the vehicle is driven by both the engine and the motor.

Structure of the target HEV.
For the mode change from EV to HEV mode, the engine is cranked up using the integrated starter generator (ISG), and the mode change is performed by engaging the mode clutch when the engine speed becomes equal to the motor speed. In regenerative braking, the kinetic energy of the vehicle is converted to the electric energy and is stored in the battery by disengaging the mode clutch and using the motor as a generator.
2.2. Structure of the AT Hydraulic Control System Including Oil Pump System
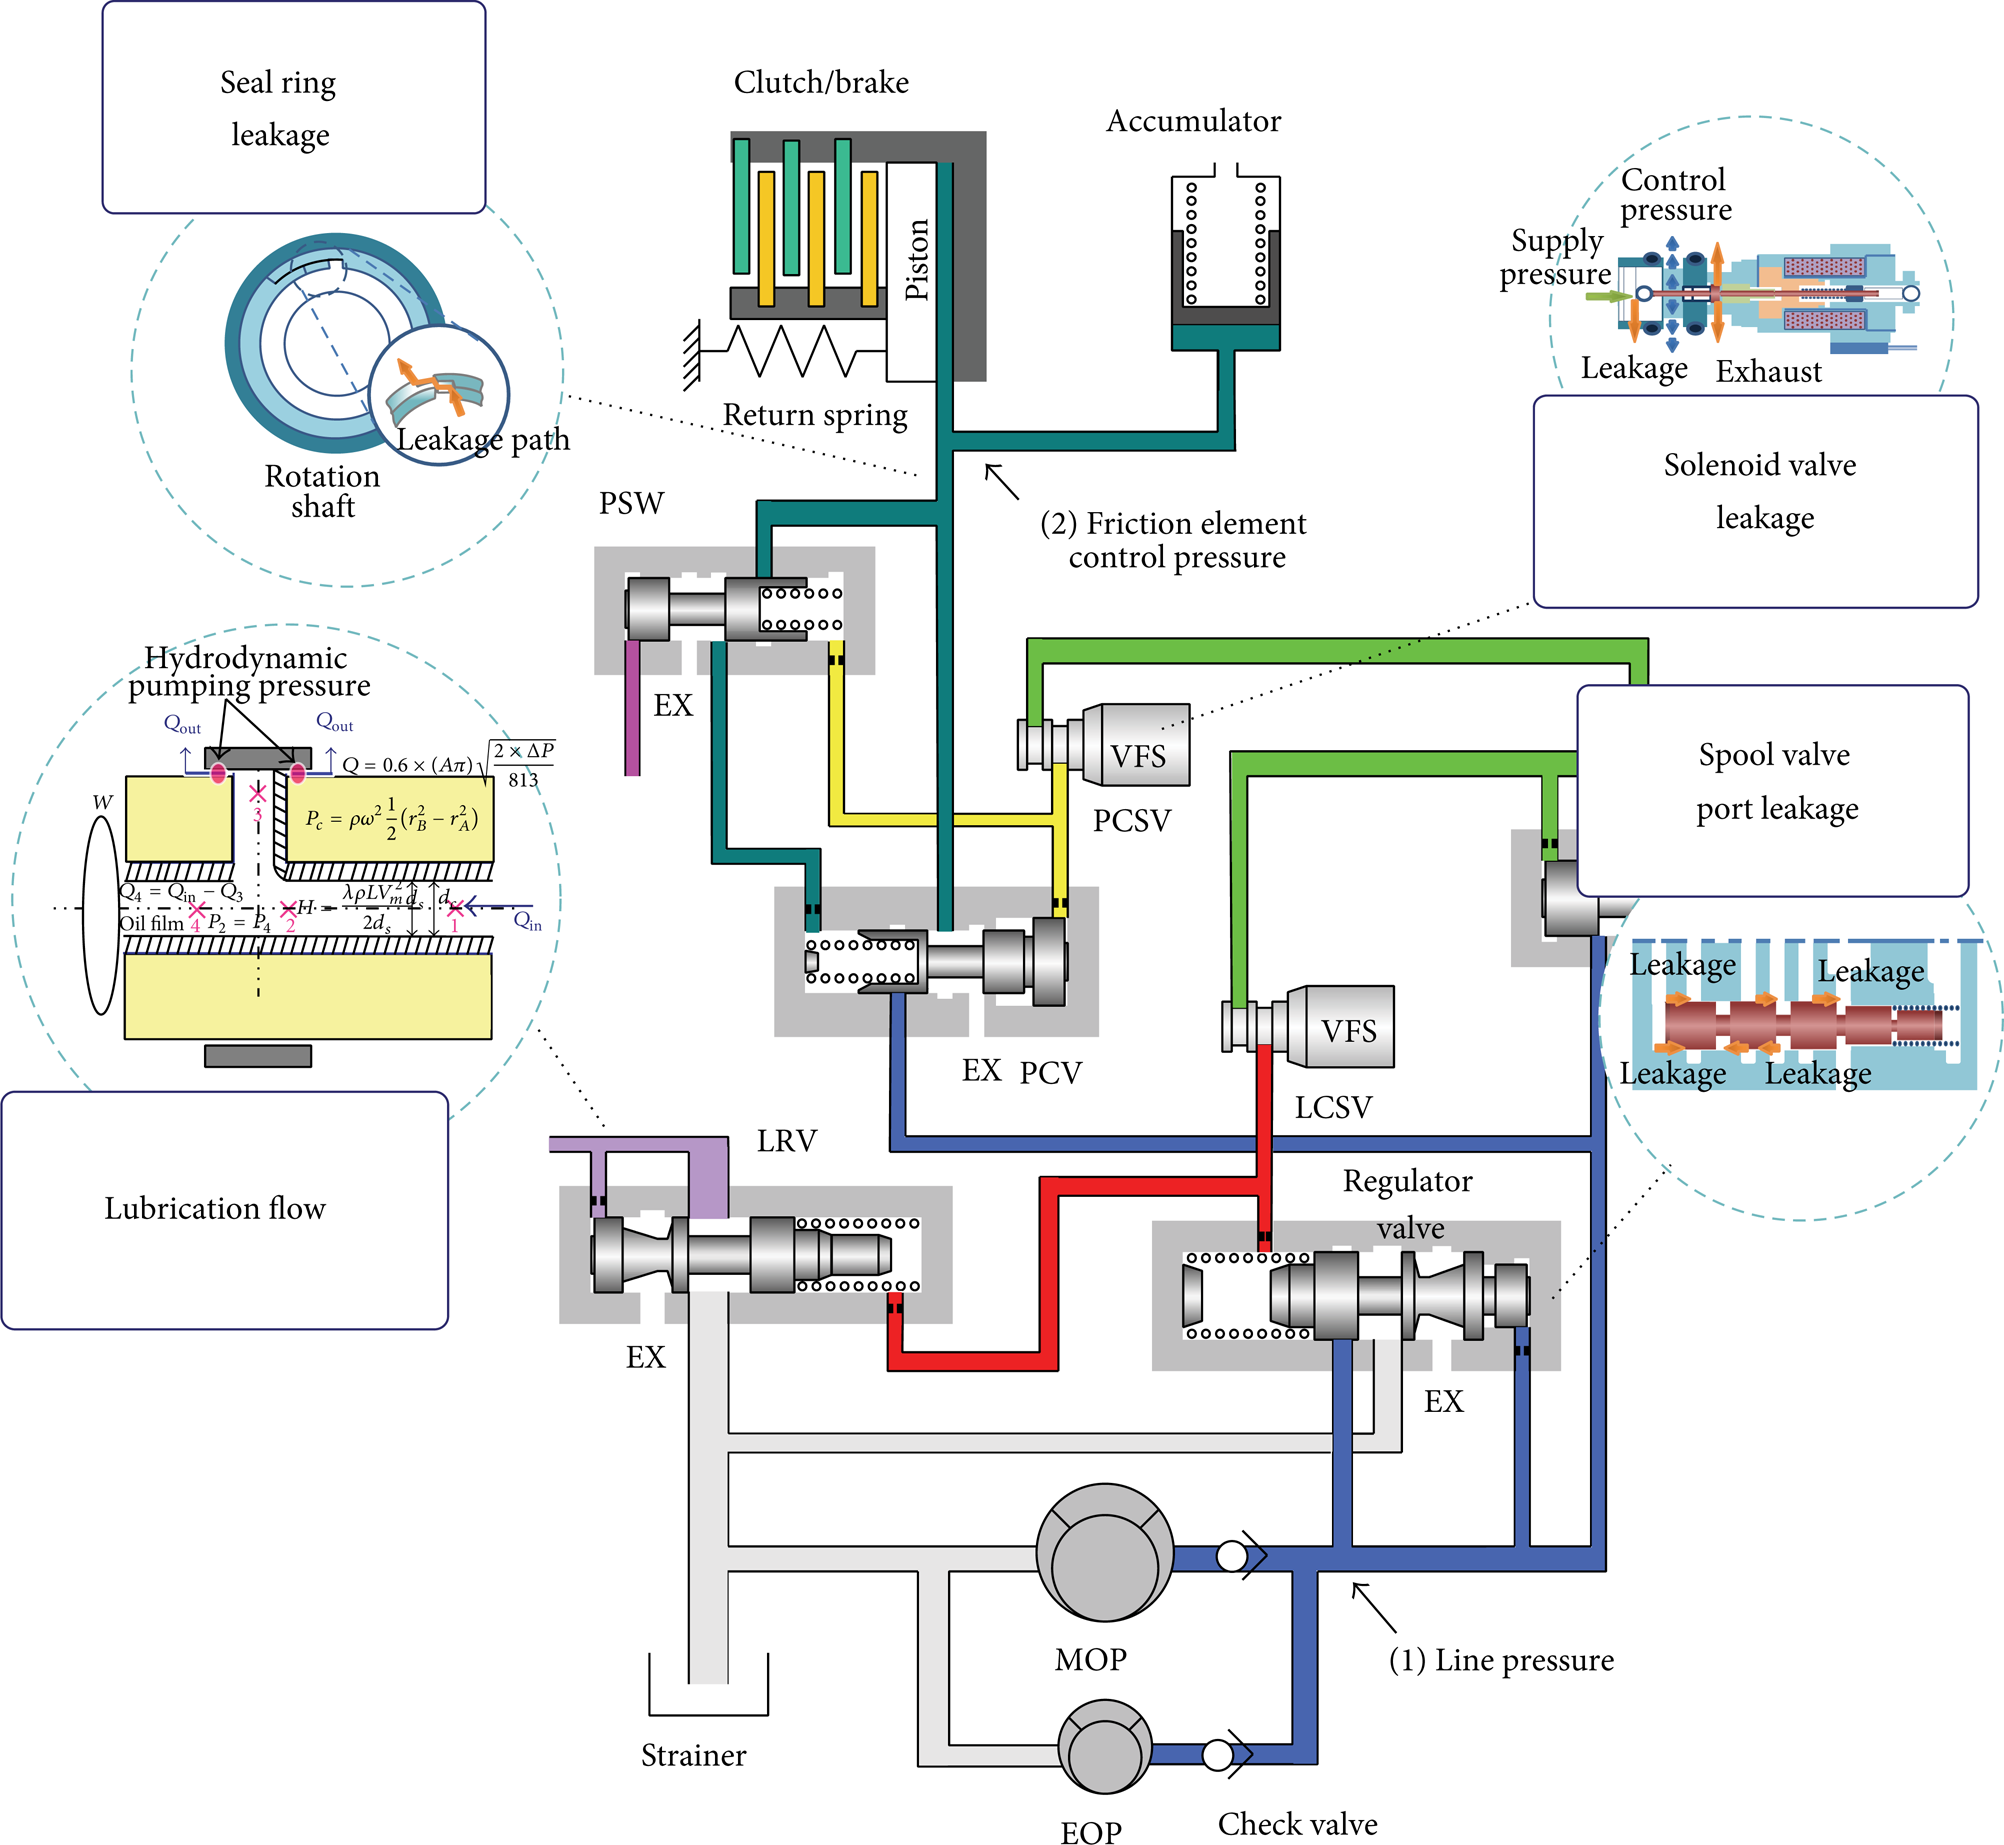
Figure 2 shows the AT hydraulic control system for the target HEV. As shown in Figure 2, the hydraulic control system of the target HEV generates the flow to supply (1) line pressure and (2) friction element control pressure. The flow consumption, Qreq, in the hydraulic system consists of spool valve port leakage, solenoid valve leakage, sealing leakage, and lubrication flow [10]. The spool valve port leakage and solenoid valve leakage occur mainly in the clearance between the spool and the housing, and these leakages are released via the valve port. The leakage caused at the spool valve is proportional to the pressure difference between the valves. The seal ring leakage occurs due to the pressure difference between the two sides of this cut section. The lubrication flow is supplied to the clutch and brake inside the AT via each hole along the lubrication axis. The lubrication flow is determined by the axis rotation speed, oil hole size, and distance between oil holes. The flow consumption, Qreq, is expressed as follows:

where ν is the ATF viscosity, Qspool_leak the spool valve leakage, Qseal_leak the sealing leakage, Qsol_leak the solenoid valve leakage, and Qlub the lubrication flow. The flow consumption in (1) also depends on the ATF temperature since the ATF viscosity decreases with temperature rise, and accordingly, the hydraulic system leakage increases [10]. The flow from 3l pm (liter per minute) to 23l pm should be supplied continuously when the ATF temperature changes from −30°C to 120°C.
AT hydraulic control system for the HEV [10].
In the target HEV, the oil pump system consists of EOP and MOP. The MOP, connected to the AT input shaft, and the EOP, which consists of an oil pump unit, motor unit, and control unit, are installed in parallel.
The MOP operates at the same speed as the AT input shaft when the vehicle is driven, so when the engine is in idle stop state as when the vehicle stops, the MOP does not rotate. In this case, the EOP is used to supply the amount of flow required by the hydraulic control system until the vehicle reaches a threshold velocity after starting.
During idle stop, only the EOP supplies flow, but when the vehicle starts, the MOP also supplies flow, so the total flow is the sum of the flows from the two pumps. Thus, the EOP needs to be operated in the range of vehicle velocity in which flow is not stably generated by the MOP alone [8].
The oil pump power to supply the line pressure, P, is expressed as follows:

where P is the line pressure, Tpump the oil pump torque, which is determined by the line pressure, ωpump the oil pump speed, Qreq the required flow, and ηpump the oil pump efficiency.
In this paper, it is assumed that flow is sufficiently supplied by the oil pump for a given operation temperature and only the line pressure P is considered. As expressed in (2), if the line pressure P is decreased, the consumed power by the MOP and EOP is reduced, which improves the fuel economy.
The line pressure and friction element control pressure are controlled by the solenoid valve and spool valve.
2.2.1. Line Pressure
The regulator valve maintains a required line pressure for the AT hydraulic control system by receiving the flow from the MOP and EOP and by being controlled by the variable-force-solenoid-(VFS)-type line pressure control solenoid valve (LCSV).
2.2.2. Friction Element Control Pressure
The friction element control pressure is controlled by the pressure control valve (PCV)/pressure switching valve (PSW) and is formed only during the friction element engagement. The PCV and PSW are controlled by the VFS-type pressure control solenoid valve (PCSV).
3. Calculation of the Optimal Line Pressure at Each Mode and Gear Step
3.1. The Line Pressure for AT Gear Step
Since the torque capacity of the ith friction element within the AT should be larger than the torque acting on the friction element (T i ), it should satisfy the following:

where P i is the applied pressure of the ith friction element and C i is the torque capacity coefficient of the ith friction element. C i is expressed as follows:

where μ is the friction coefficient of the clutch, R i is the effective radius of the friction element, and A i is the pressure area of the friction element. The torque acting on the ith friction element (T i ) and the AT input torque (TInput) have the following relationship:

where N i is the torque ratio of the ith friction element to the AT input torque. It varies depending on the gear ratio of each gear step. Using the lever analysis, N i can be calculated as follows.
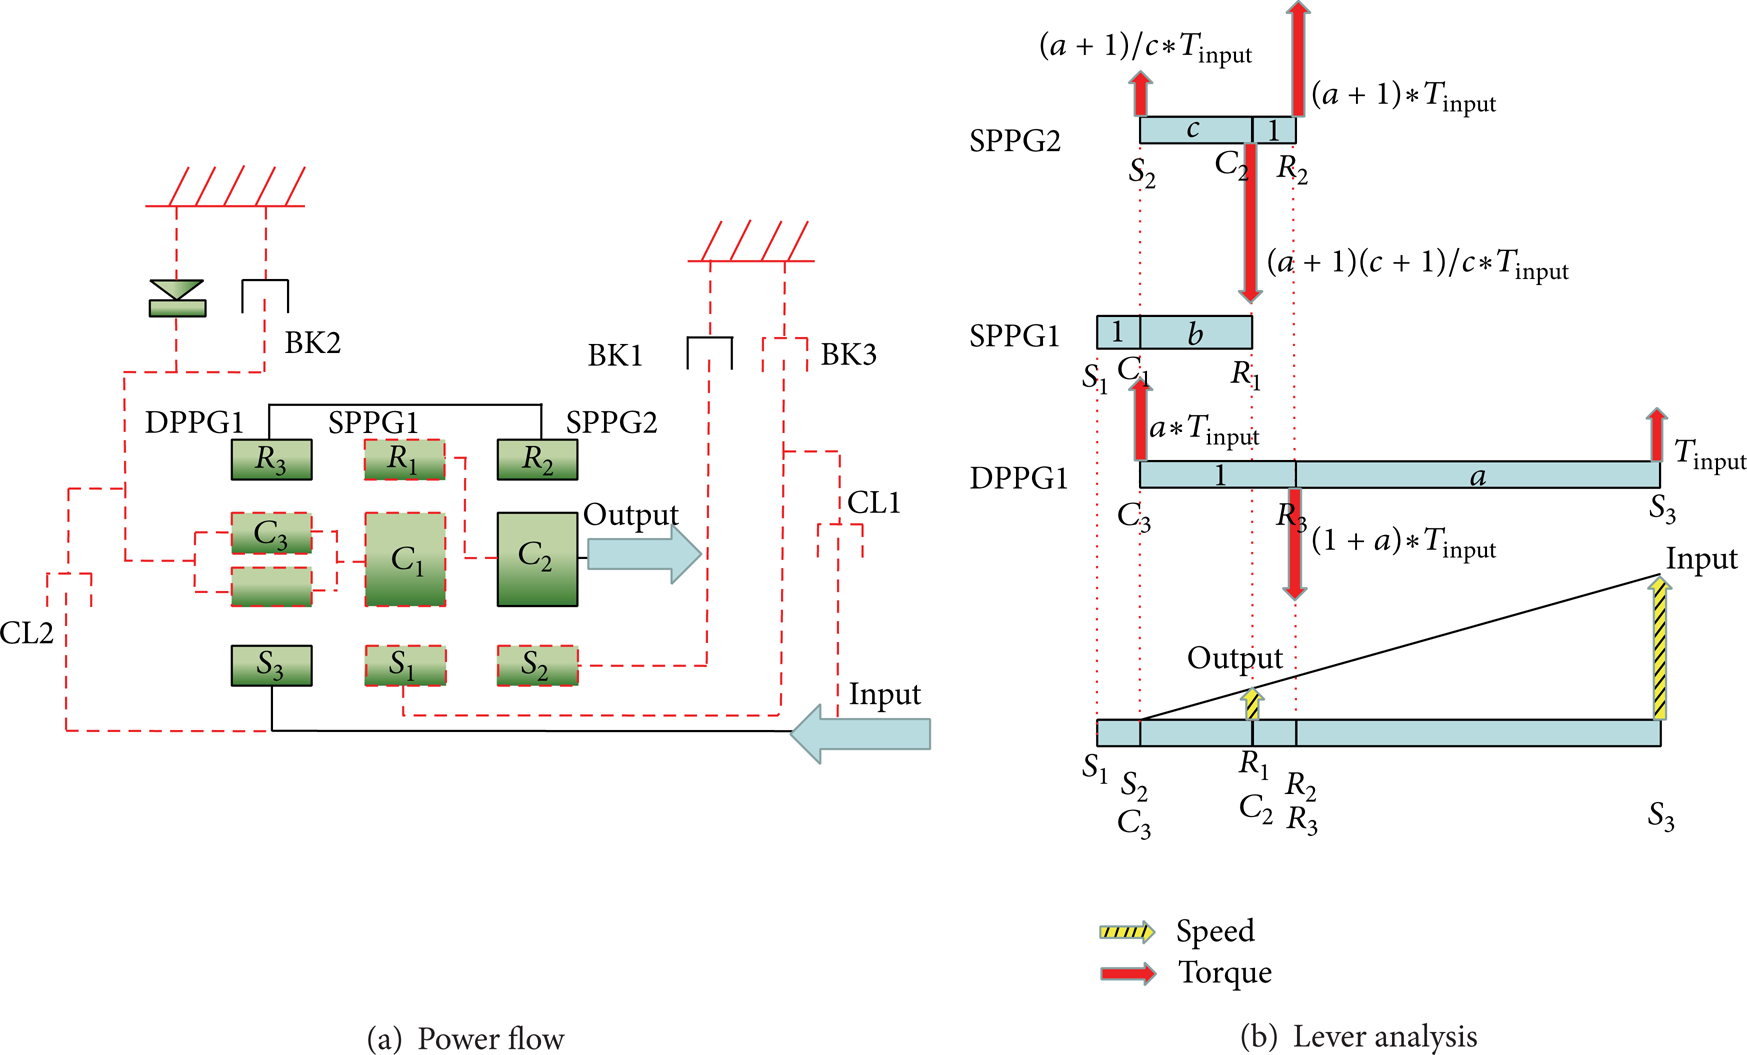
Calculation of N i at the 1st Gear. Figure 3 shows the torque and speed relationship based on the power flow and lever analysis of the 6-speed AT for the target HEV at the 1st gear. At the 1st gear, brakes BK1 and BK2 are engaged. As the target AT consists of two single-pinion planetary gear (SPPG1 and SPPG2) and one double-pinion planetary gear (DPPG1), the torque ratio of each planetary gear can be expressed using a total of three levers. The lever ratio varies depending on the numbers of the ring and sun gear teeth for the planetary gear, and the lever ratio of SPPG1 is expressed as b = R1/S1, that of SPPG2 as c = R2/S2, and that of DPPG as a = R3/S3 − 1 (Figure 3(b)). R1, R2, and R3 are the numbers of the ring gear teeth for the planetary gear, respectively, and S1, S2, and S3 are the numbers of the sun gear teeth, respectively. When the input torque (TInput) acts on sun gear S3, the torque acting on each friction element is obtained from the lever analysis shown in Figure 3, and it is calculated as NBK1 = (a + 1)/c for brake BK1 and as NBK2 = a for brake BK2. The bottom lever in Figure 3(b) shows the speed ratio by combining the three levers.
Power flow and lever analysis at the 1st gear.
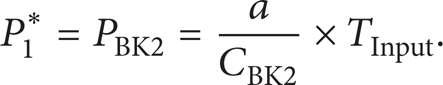
Using NBK1 obtained from the lever analysis and (3) and (5), the torque capacity of friction element BK1 at the 1st gear, is expressed as follows:

Thus, the line pressure for brake BK1 necessary for transmitting the input torque of the AT can be calculated as follows:

PBK2 can be calculated using the same method as follows:
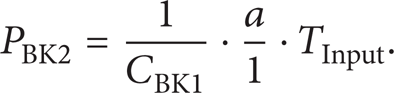
Among PBK1 and PBK2, a larger value should be selected as the line pressure to satisfy both (7) and (8). As PBK2 is larger at the 1st gear, the required line pressure at the 1st gear (P1) can be calculated as
The line pressure at the 2nd, 3rd, 4th, 5th, and 6th gear can be obtained in a similar manner.
3.2. The Required Line Pressure for the Mode Clutch
3.2.1. EV Mode
In the EV mode, the mode clutch is disengaged, and there is no need to consider the torque and clutch pressure of the mode clutch. Therefore, the line pressure at the jth gear step for the EV mode (Pj_EV) is equal to P j (j = 1, 2, 3, 4, 5, and 6) obtained in Section 3.1.
3.2.2. HEV Mode
In the HEV mode, the line pressure should be obtained considering the torque applied to the mode clutch and the friction elements in the transmission. As the mode clutch is not connected to the planetary gear in AT, N i = 1, and the required pressure of the mode clutch depending on the AT input torque (PMode) is expressed as follows:

where CMode is the torque capacity coefficient of the mode clutch, which is determined from (4). In the HEV mode, among the required pressures of the friction elements in the AT and the mode clutch, a larger value is selected as the line pressure.
3.3. The Marginal Pressure
In determining the optimal line pressure, the marginal pressure (Pmargin) should be considered. The marginal pressure (Pmargin) was obtained considering (1) the hysteresis characteristics of the LCSV, and (2) the return spring force of the friction elements, as described below.
3.3.1. Line Pressure Hysteresis of the LCSV
Figure 4 shows the test results of the line pressure characteristic of the regulator valve for the rampwise current input. To obtain the line pressure hysteresis, the test was performed at the fastest current variation of the LCSV.

Hysteresis characteristic of the line pressure.
For the LCSV used in the target HEV, the maximum line pressure was observed when the current was not applied because it was the normal/high-(N/H)-type VFS. As shown in Figure 4(a), the line pressure decreased as the applied current increased. The minimum line pressure (Pinit) was obtained at the maximum current, and the pressure again increased as the current decreased.
Using the test results in Figure 4(a), the hysteresis characteristic of the line pressure was obtained as shown in Figure 4(b). In Figure 4(b), Phys was observed due to the hysteresis of the line pressure. This indicates that the actual line pressure can be lower than the required line pressure by as much as Phys, and it needs to be additionally taken into account in determining the optimal line pressure.
3.3.2. Spring Force of the Friction Elements
At each friction element, a return spring is installed. Accordingly, if the force by the line pressure is smaller than the return spring force, the friction elements do not contact and cannot transmit the torque, although pressure is applied. The pressure, at which the friction elements start to transmit torque, is called kissing point pressure (Pkiss), and it needs to be additionally taken into account in determining the optimal line pressure. The kissing point pressure (Pkiss) is expressed as follows:

where F s is the return spring force.
The marginal pressure (Pmargin) is obtained considering the line pressure hysteresis and the kissing point pressure as follows:

3.4. The Optimal Line Pressure
Now, the optimal line pressure of the jth gear step can be determined as

The optimal line pressure in (13) is shown in Figure 5. In Figure 5, Pinit is the minimum line pressure that can be controlled by LCSV.

Optimal line pressure for the transmission input torque.
Table 1 shows the optimal line pressure for each gear step and mode. As shown in Table 1, for 1st and 2nd gear, the optimal line pressures of the EV and HEV modes were identical because the required pressure of the friction elements in the AT was higher than that of the mode clutch.
Optimal line pressure for the transmission input torque and mode.

For 3rd, 4th, 5th, and 6th gear, the required pressure of the mode clutch was higher than that of the friction elements in the AT. Thus, in the HEV mode, where the mode clutch is engaged, the mode clutch pressure was selected as the optimal, and in the EV mode, where the mode clutch is disengaged, the optimal line pressure was selected considering only the friction elements in the AT.
4. Development of HEV Powertrain Model and Performance Simulator
To investigate the line pressure response and fuel economy by the optimal line pressure control algorithm, a HEV performance simulator was developed using dynamic model of the HEV powertrain.
4.1. Dynamic Model of HEV Powertrain
4.1.1. Motor Model
Motor was modeled using the speed-torque characteristic and efficiency map. The motor drives the vehicle while discharging the battery and works as a generator to recuperate the braking energy to charge the battery during the regenerative braking. Figure 6 shows the motor efficiency map for the motor speed and torque.

Motor efficiency characteristic map.
4.1.2. Battery Model
The input and output currents of battery were calculated using the internal resistance model. For the battery internal resistance value, the experimental value according to the battery SOC (state of charge) was used. The battery voltage was represented as

where U a is the voltage, E the electromotive force, i a the current, and Rir the internal resistance. The battery current i a at discharging state can be represented as
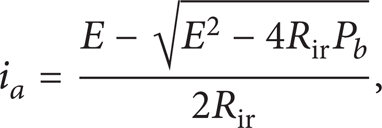
where P b is the battery power. The battery SOC is directly related with the battery capacity, which can be obtained as

4.1.3. Engine Model
The engine dynamics were expressed as follows:

where J e is the engine inertia, θ the throttle open angle, ω e the engine speed, T e the engine torque, Te_brk the engine friction torque, and Tclt the mode clutch transfer torque [12].
4.1.4. Mode Clutch Model
The mode clutch of the HEV under study transmits torque through the friction between plates, which is generated when hydraulic pressure is applied through a wet-type clutch (Figure 7). The mode clutch torque Tclt depends on the clutch pressure and is expressed as follows:

where μ is the clutch friction coefficient, R op the outside diameter of the clutch piston, R ip the inside diameter of the piston, R o the outside diameter of the clutch plate, R i the inside diameter of the clutch plate, P c the clutch pressure, and F s the return spring force.

Structure of the wet-type clutch [13].
4.1.5. 6-Speed AT Model
The 6-speed AT under study consists of two SPPGs (single pinion planetary gear), one DPPG (double pinion planetary gear), two wet-type multiple disc clutches, three wet-type multiple disc brakes, and a one way clutch (Figure 3(a)). The operating elements of the AT such as planetary gear, clutches, and brakes were modeled using the AMESim software. The inertias of the planetary gear such as the ring gear, sun gear, and carrier were considered. The 3rd gear ratio Ngear3 can be expressed as

where ωtm_in is the AT input speed, ωtm_out the AT output speed, R1, R2, and R3 are the numbers of the ring gear teeth for the planetary gear, respectively, and S1, S2, and S3 are the numbers of the sun gear teeth, respectively. The gear ratio of the 1st, 2nd, 4th, 5th, and 6th gear can be obtained in similar way.
4.1.6. Vehicle Model
The vehicle model consists of a drive shaft, tires, and a running resistance. The vehicle dynamic equation used in this study is shown below:

where F l is the road load, F b the brake force, J c the clutch inertia, J tm the AT inertia, J w the wheel inertia, mveh the vehicle mass, R t the tire radius, N f the final reduction gear ratio, N tm the AT gear ratio, and V the vehicle velocity.
The HEV powertrain was modeled using the AMESim software. Table 2 shows the HEV powertrain specifications, component characteristic, and the AMESim model that was developed in this study.
Parallel HEV powertrain specifications and AMESim models.
4.2. Power Distribution Strategy of the Target HEV
4.2.1. EV Mode
In EV mode, the required vehicle power is supplied only by the motor.
4.2.2. HEV Mode
In HEV mode, if the required vehicle power, PWRreq, is less than the engine power on the optimal operating line (OOL) for the minimum fuel consumption, PWRe_OOL, the engine is operated on the OOL while the extra power is used to charge the battery. If PWRreq is greater than PWRe_OOL, the insufficient power is assisted by the motor.
4.2.3. Regenerative Braking Mode
During the regenerative braking mode, the cooperative control is performed using the motor and friction brakes and recuperated braking energy is stored in battery.
4.2.4. Mode Selection Strategy
Figure 8 shows mode selection strategy of the target HEV. The mode selection was performed considering the required vehicle power and vehicle speed. The HEV starts in EV mode. The driving mode changes from EV mode to HEV mode when the required vehicle power, PWRreq, becomes larger than the PWRset_HEV or the vehicle speed V is over Vset_HEV. Regenerative braking mode is selected when PWRreq < 0.

Mode selection strategy.
Based on the power distribution and mode selection strategy, a HEV control unit is developed using MATLAB Simulink.
4.3. HEV Performance Simulator
The HEV performance simulator was developed based on the dynamic models of the HEV powertrain (Figure 9(a)). The controller model, including HPCU (hybrid power control unit), TCU (transmission control unit), and EMS (engine management system), was implemented with the MATLAB Simulink (Figure 9(b)). The control units were interconnected with the HEV powertrain model constructed with AMESim.

HEV performance simulator.
5. Optimal Line Pressure Control at Each Mode and Gear Step
5.1. Optimal Line Pressure Algorithm at Each Mode and Gear Step
Figure 10 shows the optimal line pressure at each gear step for the EV and HEV mode, which took account of Pmargin. In the EV mode (Figure 10(a)), the optimal line pressure increased as the AT input torque increased. The rate of increase varied depending on N i and C i and was different at each gear step. For the EV mode, the optimal line pressure was highest at the 1st gear and was lowest at the 5th gear.

Optimal line pressure map for the AT input torque, gear step, and mode.
In the HEV mode (Figure 10(b)), as the mode clutch is engaged, the torque transmission of the mode clutch needs to be considered. For the 1st and 2nd gear, the optimal line pressure of the HEV mode was identical to that of the EV mode because the optimal line pressure of the friction elements for gear shift was higher than that of the mode clutch. On the other hand, for the 3th, 4th, 5th, and 6th gear, the optimal line pressure of the HEV mode was higher than that of the EV mode because the optimal line pressure of the mode clutch was higher than those of the other friction elements. It had the same value at 3th, 4th, 5th, and 6th gear.
Using the line pressure map (Figure 10), the optimal line pressure control was performed for the AT input torque and mode.
5.2. Development of HEV Performance Bench Tester
To verify the optimal line pressure control algorithm, an HEV performance bench tester was developed. The HEV performance bench tester consists of a motor that replaces the engine, a dynamo motor for applying the vehicle load, a 30 kw driving motor, and a 6-speed AT that is integrated with the driving motor. The speed was measured by the encoders installed at the input and output shafts of the transmission, and the AT input and driveshaft torques were measured using the torque sensor.
Figure 11 shows the structure of the target HEV performance bench tester. The driving motor is controlled by the HPCU (hybrid power control unit). The AT is controlled by the TCU (transmission control unit). The TCU performs the line pressure control and gear shift control by receiving the controller area network (CAN) signal transmitted from LabVIEW.

HEV performance bench tester.
5.3. Verification of the Optimal Line Pressure Control Algorithm
Performance tests of the proposed optimal line pressure control algorithm were carried out, and the results were compared with those of the existing line pressure control algorithm.
5.3.1. Existing Line Pressure Control Algorithm
The line pressure of the AT hydraulic control system was controlled so that it becomes Pinit when the vehicle stops, and so that it is proportional to the magnitude of the AT input torque regardless of the gear step and mode when the vehicle moves.
5.3.2. Optimal Line Pressure Control Algorithm
The line pressure of the AT hydraulic control system was controlled so that it becomes Pinit when the vehicle stops, and so that it becomes Pj_EV or Pj_HEV depending on the AT input torque, mode, and gear step when the vehicle moves.
Figure 12 shows the experimental results of the motor torque (a), results of line pressure (b), and shaft speed (c, d) at the 3rd gear for the EV mode. The test was conducted for the input torque shown in Figure 12(a). For both the existing and optimal line pressure control algorithms, the line pressure changed depending on the AT input torque (Figure 12(b)). For the existing line pressure control, however, the line pressure changed depending only on the AT input torque, regardless of the gear step and mode, whereas for the optimal line pressure control, the line pressure was controlled considering the torque ratio of input torque for the 3rd gear and Pmargin. The optimal line pressure control had a 20% lower line pressure than the existing line pressure control.
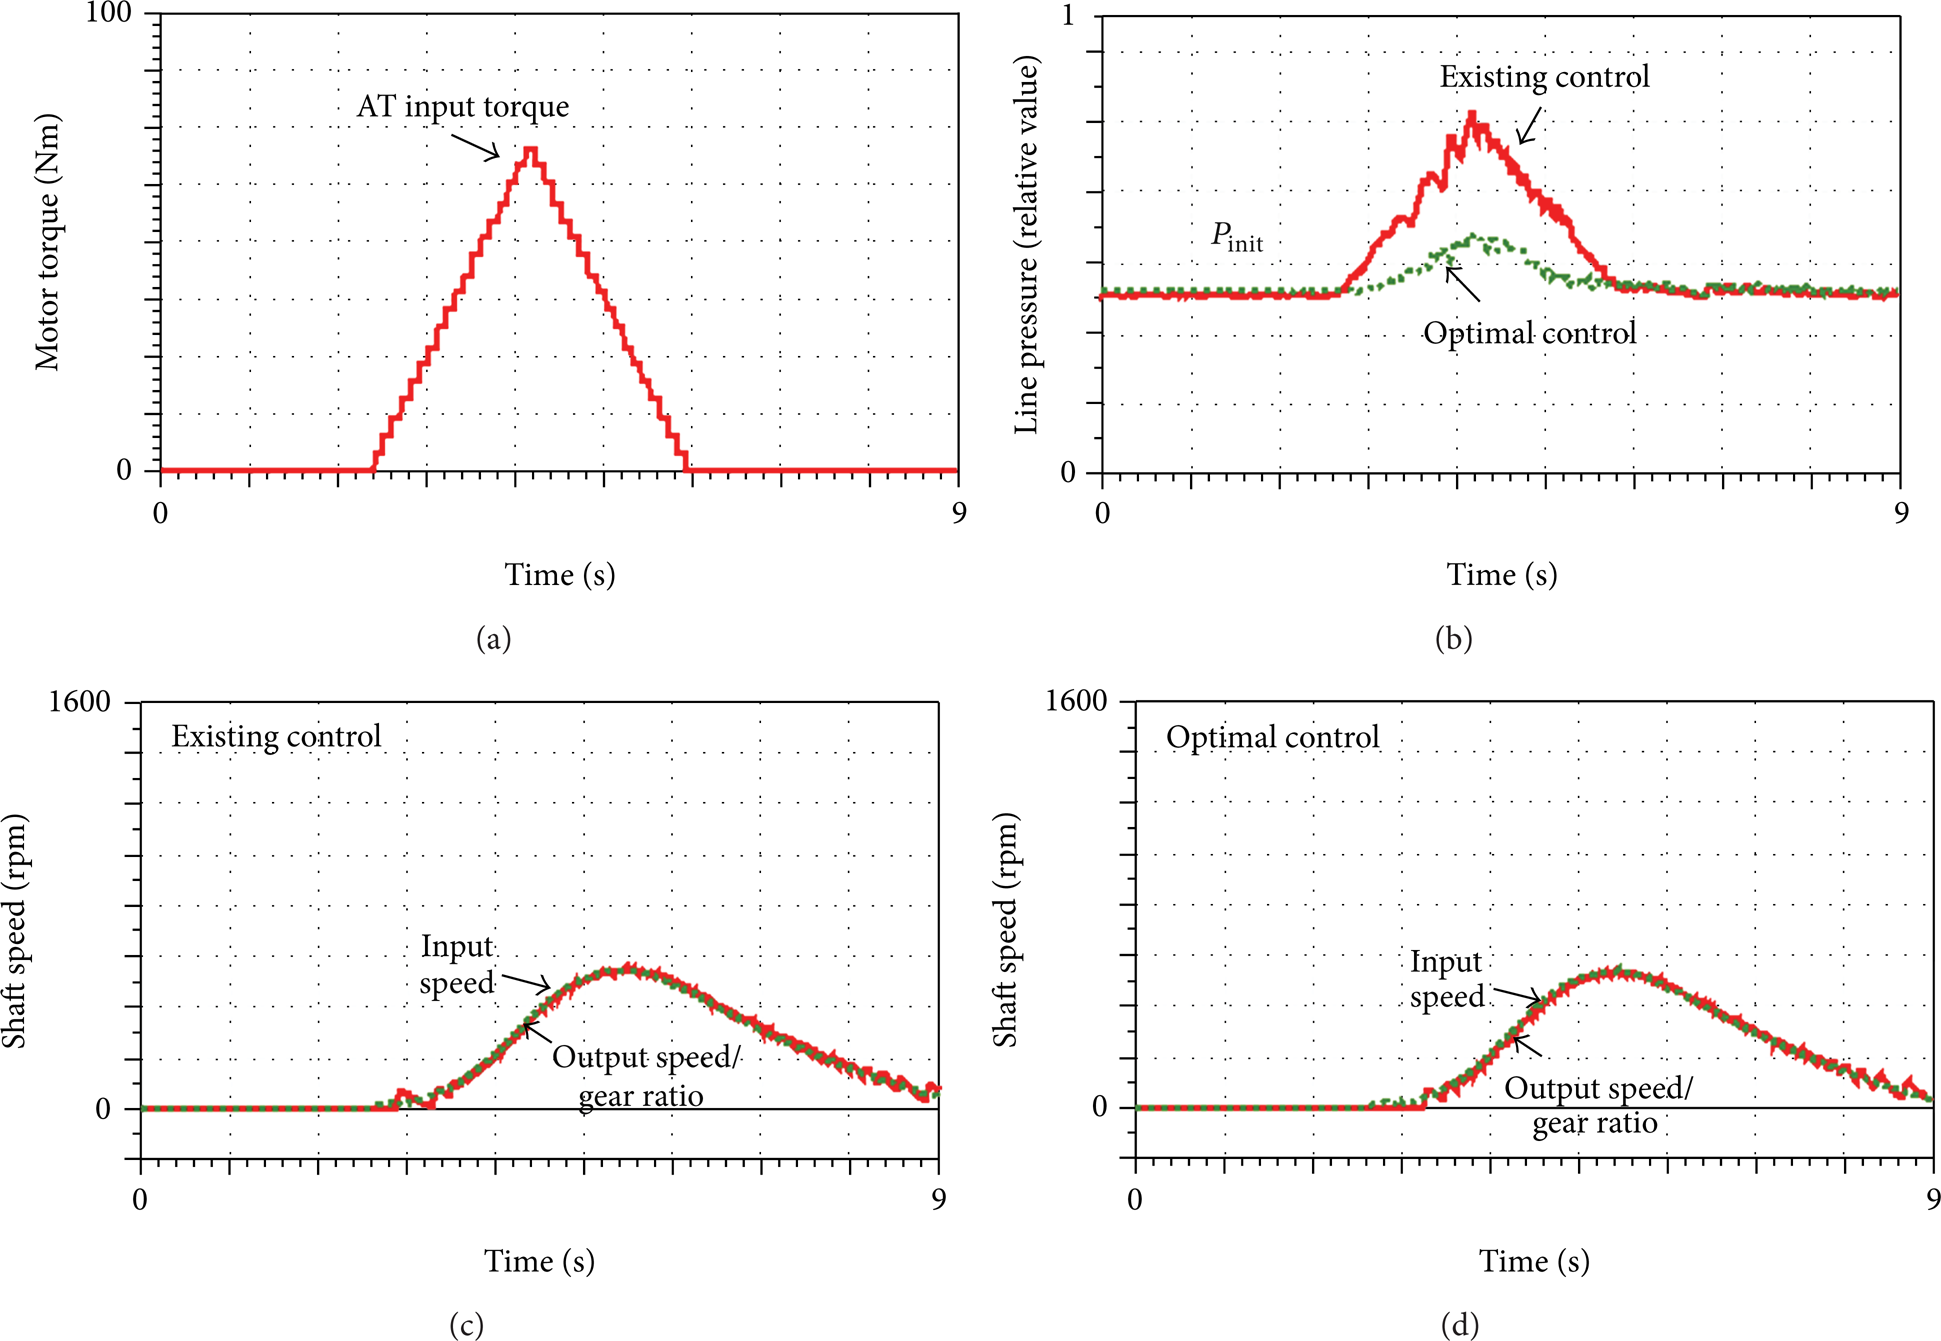
Verification of the line pressure control algorithm at the 3rd gear.
Figure 12(c) (existing line pressure control) and Figure 12(d) (optimal line pressure control) show the AT input and output speeds. The AT output speed was divided by the gear ratio and was then compared with the input speed. If the line pressure is supplied, which is sufficient to maintain the engaged state without the slip of the AT friction elements, the input and output speeds will be identical. For both the existing line pressure control (c) and the optimal line pressure control (d), the test results showed that the input and output speeds were identical, indicating that the power was transmitted without slip. Based on these results, it was found that the optimal line pressure control could maintain a lower line pressure compared to the existing line pressure control while transmitting the power without slip.
Figure 13 shows the test results at the 1st gear for the EV mode. For the input torque, the same values used for the test at the 3rd gear (Figure 12(a)) were also used. For the existing control, the line pressure (b) was identical to that of the test at the 3rd gear because the line pressure was controlled only by the AT input torque regardless of the gear step. On the other hand, for the optimal control, the line pressure was higher than that of the test at 3rd gear because the gear ratio of 1st gear was taken into account. Accordingly, the line pressure difference between the optimal line pressure control and the existing line pressure control decreased compared to that in the test at the 3rd gear. The optimal line pressure control had a 5% lower line pressure than the existing line pressure control.

Verification of the line pressure control algorithm at the 1st gear.
For both the existing and optimal line pressure control algorithms, the AT input and output speed test results verified that the power was transmitted without friction element slip (Figures 13(c) and 13(d)).
5.4. HEV Fuel Economy Simulation
To evaluate the fuel economy improvement by the optimal line pressure control, simulations were performed for FTP-72 mode (Figure 14) using the HEV performance simulator. In Figure 14, simulation results for the region “Q” (t = 345∼360 sec) were compared with those of the existing control algorithm.

FTP-72-mode driving.
The vehicle speed (a), accelerator pedal position and input torque (b), mode and gear step (c), and line pressure (d) are shown in Figure 15. The mode change from EV to HEV was performed at point M (t = 349 sec) when the accelerator pedal position increased.
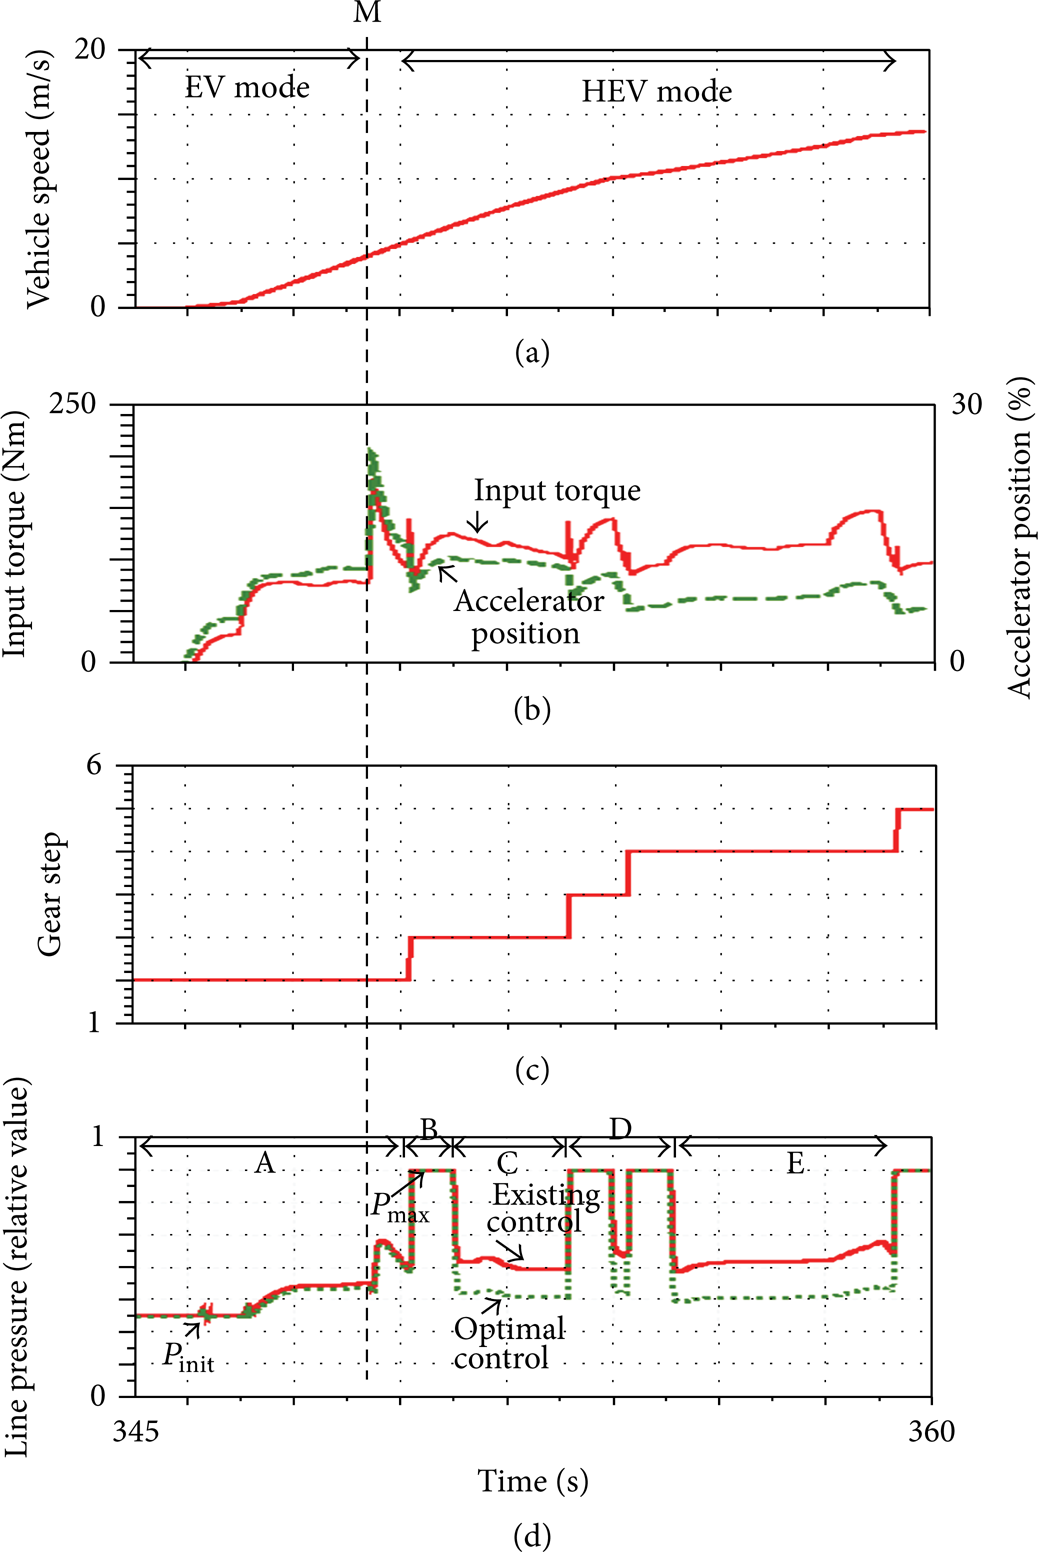
Performance simulation for FTP-72-mode driving.
Figure 15(d) shows the line pressure for the existing and optimal line pressure control algorithms. Before the vehicle starts (vehicle speed = 0), both line pressure control algorithms maintained Pinit. In section A, at the 1st gear, the line pressure changed according to the input torque. The two line pressure control algorithms showed similar results at 1st gear, but the optimal line pressure control had a 5% lower line pressure than the existing line pressure control. Mode change occurred at t = 349 sec, but as the optimal line pressures of the EV and HEV modes were identical at the 1st gear (P1_EV = P1_HEV), there was no change in the line pressure for the mode change. Section B was the gear shift transient section, where gear shift was performed from the 1st gear to the 2nd gear. At this moment, the line pressure was maintained at the maximum pressure (Pmax) for 0.8 sec to lock up the friction elements [10]. Section C was the 2nd gear driving section. It is seen that the line pressure of the optimal line pressure control algorithm was much lower than that of the existing line pressure control algorithm. Section D was the section where 2nd to 3rd and 3rd to 4th gear shift were performed. Pmax was observed at the transient state during the gear shift. Section E was the 4th gear driving section in the HEV mode, and the line pressure of the optimal line pressure control was lower than that of the existing line pressure control. As shown in Figure 10, the optimal line pressure at 4th gear was lower than that at 2nd gear. Thus, the line pressure at 4th gear was found to be about 18% lower than that at 2nd gear.
For both the existing and optimal line pressure control algorithms, the line pressure changed depending on the AT input torque which was described in Figure 15(b). For the existing line pressure control, the line pressure changed depending only on the AT input torque, regardless of the gear step. However, for the optimal line pressure control, the line pressure was controlled considering the torque ratio of input torque (Figure 15(b)) for the 1st, 2nd, 3rd, and 4th gear.
The simulation results indicated that the line pressure of the optimal line pressure control was not significantly different from that of the existing line pressure control at 1st gear because the torque exerted on the friction elements was the highest, whereas the line pressure of the optimal line pressure control was noticeably lower than that of the existing line pressure control at the 2nd–4th gear because the required line pressure was low since the torque ratio of the friction elements decreased as the gear step became higher, and thus, it could maintain low line pressure and reduce the hydraulic power loss.
Figure 16 shows the result of the fuel economy simulation for FTP-72-mode driving. The fuel consumption for the existing line pressure control was 407.3 g, and that for the optimal line pressure control was 398.0 g. The application of the optimal line pressure control had a 2.2% fuel economy improvement effect. Based on this result, it was found that the proposed optimal line pressure control at each mode and gear step could improve the fuel economy of the target HEV.

Fuel economy simulation for FTP-72-mode driving.
6. Conclusion
An optimal line pressure control algorithm at each mode and gear step was proposed for the fuel economy improvement of an AT-based parallel HEV. By performing lever analysis at each gear step, the required line pressure was obtained considering the torque ratio, and the marginal pressure was obtained considering the hysteresis characteristic of the line pressure control valve and the return spring force of the friction elements. Also, the required line pressure of the mode clutch was calculated and compared with the required line pressure of the AT friction elements, which gave the optimal line pressure at each mode. Based on this result, the optimal line pressure map at each gear step of the EV and HEV modes was presented. Using the line pressure map, an optimal line pressure control was performed for the AT input torque and mode.
To verify the proposed optimal line pressure control algorithm, an HEV performance bench tester was developed and the optimal line pressure control performance was investigated. The test results showed that the optimal line pressure control could maintain a lower line pressure than the existing line pressure control while transmitting the power without friction element slip.
To evaluate the line pressure response and fuel economy improvement by the optimal line pressure control, target HEV powertrain modeling was performed and an HEV performance simulator was developed. It was found from the simulation results that the line pressure of the optimal control was not significantly different from that of the existing control at the 1st gear because the torque ratio of the friction elements was high, whereas the line pressure of the optimal control was noticeably lower than that of the existing control at high gear steps because the required line pressure was low due to the low torque ratio of the friction elements. As the gear step became higher, the torque ratio of the friction elements decreased, and thus the optimal line pressure control could reduce the hydraulic power loss. In the FTP-72-mode driving, the optimal line pressure control had a 2.2% fuel economy improvement compared to the existing line pressure control. It is expected that the proposed optimal line pressure control at each mode and gear step can improve the fuel economy of the target HEV.
Conflict of Interests
The authors declare that there is no conflict of interests regarding the publication of this paper.
Footnotes
Acknowledgment
This work was supported by the Technology Innovation Program funded by the Ministry of Trade, Industry, and Energy (MOTIE, Korea).